

t_kimura/iStock via Getty Images
Introduction
Last July I wrote an article describing the asymmetric risk reward profile for Abaxx Technologies (OTCQX:ABXXF), a Canadian technology firm looking to disrupt both commodity exchanges and identity management with their suite of Web3 productivity tools. As discussed in that article, I see Abaxx as a particularly attractive investment. Based on my sum-of-the-parts analysis Abaxx is worth substantially more than its current market value–a gap that has only widened over the last year.
While the last year has seen a couple delays occur to the company’s exchange launch, the firm has managed to keep a strong working capital position and was never at risk of diluting shareholders. In fact, a recent update to my sum of the parts “SOTP” analysis suggests a fair valuation of $3.71 CAD per share. Please note the new additions to the SOTP relate to the Base Carbon revenues royalty, as well as 19.339 million shares of Base Carbon owned by Abaxx, which was marked to market at $0.54 CAD at the time of writing the article.
Abaxx Sum Of the Parts Analysis (Author)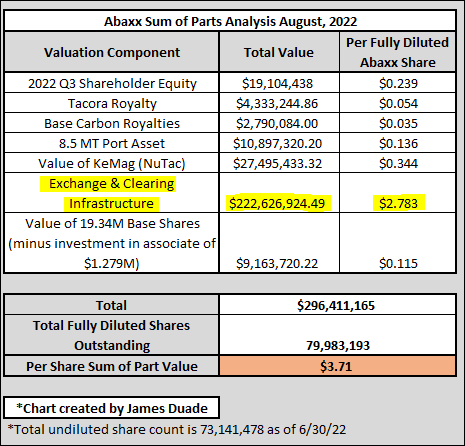
Readers will also recall, that the exchange & clearing infrastructure is quite valuable. In 2013 Singapore Mercantile Exchange sold just their exchange and clearing infrastructure to Intercontinental Exchange (ICE) for $150 million USD. Inflating that by 3% per annum over a nine year period, would result in a value of $244.6 million CAD. This 2013 transaction between SMX and ICE provides a market comparison to evaluate the current market value of Abaxx–which is not affiliated with either ICE or SMX. Since Abaxx owns 91% of Abaxx Exchange, in my view, their exchange alone is worth $2.78 per share, about $0.60 more than their current share price of $2.18 CAD (closing price on Friday, September 2nd).
Value of Abaxx Exchange (Author)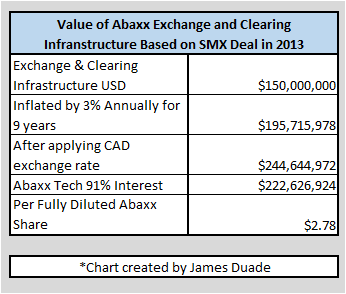
Abaxx has made some recent announcements in May and August that suggests that the company is making a significant transition moving from a development phase startup towards a growth revenue phase.
The article below will provide a brief review of the recent disclosures by the company, provide insight into the company’s existing revenue royalty streams, and then focus on the enormous multi-billion dollar potential of Abaxx’s proposed benchmark contracts in Carbon and LNG. At the end of the article I will summarize the bear case for Abaxx, and close with a case study of the last exchange to launch a physically delivered benchmark contract.
Abaxx’s Recent Shareholder Updates
Despite acknowledging some delays to the launch of their exchange–originally scheduled for Q1 of 2022–the company was able to pull important software work forward in 2022. Abaxx’s initial plans were to launch an exchange that utilized traditional trading and clearing software, which would eventually be updated to the company’s Web3 blockchain based software at a later point in time. Towards that end, Abaxx announced this past May, that they began collaborating with respected Web3 financial market engineers Exberry and Baymarkets to support the final configuration and implementation of their front-end trading software, and back end clearing software.
On Tuesday, August, 16th Abaxx provided their 2022 Q2 Update, which officially announced that the company was in the process of onboarding their Futures Commission Merchants and launching their Singapore based commodity exchange and clearinghouse in early 2023. Furthermore, the company announced that it was in talks to create strategic partnerships for the exchange with industry participants prior to the launch of the exchange and clearinghouse.
A number of strategic investors have expressed interest in Abaxx, including but not limited to a potential partnership program for exchange and clearing participants directly at the Abaxx Singapore (ACX) level. As such program, if as and when entered into, would be subject to prior regulatory approval by MAS.
In addition to the significant disclosures around the full stack Singapore exchange launch and potential strategic partnerships, Abaxx also disclosed that they were evaluating an up listing to a “senior” US exchange such as the NASDAQ (NDAQ).
How Can Abaxx Satisfy a Senior US Exchange Listing Requirements?
Abaxx currently does not meet the standards for a senior U.S. Exchange up listing, but could theoretically meet it by selling equity in their Singapore exchange, which they noted as a possibility in their August, 16th press release.
For instance, as discussed in the Nasdaq listing requirements, a company can be listed if it meets one of the following four criteria. Abaxx could potentially meet criterion number four if they sell a portion of their Singapore exchange, which they discussed as a possibility in their most recent press release. The four Nasdaq listing criterion are below:
1) Aggregate earnings of at least $11 million over the past three years, with at least earnings of $2.2 million in each year, and no year of negative earnings.
2) Aggregate cash flow of at least $27.5 million over the past three years, with no years of negative cash flows. Minimum market cap of $550 million, with revenue in the previous year of at least $110 million.
3) Cash flow requirements in criteria number two can be removed if the market cap of the company is in excess of $850 million.
4) The cash flow and revenue requirements above can be eliminated if the company has total assets of at least $80 million, with stock holder equity of at least $55 million. In this scenario the company’s market cap must be at least $160 million.
As mentioned in the SOTP analysis in the introduction above, Abaxx’s exchange could be priced at $200 million USD if we use the SMX sale from 2013 to ICE as a comparison. Abaxx could in theory sell a 30-40% interest in their exchange to strategic partners at this valuation, and raise between $60 – $80 million USD in cash. This hypothetical scenario would leave Abaxx with a 51-61% interest in the exchange, but would provide Abaxx Tech and the Abaxx Exchange with sufficient cash assets to satisfy working capital requirements and also satisfy the total stock holder equity requirement for a Nasdaq listing as well.
This appears to be a story that will develop over the coming months, but could provide a tailwind if and when it happens.
What Happened to Abaxx Stock in 2022?
Unexpected delays to the launch of their exchange, as noted by management in the winter and spring, pushed back the company’s exchange launch timelines back by approximately a year. These delays caused a crisis of confidence amongst the retail shareholders, and many retail investors dumped the stock in March and April following the delay announcement. Since Abaxx is relatively thinly traded on the OTC and the Canadian NEO, and has an investor base that is almost entirely retail (20% of the stock is owned by management and directors), the stock price dropped precipitously when only a small fraction of retail holders sold their positions. Of note is the fact that Abaxx is only held by approximately 3% institutions and fund ownership. Since no institutions or funds stepped in to buy the stock during the downturn, a small number of frustrated retail investors were able to send the illiquid stock price down to below $1.00 USD on the OTC market.
Abaxx Tech Percent Ownership by Funds (Morning Star)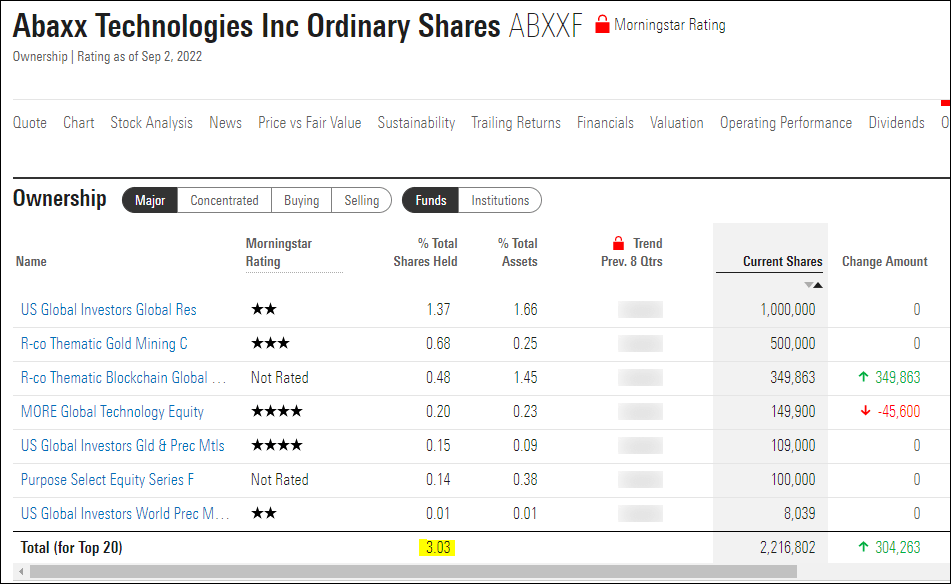
In the author’s opinion once the exchange launch is de-risked and final regulatory approvals are in place, then investors will see Abaxx as a less risky bet–this scenario is already playing out since the August 16th press release with the stock price climbing almost 100% in the month of August. Furthermore, I anticipate that the formal marketing and launch of the exchange, combined with a senior stock exchange up listing will drive interest from both funds and institutions as Abaxx transitions into a revenue generating company.
Lastly, if Abaxx is able to achieve their exchange launch milestones, then investors may see some enormous positive tailwinds once institutions and funds begin to buy into Abaxx. This demand for Abaxx stock could create a significant supply and demand imbalance for Abaxx’s shares, which in turn would push Abaxx’s price higher, creating a virtuous cycle for the share price.
Abaxx Discounted Cash Flow Excel File
A detailed spreadsheet describing all valuations and assumptions shared in this article is provided below. Please open the spreadsheet, and refer to it for any questions or concerns regarding assumptions or calculations. Please note that the file is constructed to be “open source” so that readers can modify my assumptions should they choose. In fact, I encourage readers to play with and modify the assumptions in this file.
Abaxx Technologies Discounted Cash Flow Model Excel File
Abaxx’s Transition to a Revenue Growth Phase
The announcement on August 16th was significant, as Abaxx expressed that the company is “transitioning to a revenue growth phase” from a development phase. Revenues for the company will come predominantly from two sources, the first being royalties, and the second from their 91% interest in the exchange itself.
Future Abaxx Technologies royalties will stream in from four distinct buckets. Please note that both Base Carbon and Tacora are contractually obligated to provide the royalties described below. The four royalty buckets are:
- First, from a 2.5% revenue royalty on the sale of carbon credits from Abaxx’s spin out Base Carbon (OTCQX:BCBNF). Currently Base Carbon has two carbon streaming projects based in Vietnam and Rwanda respectively, and both projects expect revenue streams to begin in earnest in 2023–see below for detailed valuations of these projects, as well as a detailed valuation of Base Carbon as a whole. Base Carbon has the ability to cancel the Abaxx Technologies revenue royalty by paying Abaxx a lump sum of $150 million USD. Abaxx still owns 19,339,593 shares of Base Carbon as of 6/30/22.
- Second, from a 2.0% royalty on all revenues generated from the Abaxx Exchange. Abaxx has the option to increase this royalty to 3% by paying Abaxx Exchange $10 million USD. Readers should review the DCF portion of this article in order to gain perspective on the royalty generating potential of Abaxx Exchange.
- Third, from a $0.10 CAD per tonne royalty revenue on production shipped out of the Port of Sept-Iles by Tacora Resources through 2033 at their Scully Mine. For its part Tacora resources has indicated that they recently completed an upgrade at their mine, which will allow them to ramp up production to 6.0 million tonnes per year. Another firm, Scully Royalty Ltd. (SRL) which owns a revenue royalty on the Scully mine, reported in their 2021 20-F filing that the Tacora Scully mine produced 2.99 million tonnes of iron ore in 2020 and 3.18 million tonnes in 2021 respectively, meaning that Abaxx received $318k in royalties from Tacora in 2021 and $299k in 2020.
Scully Mine Production 2019-2021 (SEC Filings)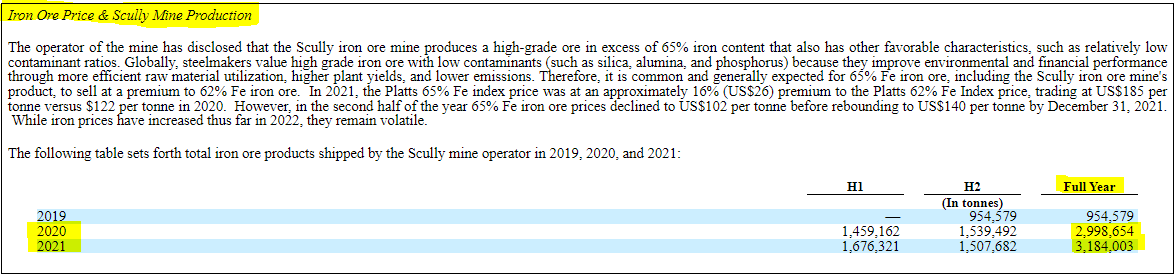
- Lastly, from future revenue royalties from firms utilizing Abaxx Tech’s ID++ or Web3 productivity tools. These deals will likely be similar to the Base Carbon deal mentioned above.
In total the current Base Carbon and Tacora port royalties will result in approximately $1-$1.2 million CAD in revenues each year–see charts below–and revenues will only grow further as Base Carbon adds additional carbon credit projects and Abaxx Exchange ramps up operations.
Base Carbon Rwanda Cook Stove Project (Author)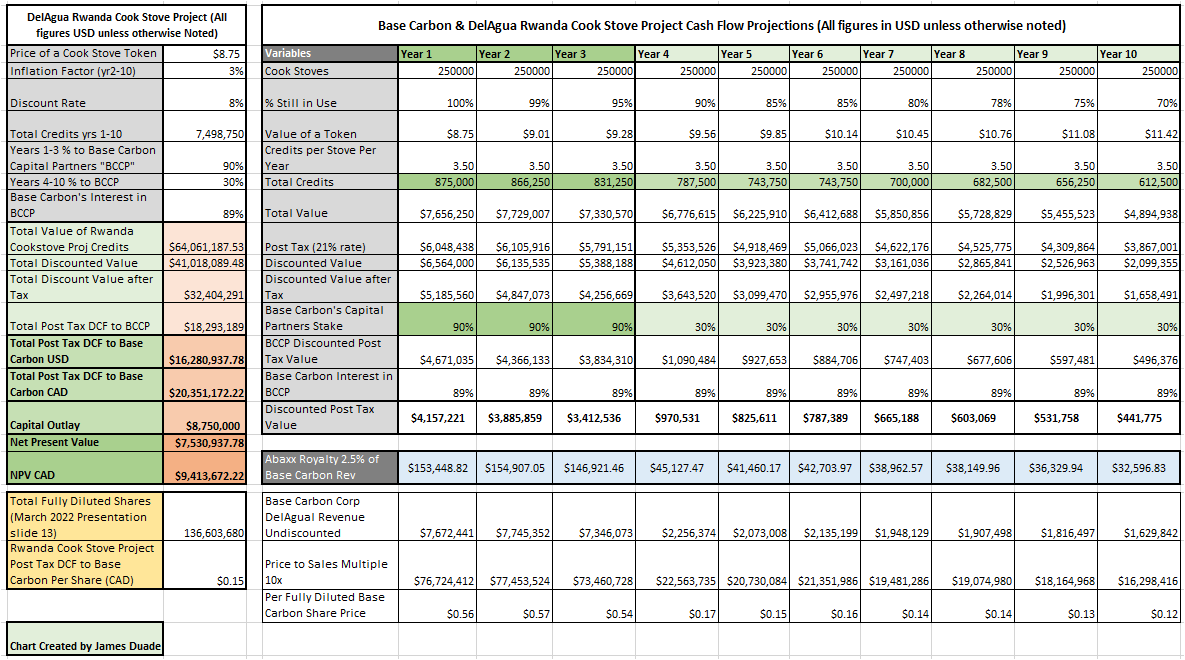
Base Carbon Vietnam Cook Stove Project DCF (Author)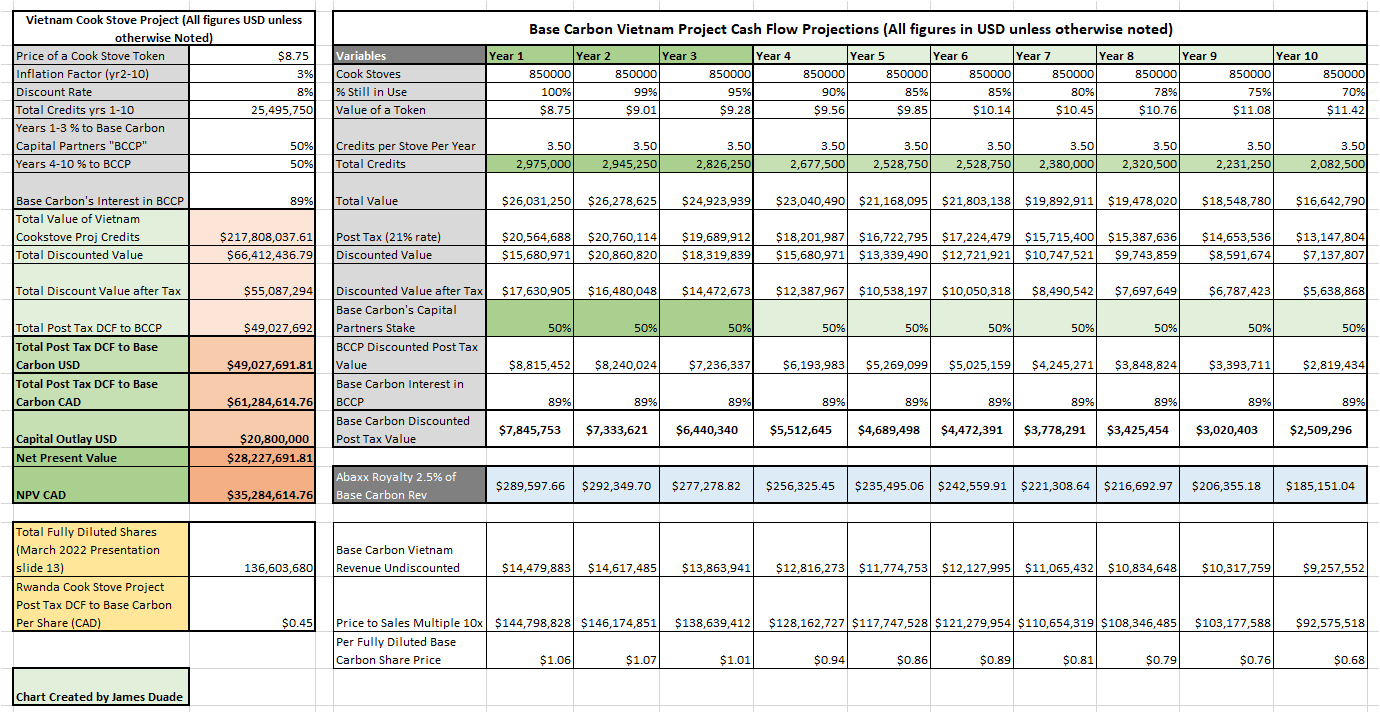
Base Carbon NAV (Author)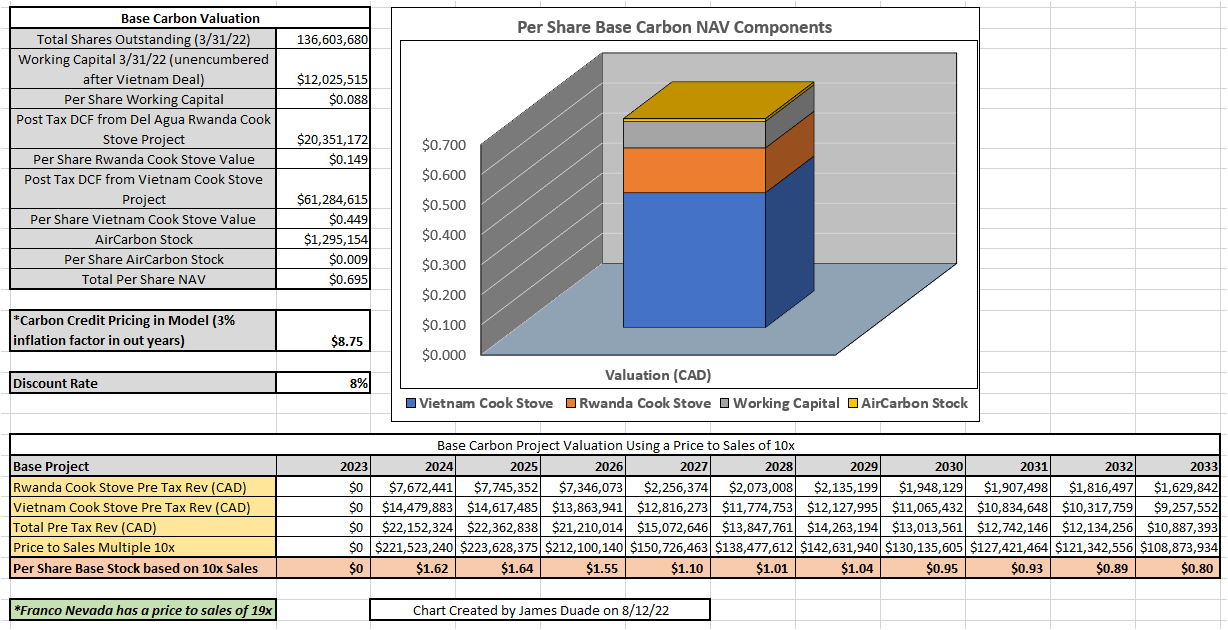
Abaxx Tech Future Royalty Cash Flows (Author)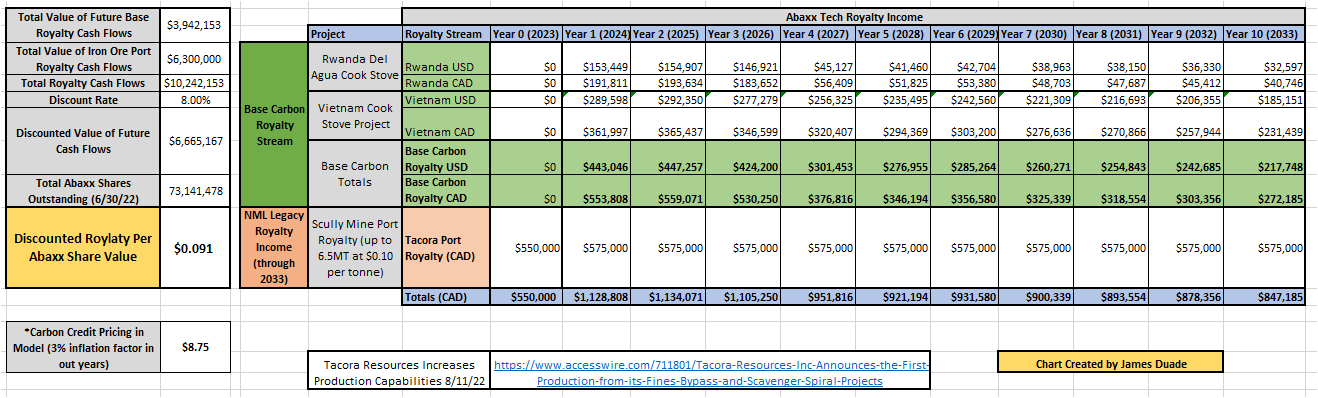
Abaxx will also receive revenues through processing and clearing trades on their 91% owned Abaxx Exchange and Clearinghouse. The rest of the article below is dedicated to reviewing a discounted cash flow analysis on what those revenues may look like in the years ahead. As the reader will see, the DCF indicates that Abaxx Exchange has the potential to launch two benchmark contracts in LNG and Carbon that could be worth billions of dollars each, as well as a contract in the gold market that could potentially take market share from CME (CME).
A note on Calculating Discounted Cash Flow
A discounted cash flow “DCF” analysis attempts to predict future cash flows from a given project, and then due to the time value of money, discounts those future cash flows based on a selected discount rate. The exercise requires that the analyst take a number of assumptions, and then build on said assumptions with additional assumptions. In the author’s opinion it’s critical to understand the assumptions underpinning the model, and the sensitivities of said assumptions. For this reason I’ve provided my detailed DCF Excel file (see Excel section above).
Key Assumptions for Commodity Contracts in the Abaxx DCF Model
In each model presented below, I started off with the key assumption that Abaxx Technologies owns 91% of a future exchange and that the company will have 80,000,000 fully diluted shares. The company currently owns 91% of the exchange, but this could be diluted in the future should Abaxx decide to sell equity in the exchange to a strategic partner. The current share count of Abaxx is 73.2 million, with approximately 79 million fully diluted shares.
It was further assumed that the Abaxx Exchange would have a long term operating margin of 40%. As the reader can see from the below chart, many global exchanges have operating margins in excess of 50%, so a 40% operating margin is fairly conservative.
Global Exchange Operating Margins (Author.)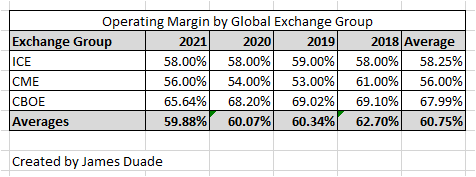
Price to Sales Multiples presented in the article are based off a peer group, including other global commodity and equity exchanges.
Abaxx Exchange Peer Group Multiples (Author)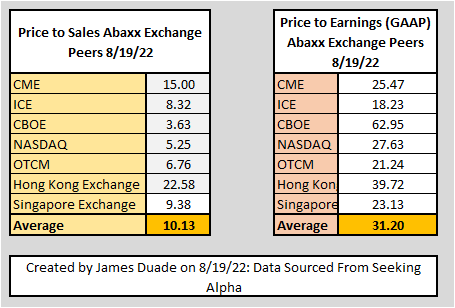
In each commodity contract model presented below I started off by looking at the total physical market for that commodity, then looked for key macro predictions on where the market for that commodity would be by 2030 and 2050 respectively. Next I looked to see how much of the physical market was traded on short term contracts on an exchange vs sold as a long term supply contract. Per assumptions laid out by Abaxx Technologies during their February, 2022 conference call, I assumed that volume of futures contracts is 40x the physical market, secondary contracts were 10x the physical market, and additional options volumes were 5x the physical market. Thus in my view the total market for the commodity contract would be 55 times the underlying physical demand.
Using the above assumptions I looked at what percentage of the contract volume market share Abaxx could reasonably take with the understanding that the company would likely have an “S” shaped growth curve starting off slow, and building over a period of 5-10 years till they matured in the space–similar to the Singapore Exchange’s experience with their iron ore contract (please see appendix for a case study on the Singapore Exchange iron ore contract).
Finally, I looked at key proxy contracts traded on other exchanges to determine what price the Abaxx Exchange may be able to reasonably obtain when their benchmark contracts begin to trade. A 3% inflation factor was added for each year from 2023-2050. Lastly, a discount rate of 10% was applied in order to appropriately discount future cash flows.
A Note on the Inflation Factor for the Contracts
In the author’s opinion an Inflation factor is a reasonable assumption, particularly in this environment of high inflation. Please note that I gave readers the ability to pick the inflation factor of their choosing in the Excel file by using the “contract inflation factor” spin control buttons (see image below, or play with the inflation factor in the file).
Contract Inflation Factor (Author)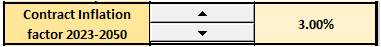
Alternatively, if we look at CME Contracts fee schedule in aggregate from January, 2015 versus August, 2022 the average contract increased approximately 174% in that time. The reader can do the same analysis by doing a VLookup between the two files, calculating the difference between the 2022 and 2015 contracts, then calculate the percentage increase in price of all contracts during that period.
Abaxx’s Benchmark LNG Contract
For a more thorough background on LNG, along with why LNG has no existing benchmark contract, please see my previous Abaxx article purporting an asymmetric risk reward profile.
As was discussed in significant detail in my previous article from last July, Abaxx offers a physically delivered LNG futures contract in the Asia Pacific region, whereas CME has a financially settled instrument called JKM (Japan Korea Marker) that is licensed from Platts. All benchmark energy contracts are physically settled (i.e., Brent, WTI, Henry Hub, etc.) but LNG doesn’t have a physically settled benchmark-that’s what Abaxx can offer. Furthermore, Abaxx’s Exchange is Web3 native, whereas most exchanges such as ICE and CME have just announced that they are moving to the cloud from servers. Abaxx will offer blockchain based trading of its futures contracts, which will separate it from traditional exchanges as well. Some may see this as a gimmick, but as I’ve discussed in other articles, there are numerous use cases for leveraging block chain in commodities trading.
For this article, I started off by looking at the current physical market, which according to the Shell 2022 LNG Outlook was 380 Million Metric Tonnes in 2021, and is expected to grow to 700 million tonnes by 2040!
Shell 2022 LNG Outlook (Shell 2022 LNG Outlook)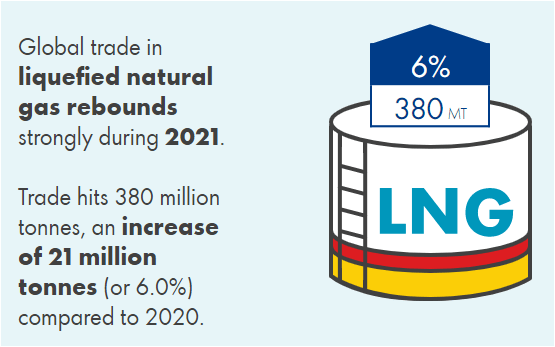
Shell 2022 LNG Outlook, 2040 Demand (Shell 2022 LNG Outlook)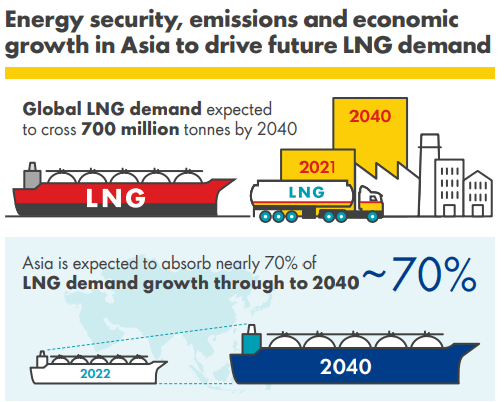
As these figures were reported by Shell prior to the Russian invasion of Ukraine, a geopolitical move that has much of Europe scrambling to secure additional LNG, it’s likely that Shell’s projections for the 2040 LNG physical market are low.
In an April, 2021 webinar Poten & Partners noted that 40% of the physical LNG market is traded on the spot market (i.e., short term contracts), and this figure is likely to increase to 60% by 2030.
In my LNG contract model I assumed that LNG would grow at a 4% CAGR from 2022-2030, and at a 2.5% CAGR from 2030-2050 resulting in a total physical market of 692 million metric tonnes in 2040–just shy of Shell’s 700 MT projection. I assumed no growth in LNG past 2040, meaning that demand would stabilize at 692MT from 2040-2050. I then assumed that the LNG spot market contracts would gradually grow from 40% in 2021 to 60% in 2030. Lastly, I assumed that there were 46.405 mmBtu per tonne of LNG. Using these assumptions the reader can see what the global physical LNG market would look like through 2050–in the below chart blue denotes the total physical market and grey is the percent of market under short term spot contracts.
LNG Physical Market vs Short Term Contracts 2021 – 2050 (Author)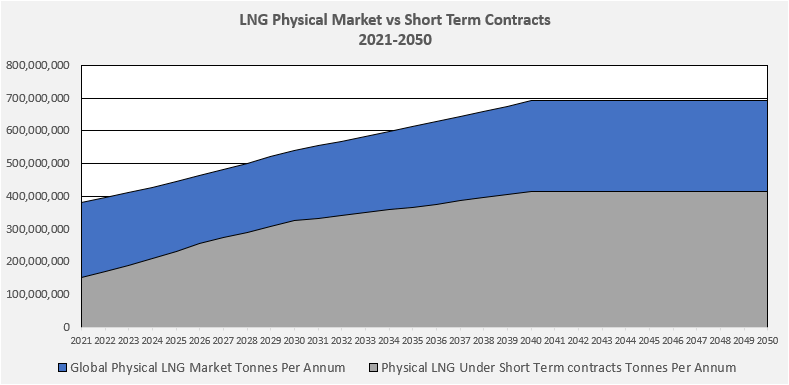
If Abaxx is successful in creating a benchmark LNG contract, I assume that they will have an “S” shaped growth curve where their market share of the physical spot market would grow from 0% in 2022, up to potentially 70% market share by 2030. This type of growth, would result in a total average daily volume “ADV” of approximately 173k contracts traded per day in 2022, growing to an ADV of 424k by 2040–with Abaxx taking 70% of that volume from 2030-2050.
Total ADV LNG Contracts vs Abaxx % of ADV TAM (Author)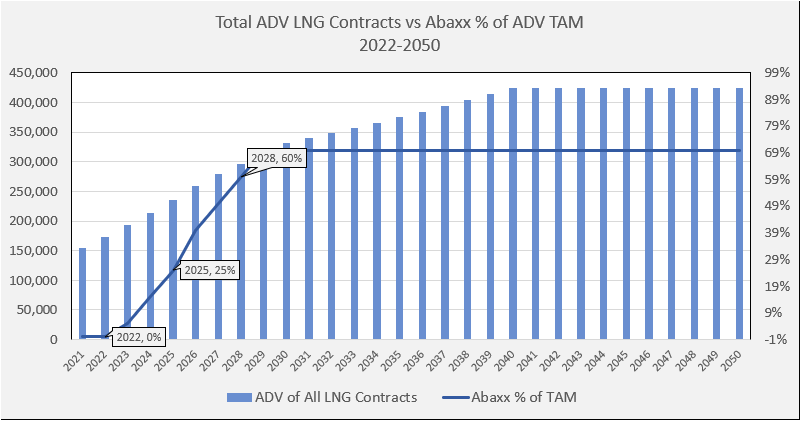
If we assume that each LNG contract traded is for $9.00 ($4.50 for the buy, and $4.50 for the sell), which is lower than CME’s Japan Korea Marker “JKM” product at $10 ($5 buy / $5 sell) for exchange members and $14 for non-members, than we can project out revenues based on the above ADV model.
CME Fee Schedule (CME Fee Schedule)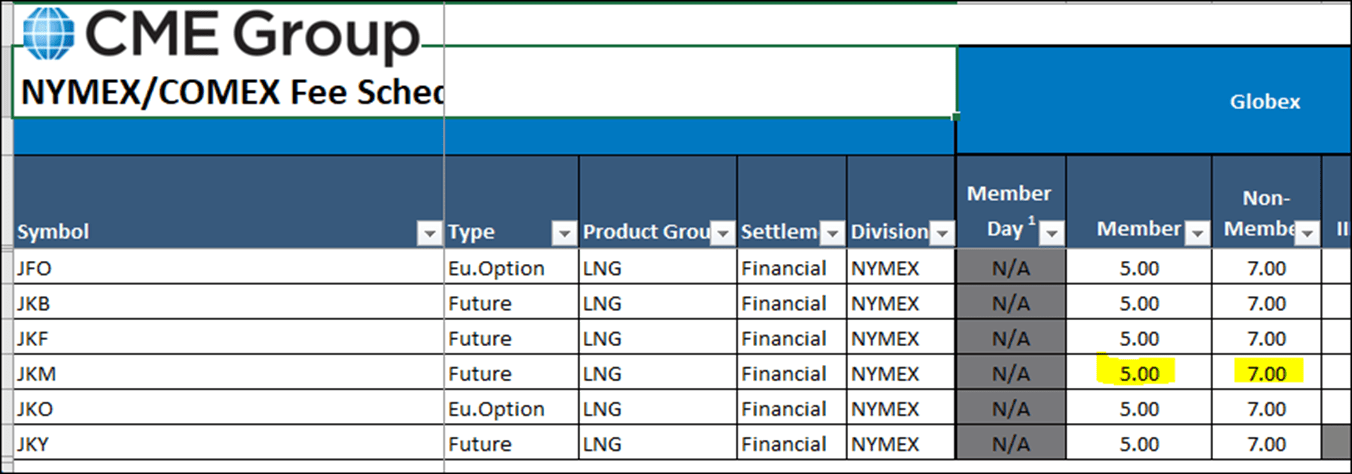
Below the reader can see what the discounted vs undiscounted cash flow to Abaxx Exchange would look like if the above model is correct. Please note that below, I’m assuming a conservative 40% profit margin for Abaxx.
Annual LNG Contract Value Discounted vs. Undiscounted 2022-2050 (Author)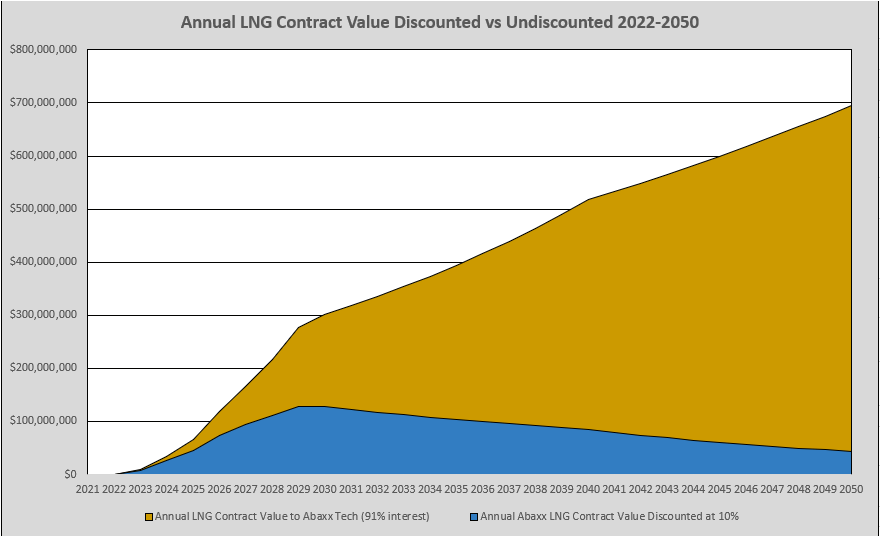
Using the average price to sales for Abaxx’s peer group we see what the LNG contract could mean for Abaxx’s share price in future years if the assumptions in the model hold.
Abaxx Stock Price Based on LNG Contract Sales & Industry Price to Sales Multiple 2022-2050 (Author)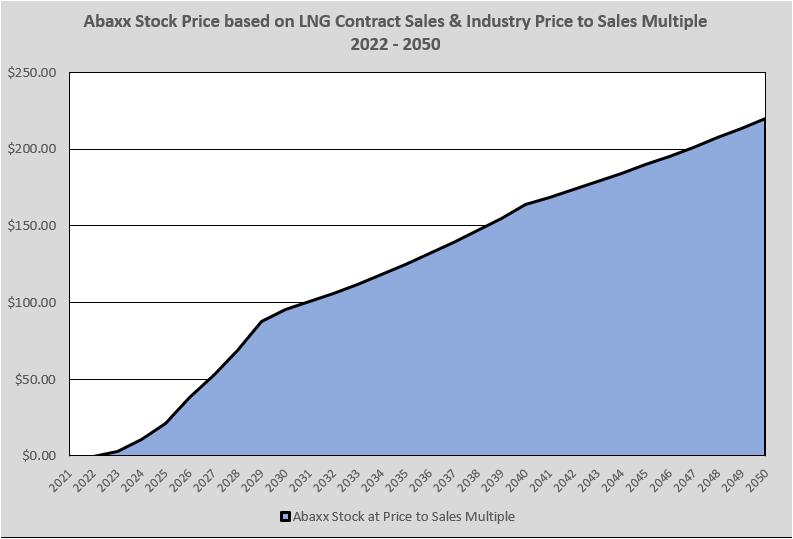
Bringing it all together the reader can see that the present value of future cash flows for the LNG contract alone is $2.24 Billion CAD, or $28.00 CAD per fully diluted Abaxx share.
Abaxx LNG Contract DCF Model (Author)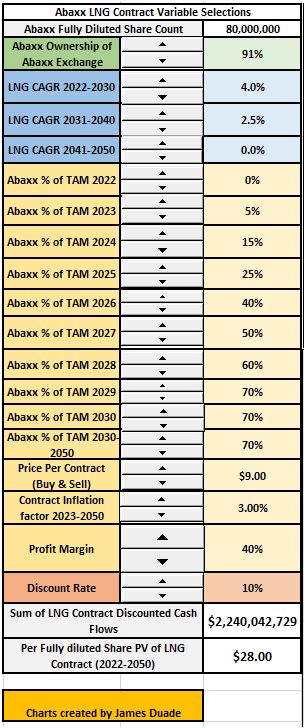
Abaxx’s Benchmark Voluntary Carbon Market Contract
Not only is Abaxx moving forward with launching a benchmark LNG contract, they are also moving forward with launching a voluntary carbon credit contract as well. Readers can refer to my previous article titled Abaxx: Poised to Become a Key Player in the Rapidly Growing Voluntary Carbon Markets for additional background on carbon credits, voluntary carbon markets, and why Abaxx is poised to disrupt this industry.
As a brief refresher, McKinsey published a recent white paper discussing why voluntary carbon markets “VCMs” could grow from a physical market of 100 million tonnes per year in 2020, to 2.0 billion tonnes per year by 2030, and up to 13.0 billion metric tonnes per year by 2050 (see chart below).
McKinsey Global Voluntary Carbon Credit Market (Author)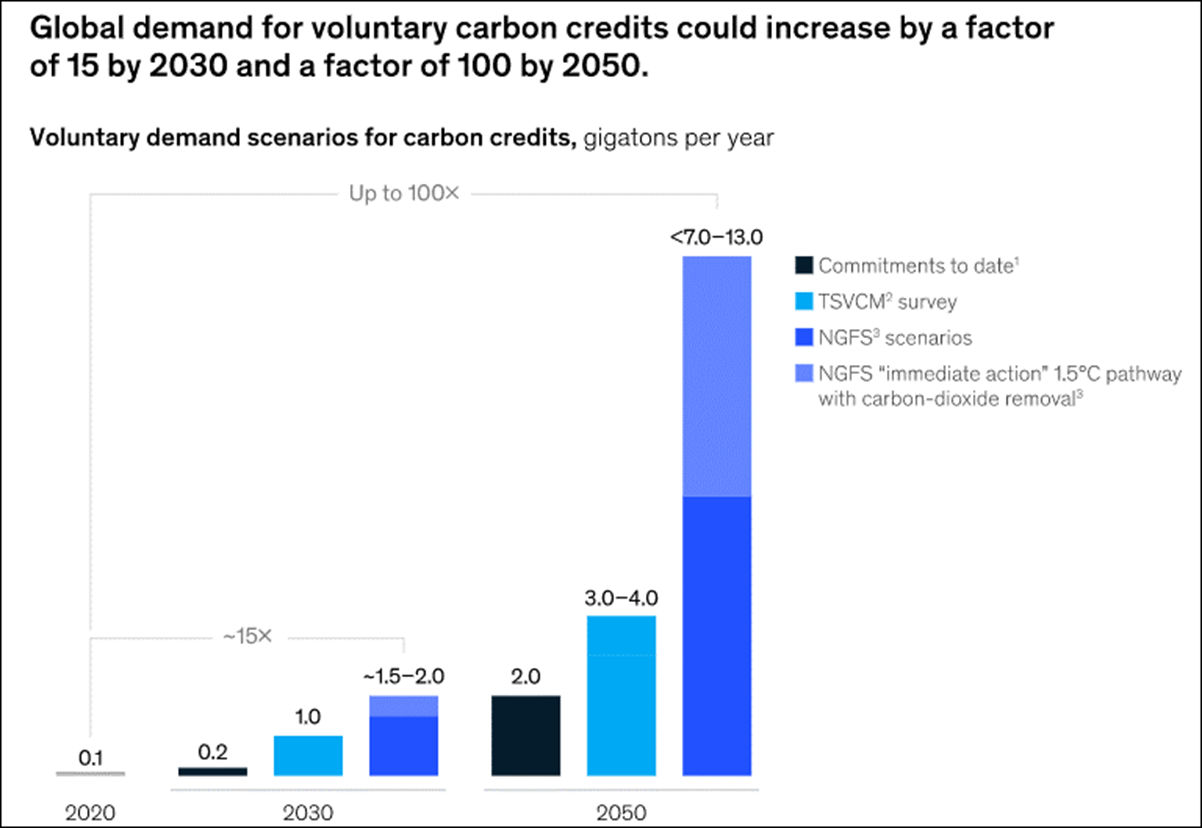
While these numbers are so large it may be hard to comprehend, it’s actually not that unreasonable when you consider the fact that the Oil Super Majors–many of whom have made net zero commitments by 2050–emit nearly 6 billion tonnes of CO2 every year when adding in scope 1, 2, and 3 emissions.
Oil Super Majors Scope 1, 2, and 3 Annual Emissions (Author)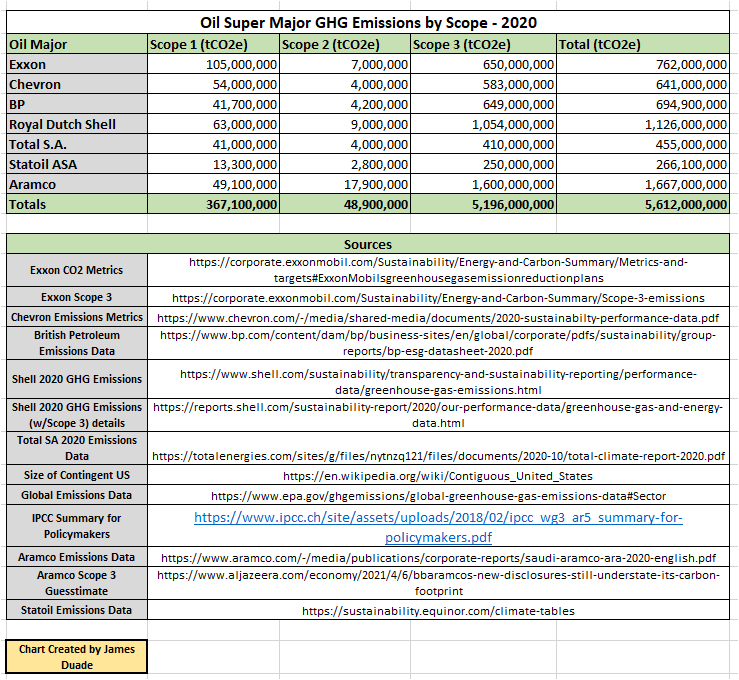
Furthermore, the International Energy Agency reported that total global energy-related C02 emissions in 2021 were 36.3 Billion tonnes!
IEA 2021 Global CO2 Emissions Report (IEA 2021 Global CO2 Emissions Report)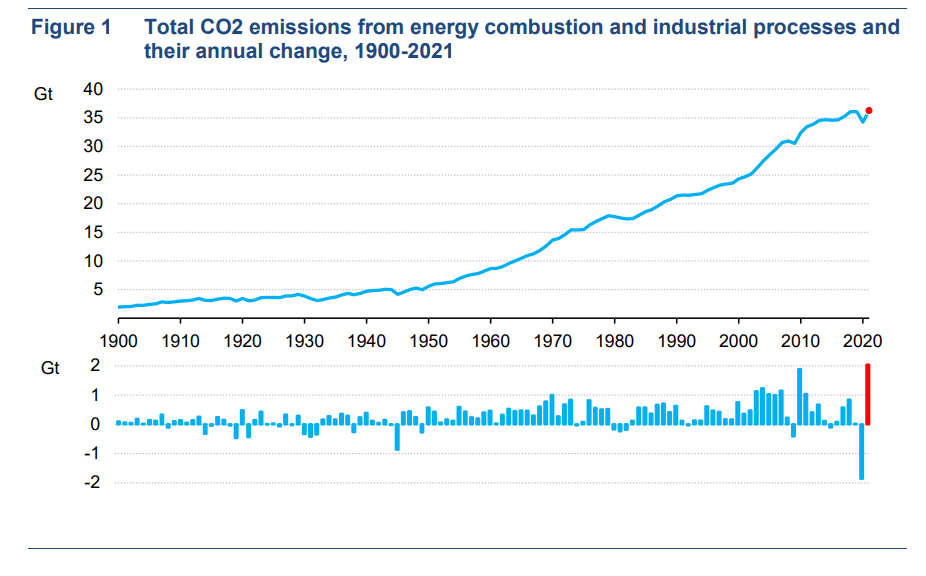
Additionally, per the IEA’s Net Zero by 2050 Roadmap Report carbon emitting sources of energy such as coal, oil, and natural gas will continue to play a vital mix through 2050 for areas such as the Asia Pacific region. Not to put too fine a point on it, but the only way to achieve net zero for these sources of energy would be to offset their emissions with voluntary carbon credits.
IEA Net Zero by 2050 Report (IEA Net Zero by 2050 Report)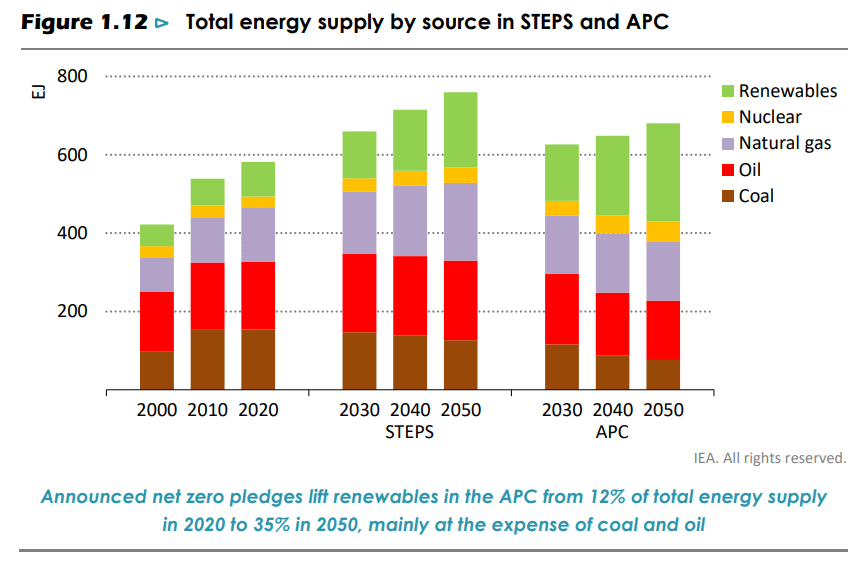
For this reason, many large greenhouse gas emitters such as the oil super majors and other large international miners, are investing heavily in carbon credits. As an example, the world’s largest producer of oil, Saudi Aramco, indicated that they will start buying 16 million carbon credits a year, and will be joining the Saudi Carbon Trading Exchange later this year.
As a reminder, discussed more in my previous Abaxx article, Abaxx will be offering carbon neutral cargoes for LNG and other commodities sold on their platform. For instance, a buyer can purchase LNG from the United States heading to Japan, determine how many tonnes of carbon the voyage will emit, and then purchase a contract to offset the trip. This would allow the buyer of the LNG contract to claim that the scope 2 emissions on the purchase were carbon neutral.
Abaxx Carbon Contract DCF Analysis
In my VCM model I assumed that VCMs grew with a CAGR of 17.5% between 2022-2030, followed by a CAGR of 13.0% from 2031-2040, and a CAGR of 7.0% from 2041-2050. These figures resulted in a physical VCM of 1.5 billion tonnes by 2030, and a physical market of 10.0 billion tonnes by 2050–figures that were at the low end of the range in the McKinsey Report.
VCM Annual Physical Volumes and Potential ADV of VCM Contracts (Author)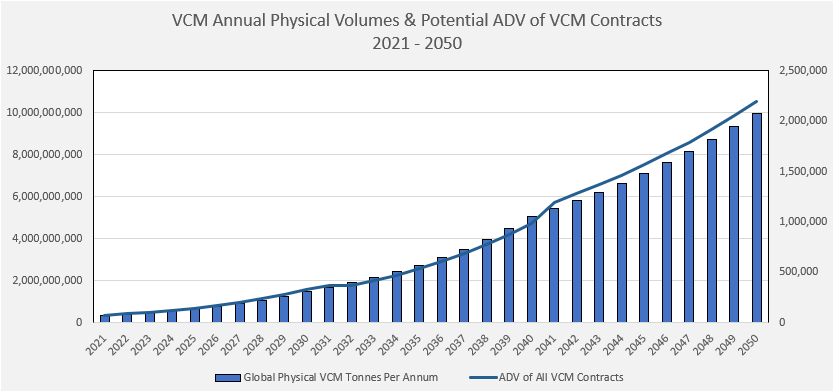
Given the huge growth profile in VCMs over the next three decades, average daily carbon contract volumes start off low, around 90k contracts per day in 2022, and increase substantially over time with over 2 million contracts traded per day in 2050. In my model I assumed that Abaxx captures 15% of the market share by 2024 and up to 35% by 2030. Abaxx then remains at that market share for the rest of the model, with revenues increasing as the ADV grows with time.
VCM Average Daily Volume vs Abaxx Market Share 2022 – 2050 (Author)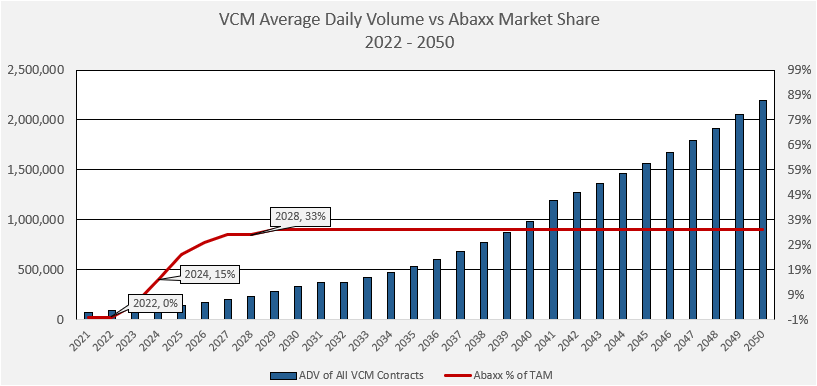
The average price per contract in the model was set at $8.00 ($4.00 buy / $4.00 sell), which would be $2.00 less expensive than the current product offered by the CME group set at $10 ($5 buy / $5 sell).
CME Fee Schedule – Carbon Credits (CME Fee Schedule)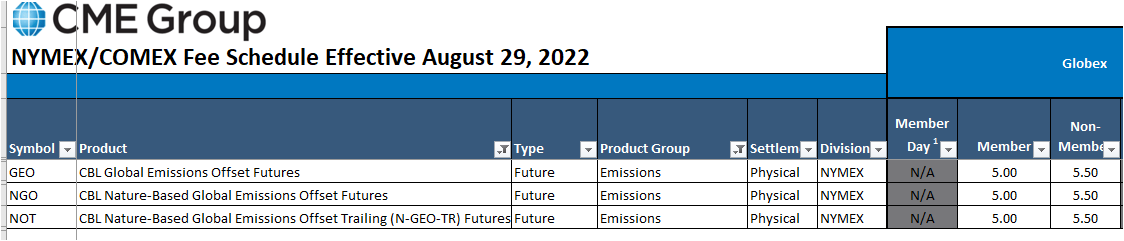
Below the reader can see what the discounted vs undiscounted cash flow to Abaxx Exchange would look like for the carbon contract if the above model is correct. Please note that below, as with the LNG contract, I’m assuming a conservative 40% profit margin for Abaxx.
Discounted vs Undiscounted Cash Flow of Abaxx Carbon Contract 2022-2050 (Author)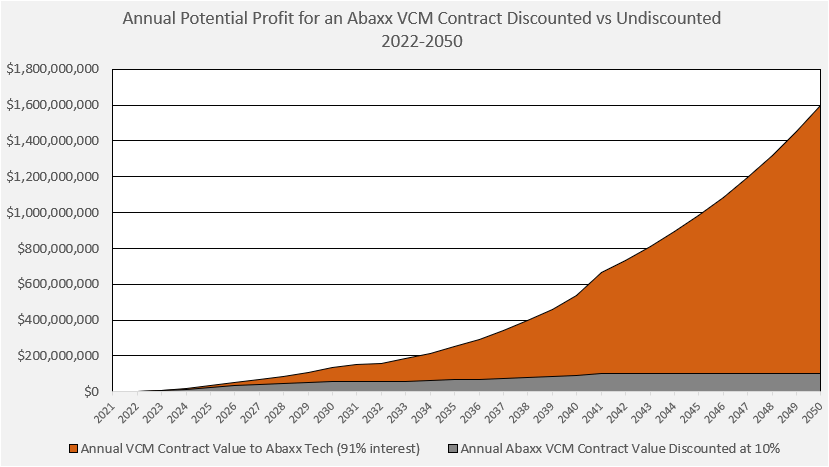
Using the average price to sales for Abaxx’s peer group we see what the carbon contract could mean for Abaxx’s share price in future years if the assumptions in the model hold.
Abaxx potential stock value at price to sales multiple for carbon contract (Author)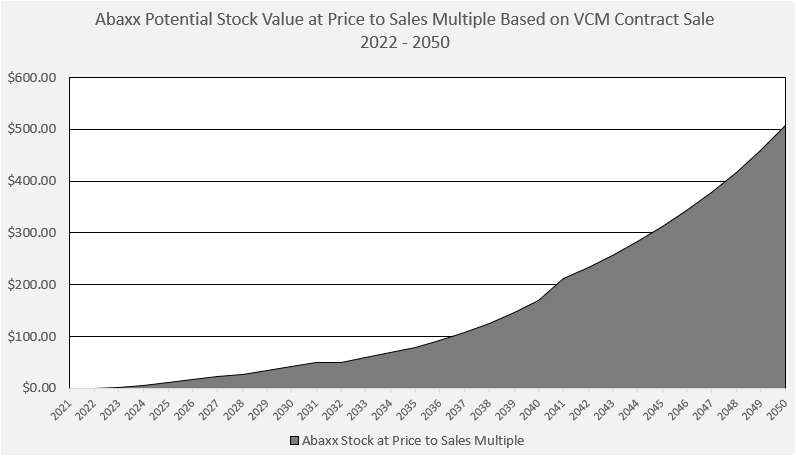
All told, my estimate of the present value of future cash flows for the carbon contract alone is $1.96 Billion CAD, or $24.51 CAD per fully diluted Abaxx share.
Abaxx Carbon Contract DCF Assumptions (Author)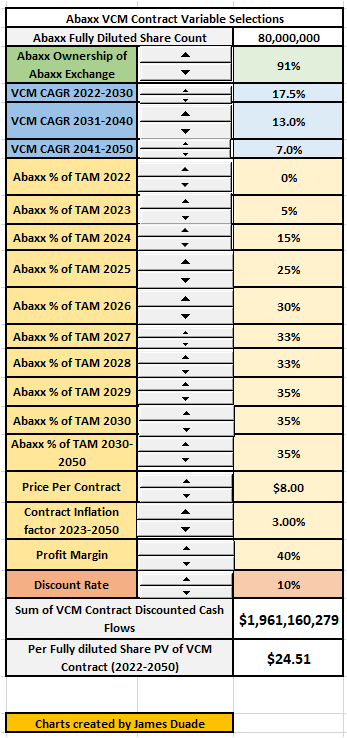
Abaxx Exchange Gold Contract
In previous presentations, Abaxx has indicated that in addition to an LNG and carbon contract they feel like they can also offer a ground breaking gold contract that can steal market share away from CME’s near monopoly on gold futures.
As I will show in the below section, I think the probability that Abaxx will disrupt the gold market is relatively low due to the fact that the market is mature, dominated mostly by CME, and also because the cost per CME contract is set low to discourage additional participants such as Abaxx stealing market share. As such, I’ve indicated in my model that Abaxx may only take up to 10% market share for this competitive contract by 2027.
Abaxx Exchange Gold Contract Assumptions (Abaxx Presentation)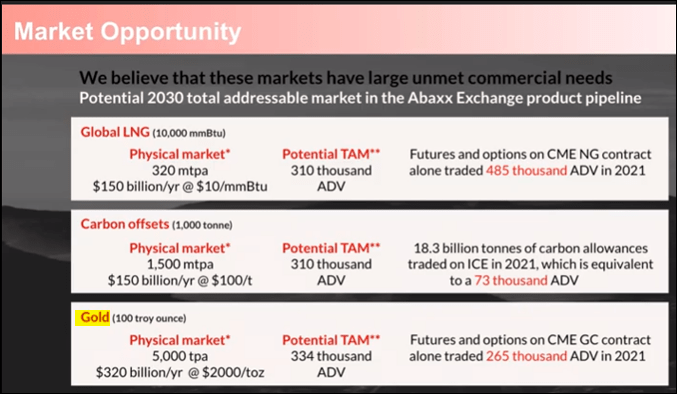
Abaxx Exchange Gold Contract Assumptions (Abaxx Exchange)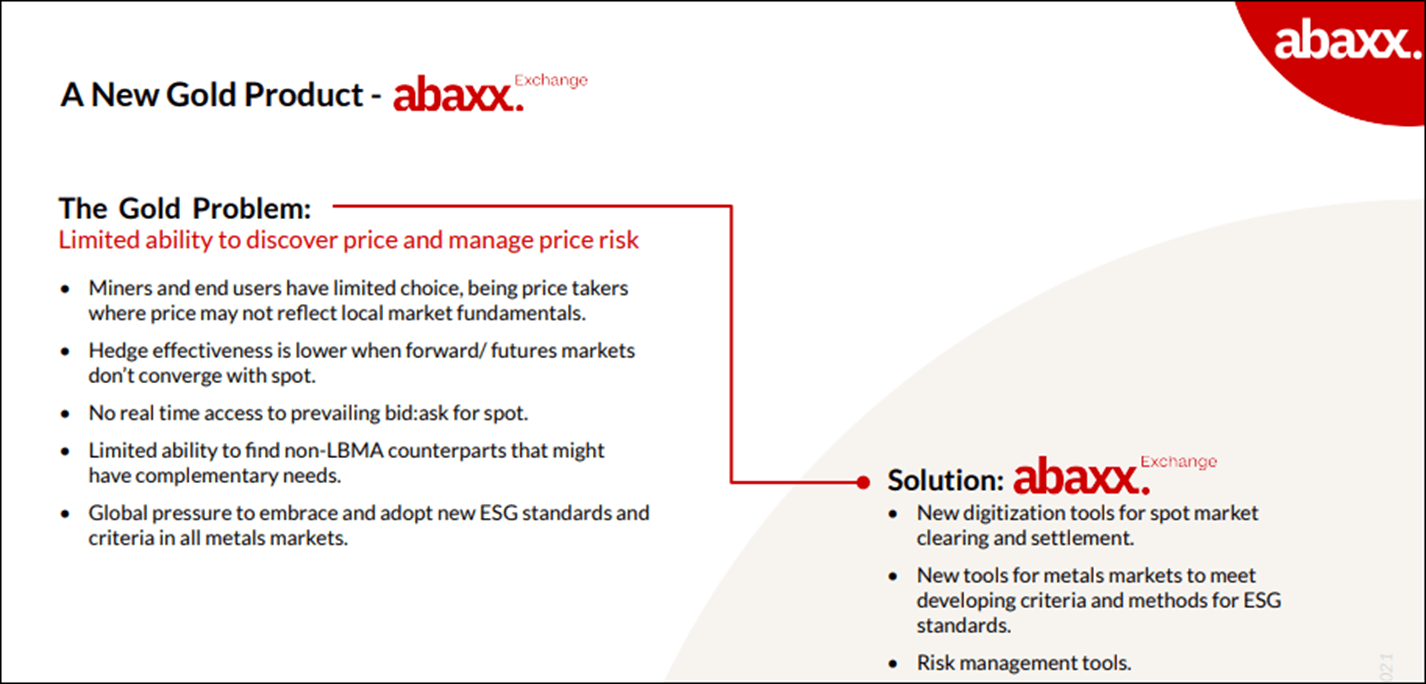
The physical gold market is approximately 4,600 tonnes per year, or 164.5 million ounces. Over the last 10 years the market has grown at about a 1.4% CAGR, with some years up and others down.
Physical Gold Market 2010 – 2021 (Author)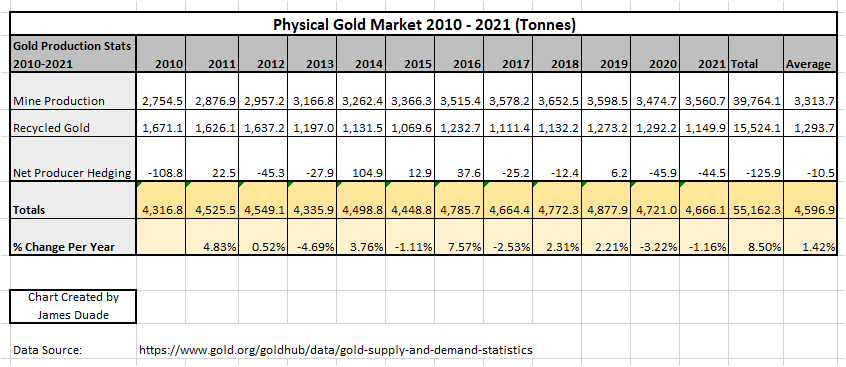
Given that the market is a very mature market, I predicted in my model that the physical gold market would grow at a 0.7% CAGR from 2022 – 2030, and a 0.3% CAGR from 2031-2040, with no growth in the decade from 2040-2050.
Physical Gold Market & Projected ADV Contract Volumes 2021 – 2050 (Author)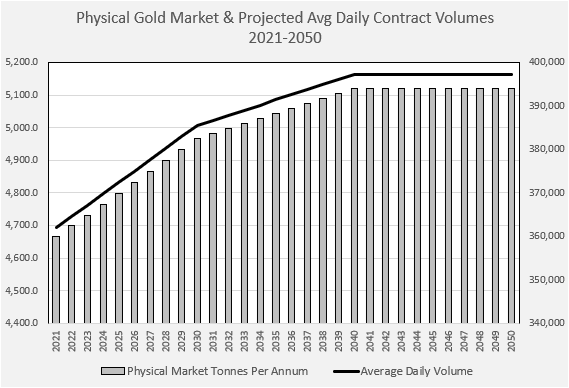
The average daily volume for gold contracts in the above model predicts approximately 360k contracts per day in 2022, with the ADV rising modestly to just over 390k by 2040. Of note is the fact that CME reported average daily volumes on their gold contract of 330k in 2021 (see below image), meaning that they own around 80-90% of the gold contract volume currently.
2021 CME 10-K Gold Contract Volumes (CME SEC Filing)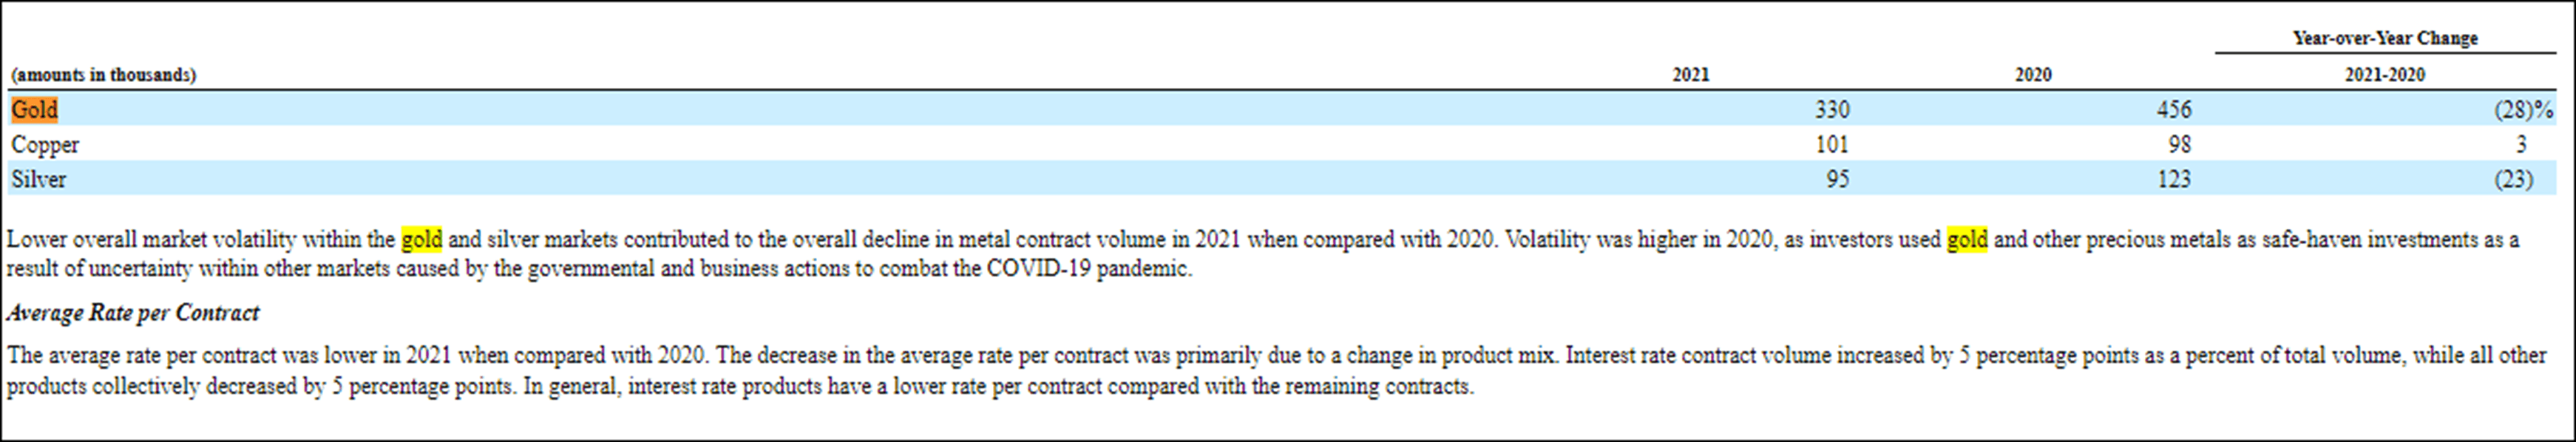
My model predicts that Abaxx will have a difficult time gaining market share with a gold contract due to the dominance by CME, so I predict a modest rise in ownership of the gold contract TAM from .5% in 2023, and eventually rising to 10% market share by 2027.
Abaxx Gold Contract % of TAM vs Total Gold Contract Volumes 2022 – 2050 (Author)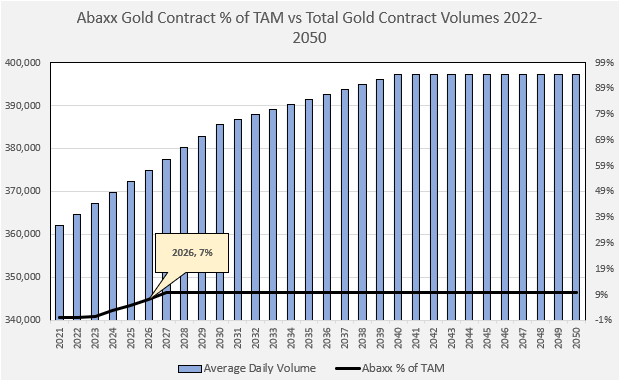
Because of CME’s dominance in the gold market, they’ve set a very low price per contract in order to discourage additional market participants. Most CME gold products such as options and futures trade for $1.40 for exchange members ($0.70 buy / $0.70 sell) and $3.00 for non-members.
CME Fee Schedule – Gold Pricing (CME Fee Schedule)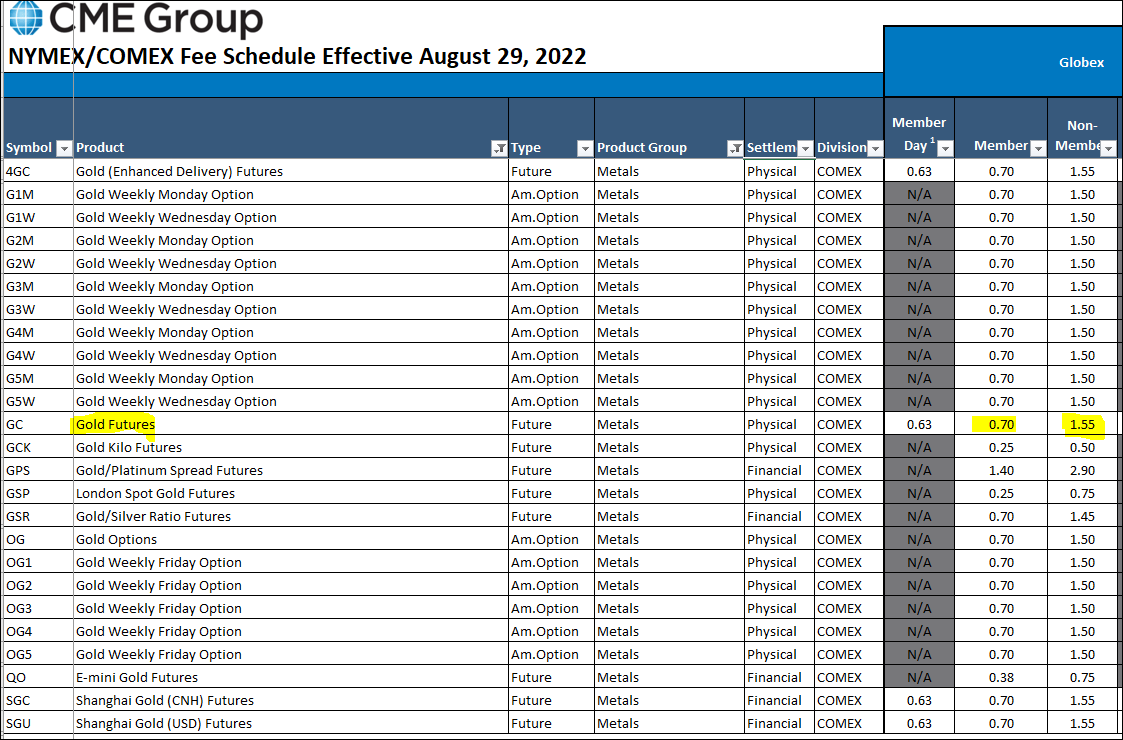
In the gold contract model, I used a price per contract of $1.40 ($0.70 buy / $0.70 sell). Below the reader can see what the discounted versus undiscounted cash flow would look like to Abaxx Exchange for the gold contract. Again, a conservative 40% profit margin was used.
Abaxx Potential Gold Contract Revenues 2022 – 2050 Discounted vs Undiscounted (Author)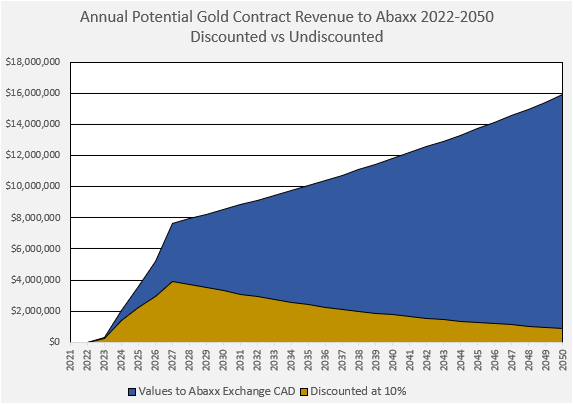
Using the average price to sales for Abaxx’s peer group we see what the Gold contract could mean for Abaxx’s share price in future years if the assumptions in the model hold.
Value of Gold Contract vs Abaxx Stock Price using Industry Price to Sales Multiple (Author)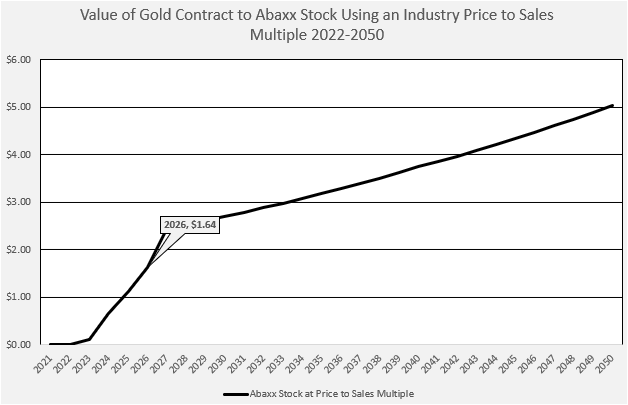
Lastly, the present value of future cash flows for the gold contract alone is $57.5 million CAD, or $0.72 CAD per fully diluted Abaxx share.
Abaxx Gold Contract DCF Assumptions (Author)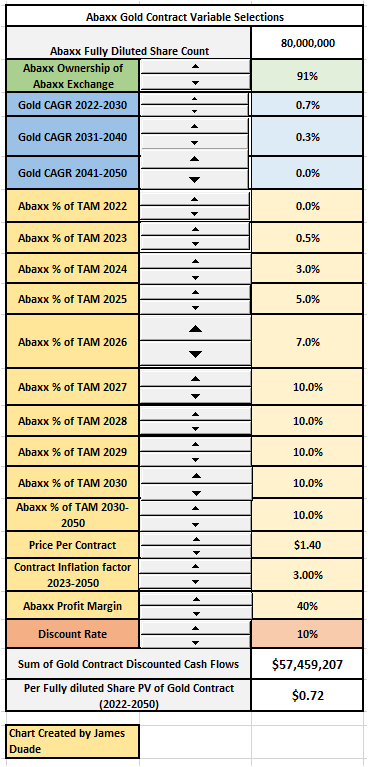
Net Asset Value of Abaxx Contract DCF Model
Taking the three contracts together, the reader will see that the combined DCF model is worth $53.23 per fully diluted share to Abaxx shareholders–as noted above the model applied a 10% discount rate and 40% operating margin for each contract. Using revenues attributable to each contract, a price to sales model–using the price to sales peer group average of 10.13–predicts that Abaxx could rise to $4.90 in 2023, $33.57 by 2025, and possibly $139.91 by 2030 as revenues continue to ramp up on the exchange. Given the current share price of $2.18 CAD (Abaxx price at market close on 9/2/22), the DCF illustrates the enormous potential for Abaxx should they be successful in launching their benchmark contracts in LNG and carbon, and to a lesser extent gold.
Abaxx Exchange Contract TAM DCF (Author)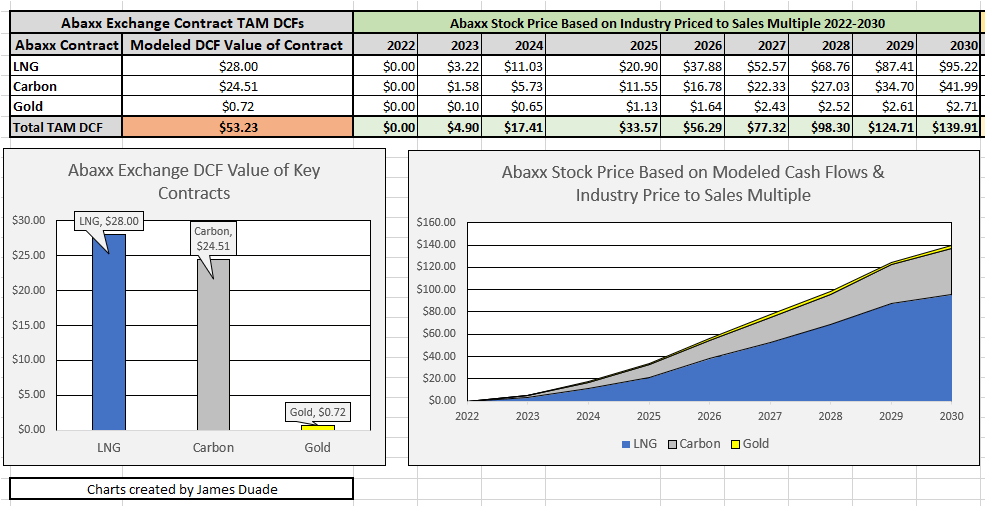
Potential for Other Contracts
With both an approved exchange and clearinghouse the Abaxx Exchange and their strategic partners will have the potential to create contracts in response to customer demand. Thus creating new cash flow opportunities above and beyond the contracts discussed above. One such opportunity presented itself this past March with the LME nickel crisis which resulted in the LME cancelling nickel trades and infuriating traders who lost out on millions had the LME allowed the trades to process. As this Financial Times article noted in March:
Many executives said they would look at alternatives to the London benchmark for nickel to trade… One intriguing answer floated at Boca Raton would be to consider futures based on blockchain technology. A smart contract could authenticate the quality and track shipment of the metal. Crucially, advocates say, it monitors customers’ market positions in real time.
In Abaxx’s August 16th investor update, they noted the following:
In addition to the core LNG and Carbon products, we are working on contract designs for our first battery metal benchmark contracts, which were initiated by a leading global metals and mining firm seeking better commercial risk management tools in light of ongoing dislocations in traditional metal futures markets.
Abaxx was likely implying that they may create a nickel and copper contract to compete with the LME’s benchmark nickel and copper contracts. Should they be successful, Abaxx could draw significant market share from the LME, which has annual volumes of around 145 million trades, predominantly in five commodity groups: Aluminum, Copper, Zinc, Nickel, and Lead (see below chart). Doing so could add additional lucrative revenue streams for Abaxx, as the LME was a multi-billion dollar exchange in its own right, being bought in 2012 for $2.15 Billion USD by the Hong Kong Exchange.
LME 2021 Annual Contract Volumes (Author)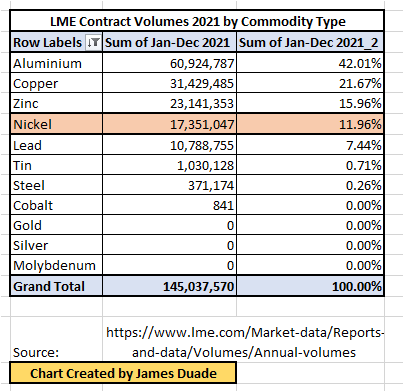
The above just goes to show that once Abaxx launches their exchange and clearinghouse, they’ll have a number of options to generate substantial trading and clearing revenues.
Under What Scenarios Could This Investment Thesis Be Wrong
All investments have risks of course, the risk with Abaxx is that they suffer additional unexpected delays to the launch of their exchange and thus erode their working capital further, potentially forcing shareholder dilution. Additionally, the company’s technology is new to exchange participants, and may have unforeseen bugs or run into challenges with implementations. Effectively any exogenous event that extends the launch of their exchange could create dilution risk and impair the investment thesis. As discussed in the article however, the fact that the company is now actively onboarding their core group of FCMs and implementing and testing their software means that the probability for a successful launch has increased substantially from when investors sold off in March and April.
Another potential scenario is that Abaxx Exchange launches and open interest in their LNG, Carbon, and Gold contracts is poor. If this were to happen then the company would have to drain their working capital further, and potentially raise additional funds through an equity or debt offering. While this scenario is possible, Abaxx noted in their most recent investor call held on August, 25th 2022 that the company is “in regular discussion with some of the largest energy and metals and mining companies globally” (Josh Crumb, minute 42:05 in YouTube clip). For this reason, I assume that Abaxx will likely create open interest in these contracts by bringing large physical commodity producers to their exchange.
What If The Bear Case Comes True?
As mentioned in the previous section, the biggest risk to the investment thesis listed above is that Abaxx runs into unforeseen delays with either their exchange or technology application launches, and at the same time is unable to find strategic partners for their exchange. This scenario would create a strain on the company’s working capital, and potentially force them to raise cash by either selling non-core assets, or by diluting existing shareholders via an equity raise.
As of June, 30th, 2022 Abaxx had working capital of $16.1 million Canadian, comprised of mostly cash and gold–the gold investment is characterized as “short term investments”–in the below table from SEDAR.
Abaxx 2022 Q2 Working Capital (SEDAR)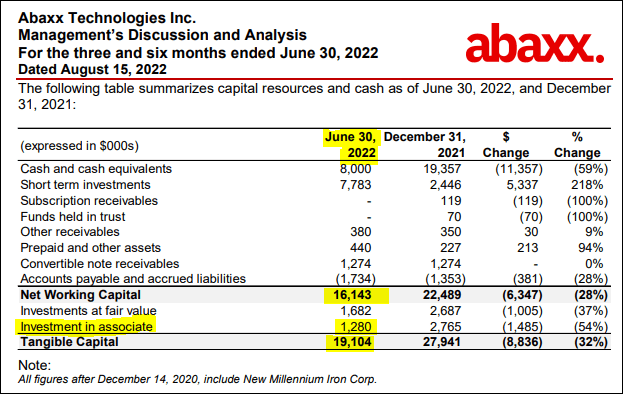
Of note is the fact that the “investment in associate” line above is 19,339,593 shares of Base Carbon, which is characterized using the equity accounting method and not marked to market. Since Base Carbon is trading at $0.54 CAD per share (closing price on Friday, September 2nd), that means that Abaxx’s position has a market value of $10.443 million CAD. Adding this to the working capital of $16.143 million listed above, gives Abaxx a true working capital position of approximately $26.586 million CAD. Since Abaxx has an operational burn rate of approximately $1.5 million CAD per month (see operating expenses from 2022 Q2 SEDAR filing below), that means that they have sufficient working capital to operate for approximately 18 months before they would have to raise additional cash from the market.
Abaxx Tech 2022 Q2 Operating Expenses (SEDAR)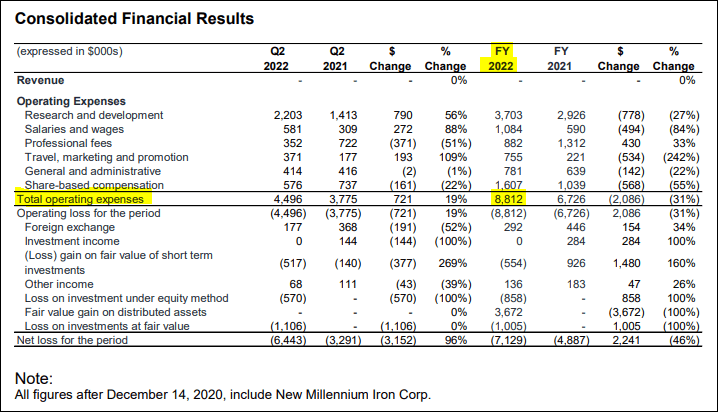
Keep in mind that Abaxx owns the legacy NML iron ore assets as well, which could be sold if necessary, and currently are reflected as $0.00 on the balance sheet despite having significant long term potential.
While further delays to either the Abaxx Exchange or Technology launch would be painful for investors, Abaxx does have a number of paths to raise capital by selling non-core assets and stave off dilution. Given the optionality around selling these non-core assets, such as Base Carbon shares or legacy iron ore assets, in the author’s opinion Abaxx still has asymmetric upside potential for those willing to hold until the Abaxx Exchange is launched and monetized.
If Abaxx continues to suffer further delays with their exchange and technology application launches, then I think it would be prudent for investors to re-evaluate the bull case for the stock. For this reason, I will be keeping a close eye on the company’s milestone progression every quarter, and dispassionately evaluating their SOTP and DCF potential.
Conclusion
This article aimed to show readers the potential cash flow generating possibilities for Abaxx once the company launches their Singapore based exchange and clearinghouse. As the reader saw in the discounted cash flow sections of this article, Abaxx has an opportunity to launch two benchmark contracts in LNG and Carbon. Further opportunities may come in the battery metals space, particularly in the wake of the LME Nickel crisis. As the revised Sum Of the Parts analysis illustrated, the downside risk is supported by the company’s substantial assets, including the exchange and clearing infrastructure which is likely worth over $200 million USD–more than twice the current US market cap of Abaxx at $92.4 million (value as of market close on Friday, August 19th). Lastly, the company’s robust balance sheet and non-core assets give Abaxx ample optionality to raise capital without further diluting shareholders before the company monetizes their exchange.
Following the company’s announcement on August, 16th that FCMs are onboarding and the company is planning for its exchange launch in Q1 of 2023, it appears that the company should be reevaluated from a value play, to a tremendous growth opportunity by the market. In the author’s opinion Abaxx still presents a very attractive asymmetric risk reward proposition for investors, particularly given the potential for near term catalysts should the exchange launch occur in Q1 of 2023.
APPENDIX
Case Study: Singapore Exchange Iron Ore Benchmark Contract
After reading the above article, I think it’s instructive for readers to look at a case study of the last major exchange to launch a physically settled benchmark contract–Singapore Exchange–to show how quickly market share can grow when industry participants gravitate towards the contract with the most liquidity thus creating a winner take most contract.
In the early 2000’s the emergence of China and other BRIC’s led to a resurgence in interest in physical iron ore markets. As a result, import markets in China exploded from 65 million tonnes in 2000 to 630 million Tonnes by 2009. The heavy demand in global iron ore was primarily driven by the fact that China’s ample iron ore reserves were of low quality forcing Chinese steel producers to source their iron ore from the seaborne market. Iron ore along with coking coal, also known as metallurgical coal, are the key raw ingredients in steel making.
Dating back over 100 years iron ore had always been traded on an annual contract basis. The dominant players such as Rio, Vale, and BHP–producing nearly 70% of the world’s export market–would negotiate with the world’s largest steel makers to find an annual price. All other prices were generally a derivative of that annual benchmark. I discussed this in greater detail in a 2011 Seeking Alpha article which you can read here.
The rapid rise in Chinese steel production though resulted in a fractured steel market where no dominant player existed. This created a dynamic where the world’s largest producers of iron ore could dictate that they wished to move from annual contracts to quarterly contracts, and eventually spot pricing. As the world’s last bulk commodity to not have a robust spot market, an enormous opportunity existed for an exchange to create a suite of products that could help form a benchmark contract for iron ore.
In April, of 2009 the Singapore Exchange launched the world’s first iron ore contract–an OTC swaps contract on their SGX AsiaClear platform. In their 2009 annual report SGX noted that they had begun to clear the iron ore contracts with their network of counterparties and clearing partners (see pg 84 of 180). Interestingly enough, iron ore swaps, were the 26th contract launched by SGX. By their 2011 annual report SGX had begun to see some traction with their swaps product, clearing 44,781 contracts that year, an 86% increase from the 24,133 contracts cleared in 2010 (see pg. 95 of 204). In 2012 the swaps contracts grew by another 177% (image below).
Singapore Exchange FY2012 Annual Report (Singapore Exchange Annual Reports)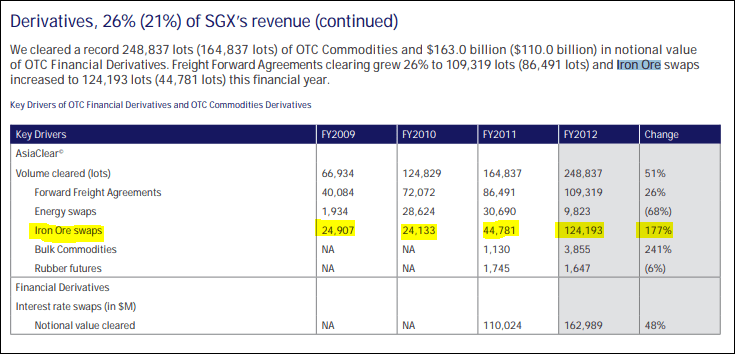
With the growing success of the iron ore swaps contract, Singapore Exchange launched a physically delivered iron ore futures contract in 2013. That year SGX promoted and developed the futures contract by hosting a Singapore Iron Ore Week conference with over 500 delegates in attendance. In 2013 SGX also began working with the China Beijing International Mining Exchange and the China Financial Futures Exchange on the development of the iron ore futures and derivative products respectively (pg. 18 of 164 in 2013 annual report). Also of note is the fact that SGX indicated that they had reached 90% of global exchange-cleared volumes in iron ore swaps contract by 2013 (pg. 34 of 164, SGX 2013 Annual Report).
In 2014 SGX expanded into other products within the iron ore vertical based on customer feedback and demand, launching a hot-rolled coil steel futures and hot-rolled coil steel swaps products (pg. 10 of 164 SGX FY2014 annual report). SGX also reported that their swaps volume had grown to over 1.2 million contracts accounting for over 30% of the underlying global physical market. In 2015 contract volumes exploded again, jumping to 4.8 million. In 2016 iron ore volumes increased yet again, and SGX introduced a lump premium product to the iron ore suite (pg. 11 of 164).
By 2017 SGX reported that they had captured over 90% of the global iron ore derivatives market (pg. 13 of 172 2017 SGX annual report). Furthermore SGX had branched even further into the iron ore vertical with coking coal futures, that they noted had increased over eight-fold that year. Taken together, the coking coal, iron ore futures products (both being the key raw inputs for steel) created a “virtual steel mill” for SGX clients in the steel industry and cemented SGXs role as the dominant force in hedging upstream input risk for steel producers. Additionally, their hot-rolled coil futures product, provided further hedging risk for downstream sales. The vertical of products provide a one-stop shop for Asian steel producers and consumers to hedge their risk and speculate on future price movements within the industry. This is why in their 2018 annual report Singapore Exchange said the following about their market share in iron ore and coking coal:
On the commodities front, we continued to extend our value proposition of offering capital efficiencies across all components of the steel value chain – iron ore, coking coal and freight. Against record volumes cleared for our coking coal futures, we launched coking coal options in September 2017, another important step in building out our steel franchise. With close to 100% international market share in iron ore and coking coal, as well as 50% market share for dry-bulk forward freight agreements (FFAs).
In 2019 and 2020 SGX added additional products to their iron ore vertical with a high quality iron ore (65% Fe) benchmark that traded over 65 million metric tonnes of derivatives in 2020 (pg. 16 of 240 SGX 2020 FY report). The company also noted how the product became financialized, noting in 2019 that over 25% of SGX’s 1.7 billion metric tonnes of iron ore derivatives volumes was from buy-side institutions and funds.
Below the reader can see my accumulated notes from combing through 10 years of Singapore Exchange annual reports. Please note that blank values indicate that the company did not report specifics about the iron ore contract in their annual report.
Singapore Exchange Iron Ore Benchmark Case Study (Author)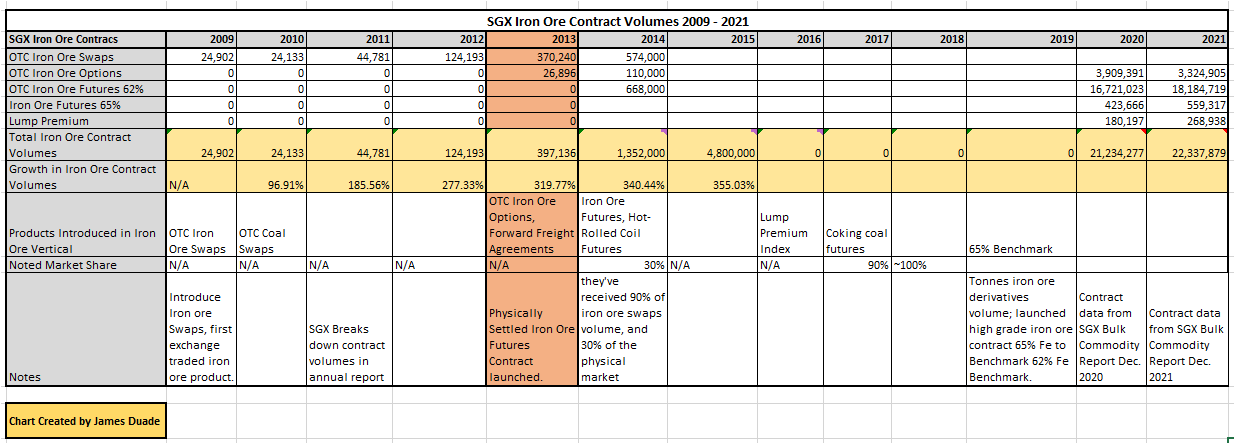
Be the first to comment