

JTSorrell
The iShares 20+ Year Treasury Bond ETF (NASDAQ:TLT) recovered over 16% since recording its 2022 low of $91.19 in October. This was after TLT crashed by more than -46% from its peak – an unprecedented decline in the post-GFC era. Although the long-term outlook for TLT is likely to be positive from the current price, conditions suggest that TLT could first decline sharply within the next 10 to 60 days. Traders seeking an attractive short-term trading opportunity could consider selling TLT short from a price of $107 with a Take-profit target starting from $100.
TLT remains in an intermediate downtrend
TLT recovered strongly from extremely oversold levels as I predicted in an article I wrote in October, 2022. Nevertheless, TLT remains below its 40-week Exponential Moving Average, or ‘EMA.’ This implies that TLT is still in an intermediate downtrend. The 40-week EMA could also provide strong resistance, which would cap the future upside.
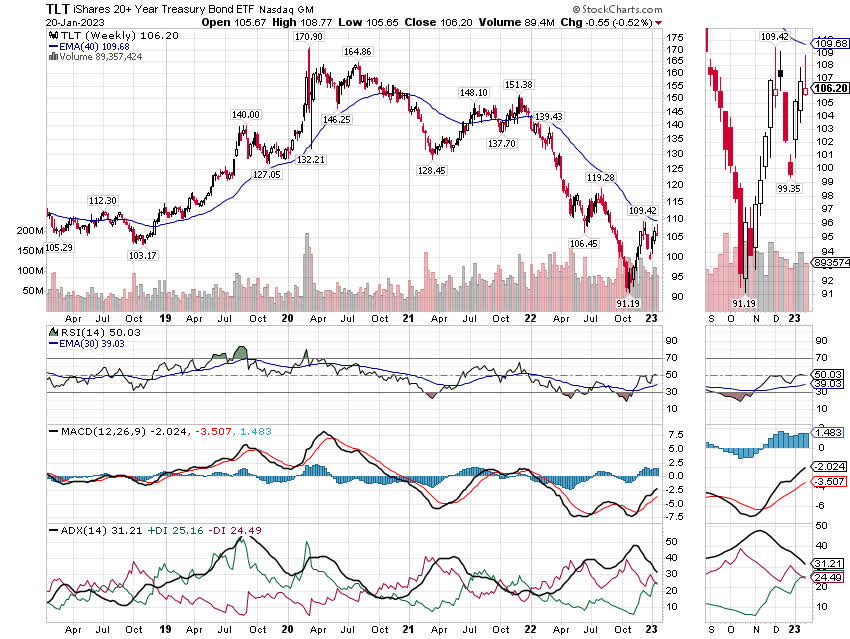
TLT weekly chart 2018-2023 (Source: created by author using stockcharts.com, January 23, 2023)
We can also observe potential resistance at $107.37 using a Point and Figure chart with a configuration of a 3% box size with 3-box reversal. This level used to be a support level that TLT broke during its decline in late 2022. TLT would need to close above $110.59 to break this resistance level, which happens to converge with the downward-sloping 40-week EMA.
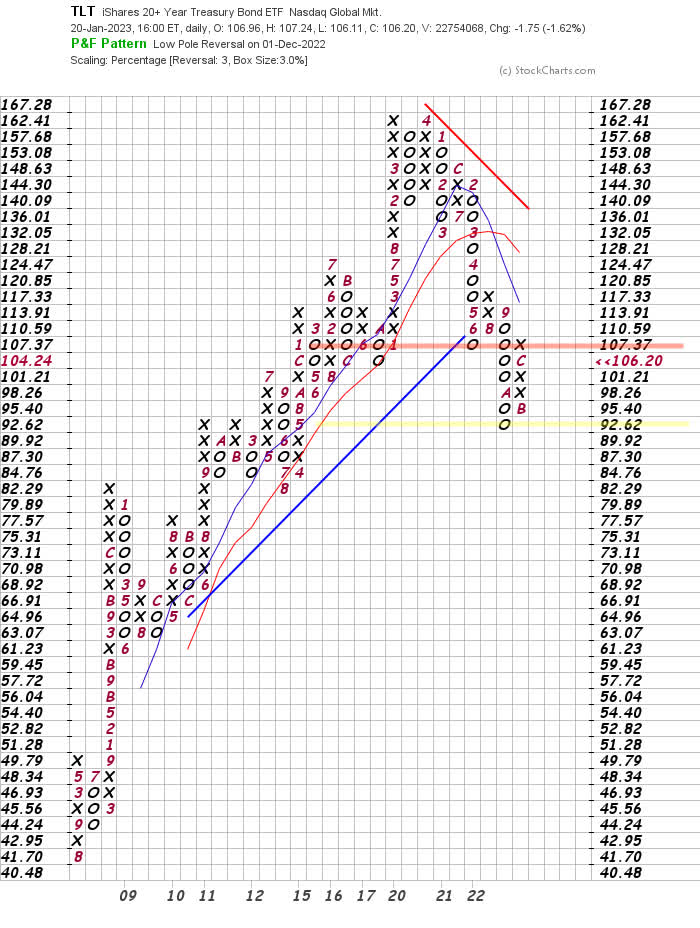
TLT Point and Figure 3pct by 3 (Source: created by author using stockcharts.com, January 23, 2023)
By changing the configuration to a 2% box size, we can see a resistance level at $108.01. This reflects a previous support level that TLT broke through in September 2022. TLT would break above this resistance level if it closes above $110.17. This emphasizes the importance of a close above approximately $111 for further gains in TLT. We can also see a potential support level at $99.79, which would break if TLT closes below $97.83.
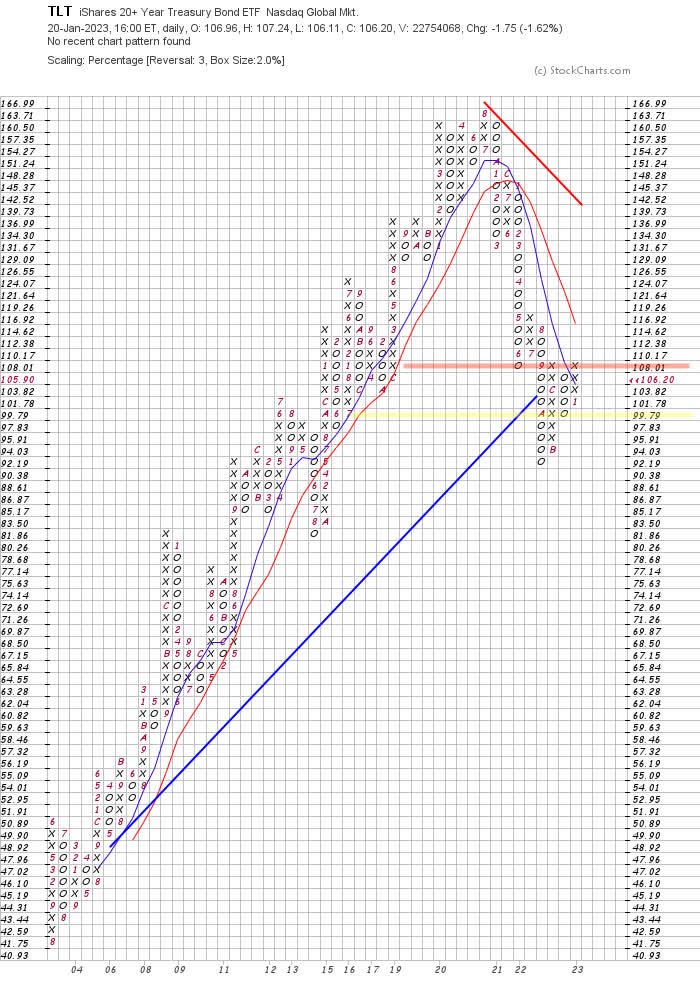
TLT Point and Figure 2pct by 3 (Source: created by author using stockcharts.com, January 23, 2023)
Keys to trading TLT successfully
To trade TLT successfully, you must correctly forecast changes in expectations for inflation and monetary policy. This is because longer-dated securities tend to have higher duration, meaning they are more sensitive than short-dated bonds to changes in expectations for inflation and monetary policy.
Instead of observing lagging indicators such as CPI, PPI and PCE, we can forecast the likely path of interest rates and monetary policy by simultaneously observing commodity markets and demand for interest rate-sensitive government bonds. We can do so using a relative strength chart of the Invesco DB Commodity Index Tracking ETF (DBC) versus TLT.
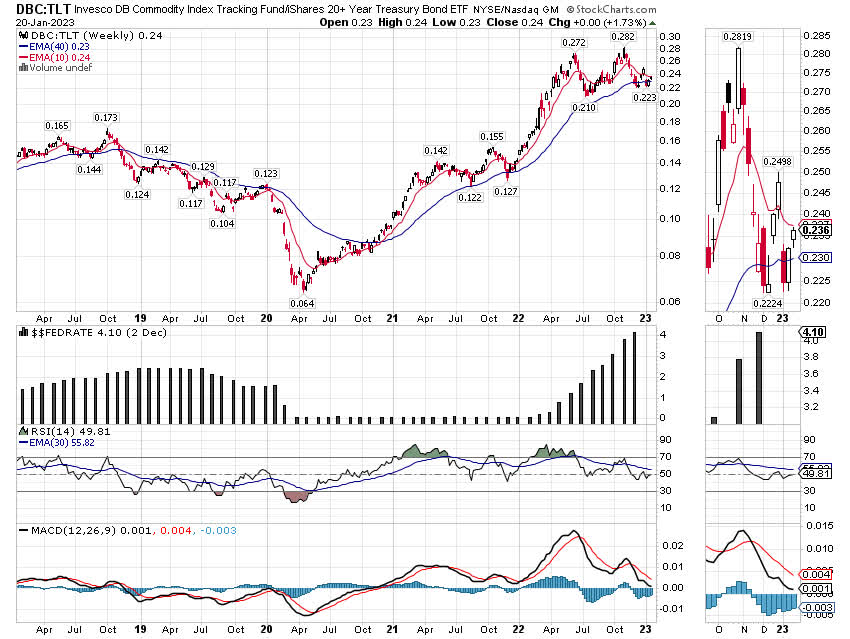
DBC vs TLT weekly chart 2018-2023 (Source: created by author using stockcharts.com, January 23, 2023)
The relative strength chart of DBC vs TLT closed above its 40-week EMA for two consecutive weeks, implying the intermediate uptrend remains barely intact. The Fed will remain under pressure to tighten policy if this uptrend remains intact. However, a lower low below the 40-week EMA will signal that disinflationary forces are taking over from the inflationary impulse that began when the chart closed above its 40-week EMA in late 2020.
The relative strength chart appears to have peaked in October 2022 following a clear bearish divergence with the weekly Relative Strength Index, or RSI. For the moment, the relative strength chart shows that the inflationary impulse peaked in October and may turn into a disinflationary trend given its proximity to the 40-week EMA and its position below the 10-week EMA.
Declining 2Y Yields Forecast a Flatter Yield Curve
We can also forecast US monetary policy by observing the yield of 2-year US treasury notes and its relationship to the Federal Reserve Fund’s Rate, or ‘FFR.’
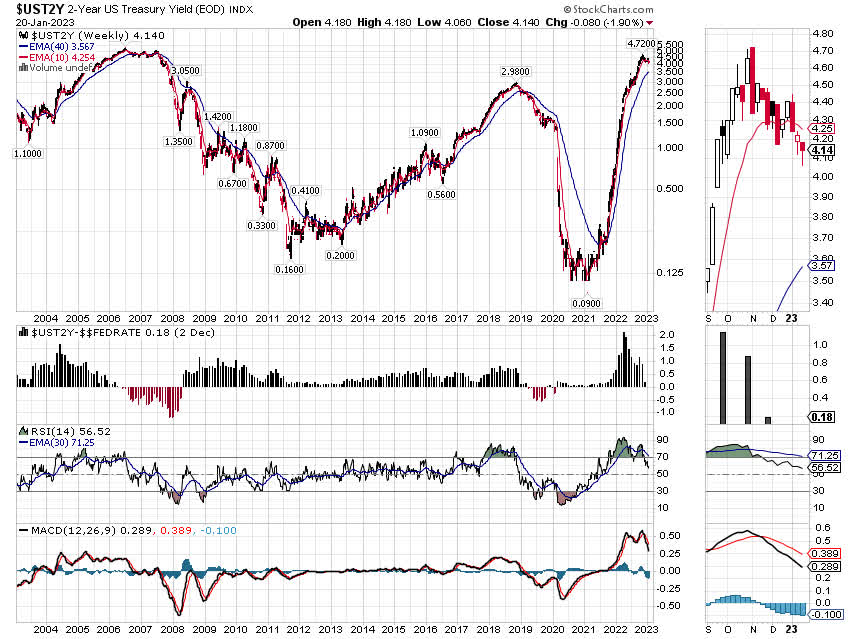
UST2Y and FFR weekly chart 2003-2023 (Source: created by author using stockcharts.com, January 23, 2023)
The yield of 2-year US treasury notes tends to lead the FFR. Also, we can see that particularly sharp declines in the 2-year treasury yield tend to occur soon after it falls below the Effective FFR. The Fed also tended to cut its benchmark rate soon after these sharp declines in the 2-year yield.
The current Effective FFR is 4.33%, meaning that the current spread between the 2-year US treasury yield and the Effective FFR -0.19%. It is likely to turn even more negative when the Fed raises its benchmark rate by at least 0.25% during the next FOMC meeting.
Implications of an Inverted Yield Curve
A yield curve plots the yield to maturity of debt obligations with different maturities from a single issuer on the y-axis against the time to maturity on the x-axis. Since investors usually require a higher interest rate to lend out for longer periods of time, an issuer’s yield curve would normally slope upwards.
Occasionally, we can observe an inversion in the yield curve of government bonds. This means the yield to maturity on longer-dated bonds is lower than the yield to maturity on shorter-dated bonds. This typically happens when investors simultaneously price in expectations for higher policy rates and falling inflation.
When the spread from subtracting the yields on longer-term bonds and shorter-term bonds gets smaller but remains positive, investors refer to the yield curve as flattening. Investors describe a convergence of yields as either a ‘bull flattener’ or a ‘bear flattener.’ A bull flattener occurs when long-term bond yields are falling faster than those of shorter-dated securities. A bear flattener occurs when short-term rates are rising faster than longer-dated ones.
The current inversion in the US government bond yield curve is the result of a bear flattener. This is important because the name implies negative consequences for the US economy over the next 12 months.
The Most Important Chart for Investors Right Now
The spread between the yields of 30-year US treasury bonds and 3-month US treasury bills is currently extremely oversold on weekly RSI with a clear bullish divergence. We can also observe a bullish divergence between the MACD histogram and price. These technical conditions suggest there is a high chance of a sharp reversal, meaning the yields will converge. The dislocation is so extreme that this may even be the bottom for this spread in this cycle.
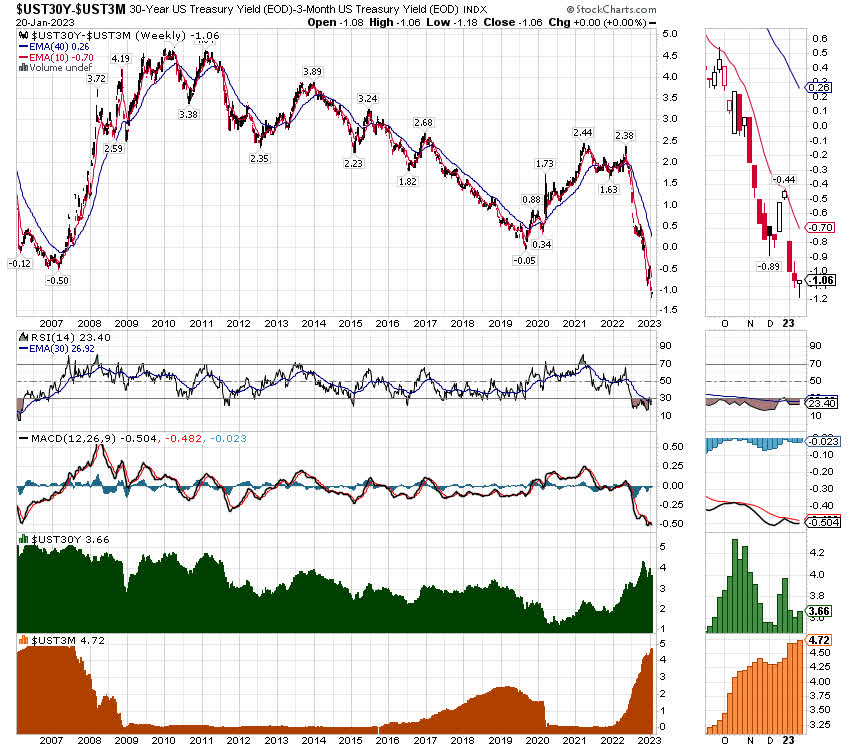
UST30Y-3M Yields 2006-2023 (Source: created by author using stockcharts.com, January 23, 2023)
We can observe a bull flattener in the early stages of the convergence between these two yields after the bottom of the last significant inversion back in 2007. This implies investors anticipating a convergence of these yields should buy short-dated US treasury bills while they sell short US treasury bonds with long-term maturities.
The importance of this chart extends to other asset classes. Within the first twelve months after the spread reached -0.50%, the S&P 500 made new all-time highs, the US dollar declined sharply and gold continued to rise.
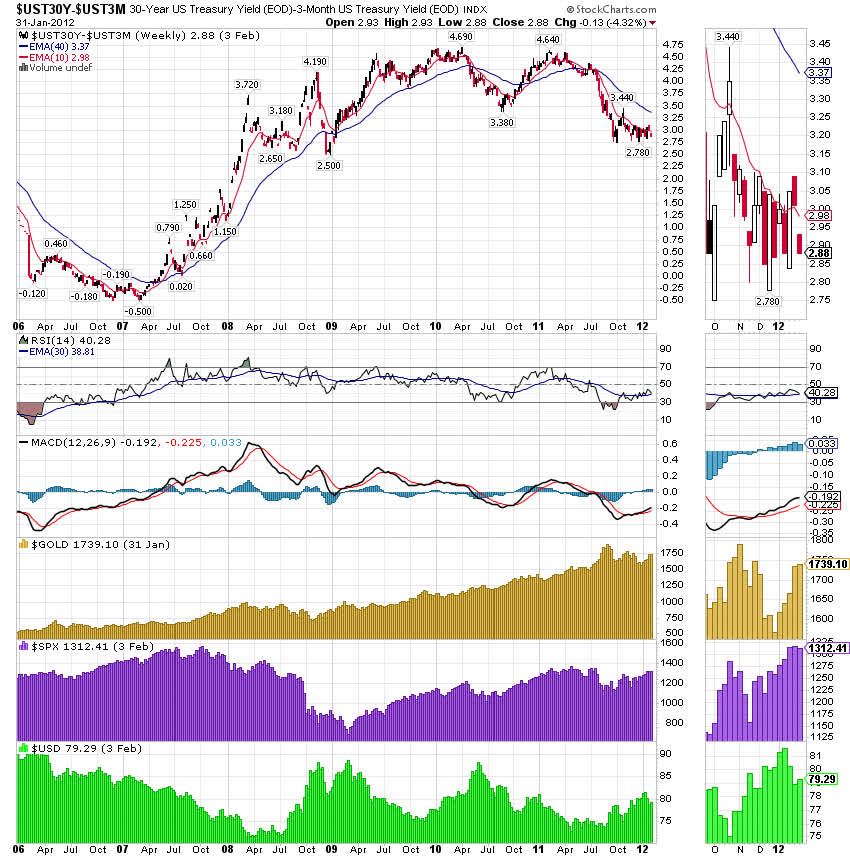
UST30Y-3M Yields 2006-2012 (Source: created by author using stockcharts.com, January 23, 2023)
Catalyst for a rise in long-term bond yields
The Fed will send a powerful signal to investors that it is reaching the end of its tightening cycle if it hikes by only 0.25% at its next FOMC meeting. This would likely push yields higher for bonds with a maturity of 10 years and longer because it would imply that the terminal rate for the tightening cycle is unlikely to exceed 5%.
Investors consider a FFR exceeding 5% to be excessively restrictive given the sell-off in equity markets in mid-October when the consensus expectation was that the terminal rate would surpass 5%. A terminal rate below an excessively restrictive threshold would boost expectations for economic growth in the short term. Any improvement in sentiment would like push expectations for inflation higher in the short term.
However, inflation expectations will not get out of control because the Fed will hold its policy rates at a restrictive level for some time to come. This means that any potential rise in long-term bond yields is likely to be limited.
Trade set-up
Given the intermediate downtrend in TLT, investors seeking a compelling short-term trade could consider selling TLT short near the 40-week EMA with a take-profit target near the next support level. The stop-loss could be just above the $110 resistance level. The timeframe for this trade should take into consideration the next two meetings of the Federal Open Market Committee on January 31/February 1, 2023, and March 21-22, 2023.
- Ideal entry price: $107 to $109
- Take-profit: $100 to $99
- Stop-loss: $111 to $113 (daily close)
- Timeframe: 8 to 57 trading days
Investors who have a longer timeframe and who believe inflation will continue to fall over the coming months and years may wish to build a long position in TLT. If you are such an investor, you should consider waiting to accumulate TLT near the Take-profit levels suggested above.
The steep inversion in the yield curve implies there is a better risk vs. reward for buying shorter-dated bonds over longer-dated ones. This strategy will work particularly well if the inversion flattens due to falling short-term rates and falling long-term rates.
In terms of nominal yields for the 30-year US Treasury Bond, this would translate to shorting the long-term bond at a yield of approximately 3.50% and closing the trade if the yield approaches 4%.
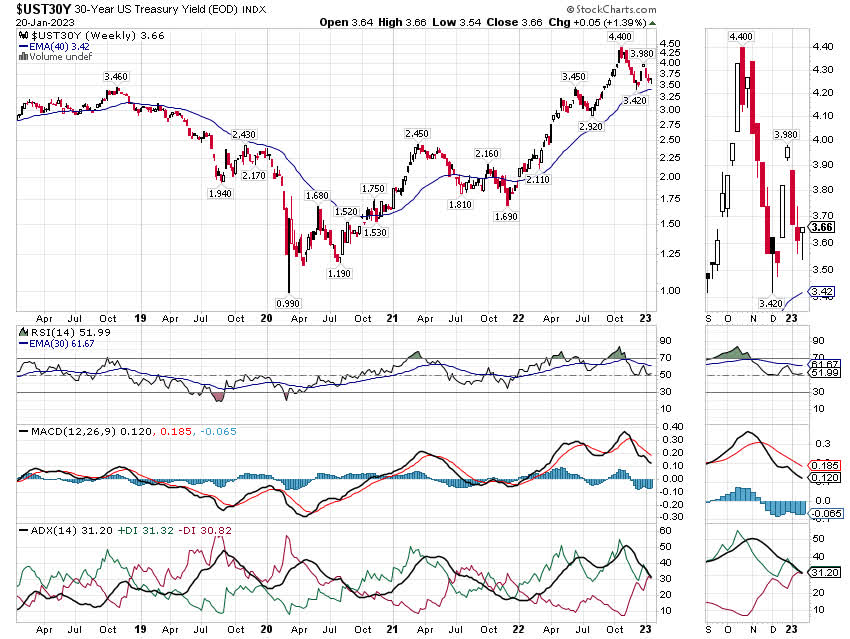
UST30Y weekly chart 2018-2023 years (Source: created by author using stockcharts.com, January 23, 2023)
What could cause a Short-TLT trade to go wrong?
First, long-term treasury bonds still offer good value for long-term investors. The real yields on 30-year and 20-year US treasury bonds are still attractively high compared to historical averages even though they declined sharply from the 2022 highs of 1.82% and 1.77% respectively.
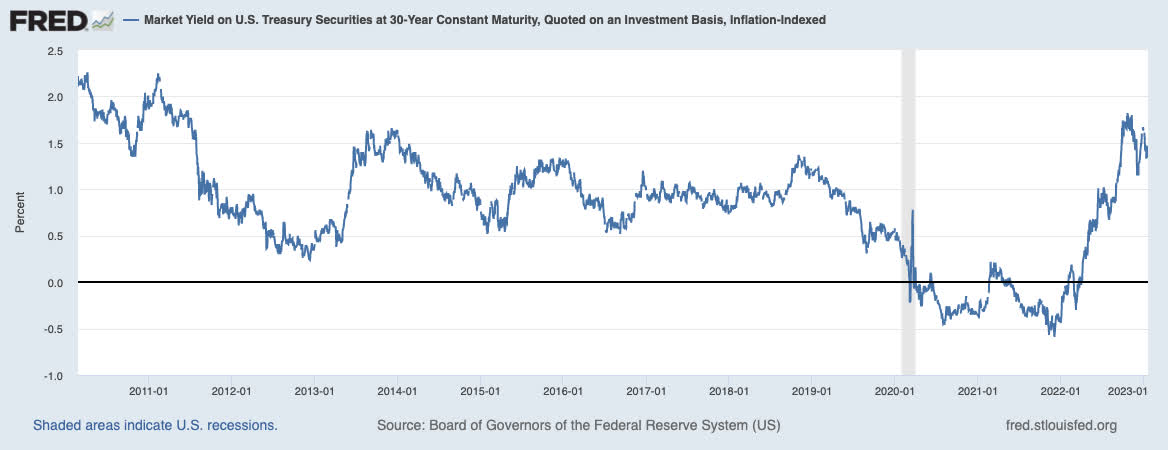
UST30Y Real Yield 2011-2023 (Source: Board of Governors of the Federal Reserve System (US), 23 January 2023)
Second, sharper-than-expected declines in inflation expectations would cause TLT to rise sharply. This is because longer-term US government bonds are sensitive to changes in inflation expectations. This may occur during the next release of CPI data on February 14, 2023.
Third, TLT would likely rise sharply if the FOMC raises its policy rate by 0.50% at its next meeting. This is because more restrictive rates increase the chances that the Fed provokes an economic accident by excessively tightening policy. The subsequent reaction from the Fed would be sharp, frequent cuts to its FFR to restore confidence and liquidity to credit markets. It can be argued that investors are already expressing their concern that the Fed has overtightened given the extent to which the yield curve has inverted.
Conclusions
The spread between 30-year US treasury bonds and 3-month treasury bills has reached an unprecedented extreme in the post-GFC era.
Given the extent to which the spread is oversold, it is likely that it has reached a bottom for this tightening cycle. Past instances of curve flattening following extreme inversions tend to include a sharp fall in short-term rates and a sharp rise in long-term rates. This implies there is a compelling short-term opportunity to sell TLT short at price of $107 to 109 with a Take-profit target of $100 to $99. Investors seeking an attractive entry point for TLT should consider waiting to buy at a price of approximately $100 given the near-term headwinds.
Be the first to comment