

S&P 500 Price Analysis & News
- S&P 500 | Biggest Surge Since 1987, Risks Remain However
- Sell in May and Go Away?
- US vs China 2.0
S&P 500 | Biggest Surge Since 1987, Risks Remain However
April Surge: The past month saw a significant rebound in risk appetite stemming from a plethora of open-ended QE, governments loosening fiscal policy, alongside a slowing in the spread of coronavirus, prompting economies to look at re-opening. In turn, the S&P 500 posted its best month since 1987.
| Change in | Longs | Shorts | OI |
| Daily | 7% | -2% | 0% |
| Weekly | -3% | 1% | 0% |
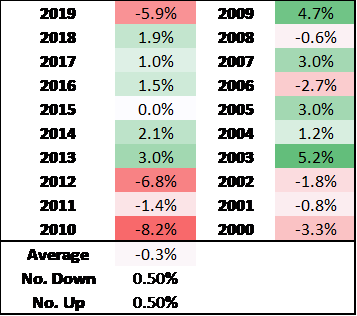
Sell in May and Go Away?: As is typically the case every year, there is a flurry of questions over the quote “Sell in May and Go Away”. However, looking back at the past 20 years, this has only been true 50% of the time with the largest drawdown taking place in 2010. That said, in light of the surge in risk sentiment over the last month, the rebound may be somewhat exhausted given that the outlook over the potential recovery remains uncertain. This has been apparent with many central bank officials walking back on the idea of a “V” shaped recovery, which has seemingly been priced in equity markets.
Sell in May and Go Away is a 50/50
US vs China 2.0: Overnight, risk assets have taken a slight hit as US President Trump threatened to place retaliatory tariffs on China over the coronavirus outbreak, which in turn presents fresh downside risks for the S&P 500, particularly as there is a potential for China to step up their war of words in response. (Eyes on China’s mouthpiece, the Global Times).

Recommended by Justin McQueen
Introduction to Forex News Trading
S&P Price Chart: Daily Time Frame
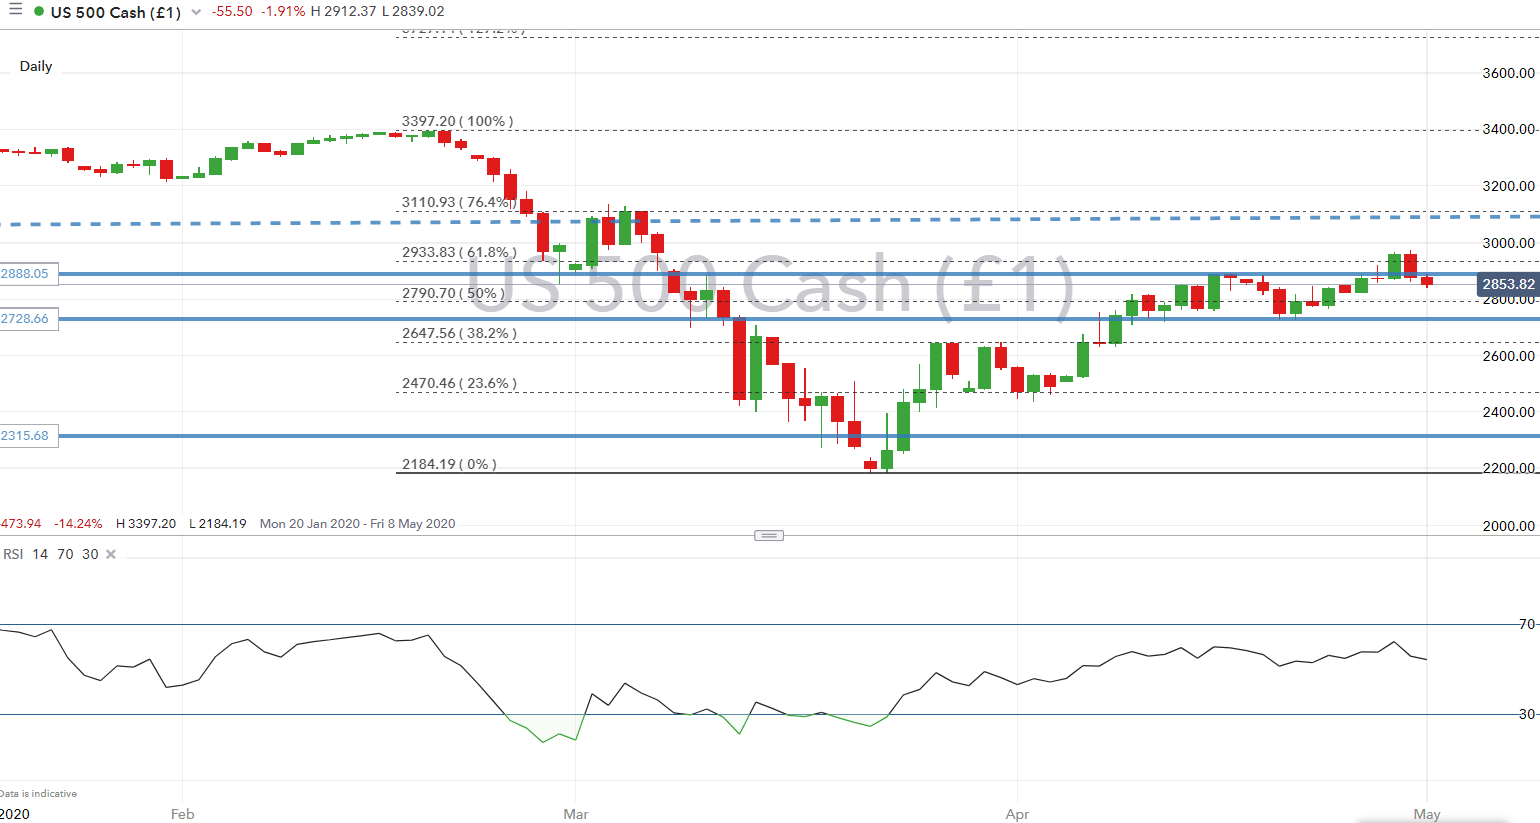
Source: IG Charts
— Written by Justin McQueen, Market Analyst
Follow Justin on Twitter @JMcQueenFX
Be the first to comment