

Liliya Kulianionak/iStock via Getty Images
This dividend exchange-traded fund (“ETF”) article series aims at evaluating products regarding the relative past performance of their strategies and quality metrics of their current portfolios. Holdings and weights change over time, so updated reviews are posted when necessary.
SDOG strategy and portfolio
The ALPS Sector Dividend Dogs ETF (NYSEARCA:SDOG) has been tracking the S-Network Sector Dividend Dogs Index since 06/29/2012. It has 50 holdings, a dividend yield of 4.09% and a total expense ratio of 0.4%. Distributions are paid quarterly.
As described on ALPS website, the fund:
“applies the ‘Dogs of the Dow Theory‘ on a sector-by-sector basis using the S&P 500 Index as its starting universe of eligible securities. SDOG provides high dividend exposure across 10 sectors of the market by selecting the five highest yielding securities in each sector and equally weighting them.“
The GICS classification has 11 sectors, but real estate is excluded from the universe. The underlying index doesn’t use quality filters and is entirely based on dividend yield.
SDOG is almost exclusively invested in U.S.-based companies (about 96%), 47% in large caps and 53% in mid-caps. The top 10 holdings, listed below, weigh 23% of asset value. None of them weighs more than 3%, so the risks related to individual stocks are limited.
|
Ticker |
Name |
Weight |
EPS Growth % TTM |
P/E TTM |
P/E fwd |
Yield % |
|
Cardinal Health, Inc. |
2.73% |
-266.44 |
N/A |
13.41 |
2.81 |
|
|
Principal Financial Group, Inc. |
2.39% |
186.14 |
4.67 |
11.81 |
3.33 |
|
|
Huntington Bancshares Inc. |
2.35% |
16.22 |
12.58 |
9.97 |
4.38 |
|
|
The Southern Co. |
2.28% |
-3.87 |
28.03 |
22.05 |
3.43 |
|
|
Huntington Ingalls Industries, Inc. |
2.26% |
-21.13 |
15.93 |
15.23 |
2.03 |
|
|
Gilead Sciences, Inc. |
2.22% |
-19.92 |
19.85 |
9.86 |
4.49 |
|
|
Franklin Resources, Inc. |
2.21% |
39.37 |
7.79 |
7.32 |
4.42 |
|
|
Snap-on Inc. |
2.20% |
11.10 |
13.94 |
13.66 |
2.55 |
|
|
Conagra Brands, Inc. |
2.18% |
-30.80 |
18.63 |
14.25 |
3.85 |
|
|
Truist Financial Corp. |
2.16% |
15.28 |
10.90 |
10.55 |
4.33 |
The fund is equal weighted in stocks, and also in all GICS sectors except real estate on every rebalancing day. After some price drift, the heaviest sector now is financial (11.15%) and the lightest one is materials (8.5%).
SDOG sector breakdown (chart: author; data: ALPS Funds and Fidelity)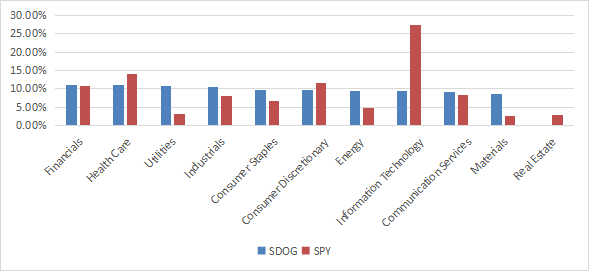
SDOG is much cheaper than (SPY) regarding usual ratios (see next table). The price/sales ratio is especially impressive.
|
SDOG |
SPY |
|
|
P/E TTM |
11.97 |
19.63 |
|
Price/Book |
2.07 |
3.72 |
|
Price/Sales |
0.88 |
2.4 |
|
Price/Cash Flow |
7.91 |
14.98 |
Data: Fidelity
Performance
Since inception in June 2012, SDOG has lagged SPY and the Schwab U.S. Dividend Equity ETF (SCHD) by about 2.3 percentage points in annualized return, with a higher risk in drawdown and volatility (standard deviation of monthly returns).
|
Total Return |
Annual.Return |
Drawdown |
Sharpe Ratio |
Volatility |
|
|
SDOG |
187.70% |
10.94% |
-40.97% |
0.69 |
15.73% |
|
SPY |
253.45% |
13.21% |
-32.05% |
0.91 |
13.99% |
|
SCHD |
257.01% |
13.32% |
-32.29% |
0.93 |
13.53% |
The next chart plots the equity value of $100 invested in SDOG and SPY since SDOG inception. SDOG was almost on par with SPY until the correction of February 2018, then it underperformed until 2021.
SDOG vs. SPY since inception (Chart: author; data: Portfolio123)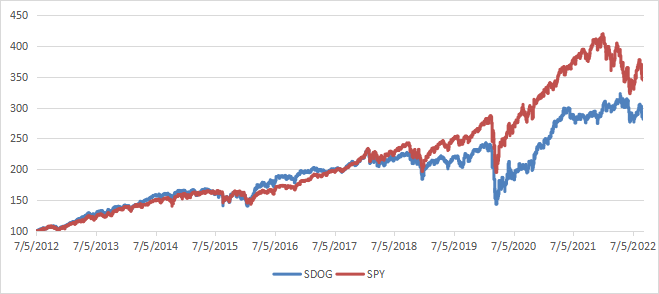
However, SDOG is beating SPY and SCHD this year (see next chart).
SDOG vs. SPY vs. SPYD 2022 to date (Portfolio123)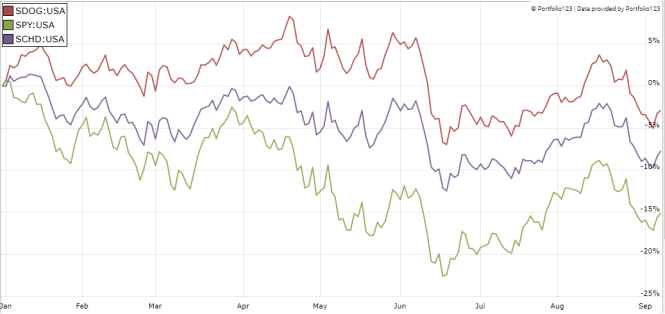
Comparing SDOG with a reference strategy based on dividend and quality
In previous articles, I have shown how three factors may help cut the risk in a dividend portfolio: Return on Assets, Piotroski F-score, and Altman Z-score.
The next table compares SDOG since inception with a subset of the S&P 500: stocks with a dividend yield above the average of their respective indexes, an above-average ROA, a good Altman Z-score, a good Piotroski F-score and a sustainable payout ratio. It is rebalanced quarterly to make it comparable with a passive index.
|
Total Return |
Annual.Return |
Drawdown |
Sharpe Ratio |
Volatility |
|
|
SDOG |
187.70% |
10.94% |
-40.97% |
0.69 |
15.73% |
|
Dividend & quality subset |
311.31% |
14.90% |
-34.96% |
1.01 |
14.15% |
Past performance is not a guarantee of future returns. Data Source: Portfolio123
SDOG lags the S&P 500 dividend and quality subset by 4 percentage points in annualized return. However, SDOG performance is real, whereas the subset performance is hypothetical. My core portfolio holds 14 stocks selected in this subset (more info at the end of this post).
Scanning SDOG with quality metrics
SDOG holds 50 stocks, of which 9 are risky stocks regarding my metrics. In my ETF reviews, risky stocks are companies with at least 2 red flags among: bad Piotroski score, negative ROA, unsustainable payout ratio, bad or dubious Altman Z-score, excluding financials and real estate where these metrics are less relevant. Here, risky stocks weigh about 18% of asset value, which is not a good point.
According to my calculation of the weighted quality metrics reported in the next table, the ROA and Altman Z-score are inferior to the benchmark.
|
SDOG |
SPY |
|
|
Altman Z-score |
2.2 |
3.4 |
|
Piotroski F-score |
6 |
6 |
|
ROA% TTM |
6.18 |
7.39 |
Takeaway
SDOG invests in high-yield S&P 500 stocks. It implements a strategy similar to the Dogs of the Dow, by picking companies with the five highest yields in every sector except real estate, and follows an equal-weight methodology. Keeping an equal weight in 10 sectors, with 5 positions in each sector is an efficient way to limit risks related to individual stocks and sector rotation cycles. Valuation ratios are attractive, but quality metrics are a bit below the benchmark.
Historically, SDOG performance was similar to SPY in the first 6 years after inception, then it started lagging, like many dividend ETFs. It has outperformed SPY by about 12 percentage points in 2022 to date. SDOG is a good product for investors looking for high yield with a balanced sector exposure. Higher yield generally comes with higher risk, and SDOG is no exception: it shows a higher volatility and deeper drawdown than the benchmark. SCHD looks safer regarding risk metrics. SDOG has an average rating at Morningstar (3 stars).
For transparency, a dividend-oriented part of my equity investments is split between a passive ETF allocation (SDOG is not part of it) and my actively managed Stability portfolio (14 stocks), disclosed and updated in Quantitative Risk & Value.
Be the first to comment