

damedeeso
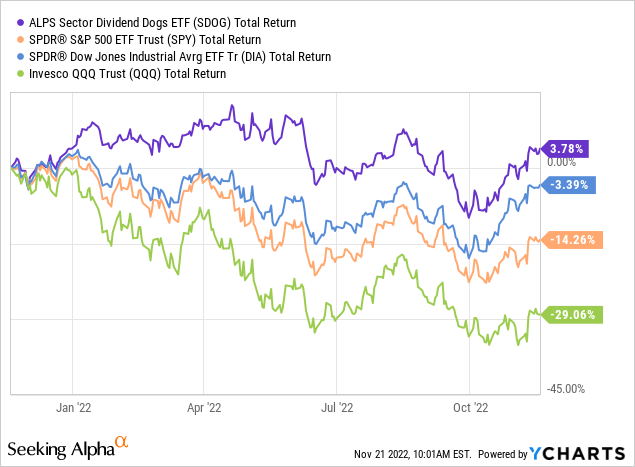
The ALPS Sector Dividend Dogs ETF (NYSEARCA:SDOG) has taken the ‘Dogs of the DOW’ theory and broadened it out to consider the entire S&P 500 basket of companies for possible inclusion in the portfolio. In addition, the fund the selects the five-highest dividend yielding companies in each of 10 sectors and establishes an equal-weight position in all of them – and it re-balances the portfolio on a quarterly basis. The end result is a well-diversified portfolio that delivers income superior to that of the broad S&P 500. As you might expect, the SDOG ETF has significantly outperformed the broad market averages – as represented by the S&P 500 (SPY), DJIA (DIA), and NASDAQ-100 (QQQ) – during the 2022 bear-market (see below). Today, I’ll take a closer look at the SDOG ETF to see if it might be a good fit within your portfolio.
Investment Thesis
As my followers know, I am a big proponent of building and maintaining a well-diversified portfolio and holding it throughout the volatile market ups-n-downs. I also recommend allocating capital, into various investment categories, using a top-down approach. One important category is “dividend income”, but it is certainly not the only category as many investors have been led to believe. Consider reading one of my most popular Seeking Alpha articles: Retirees Beware: Dividend Investing Is Overrated – which was quite controversial and generated over 1,500 comments. My point in that article was that while holding dividend income stocks is certainly an important ingredient in successful investing, following a very rigid investment “strategy” that only invests in them – or significantly over-emphasizes them – is a sure way to lag the long-term returns that the market is more than willing to give a more well-diversified investor.
All that being said, there are obviously multiple ways to achieve exposure to dividend income within your portfolio. One way, of course, is to pick-n-choose excellent individual dividend paying and dividend growth stocks. Another is to select a dividend yield oriented fund (such as the SDOG ETF). And a third is to employ both strategies, as I do with my dividend paying stocks combined with a significant allocation to the Schwab Dividend Equity ETF (SCHD).
With that as background, today I’ll take a close look at the SDOG ETF to see if it might deserve an allocation within your portfolio.
Top-10 Holdings
The top-10 holdings in the SDOG ETF are shown below and were taken directly from the ALPS SDOG ETF homepage. The top-10 holdings equate to what I consider to be a relatively well-diversified 23.2% of the entire 50-company portfolio:
ALPS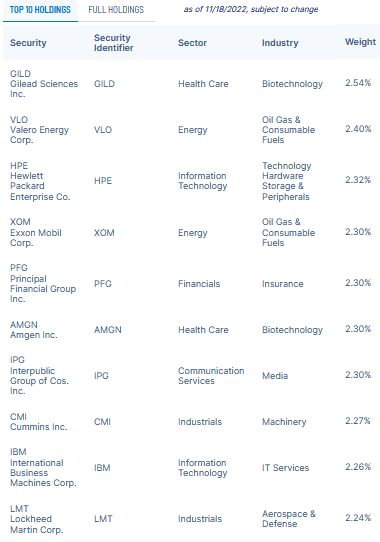
As we go through some of the stocks in the top-10 list, it is important to remember what I mentioned above: at the quarterly re-balancing point, and all things being equal, each of the 50 companies in the portfolio would have a 2% weight. During the quarter, these stocks will obviously move higher or lower, and thus the weightings will change.
Currently, the #1 holding is Gilead Sciences (GILD) with a 2.5% weight. Gilead is a global biopharma company that discovers, develops, and commercializes medicines. Gilead has a proven track record of discovering and developing new drugs and treatments, including Atripla products for the treatment of HIV/AIDS and in 2019, Veklury, an injection for intravenous use for the treatment of coronavirus disease. GILD is +21% over the past year, yields 3.49%, and trades with a forward P/E well below that of the broad market (only 11.8x).
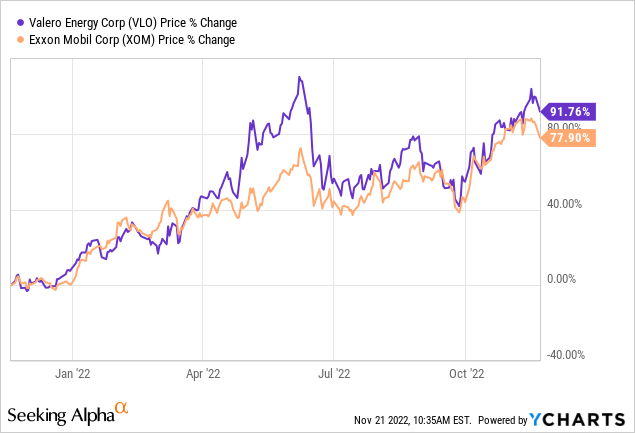
As you might expect, energy companies are well represented in SDOG’s top-10 holdings, with refiner Valero (VLO) and international integrated major energy company Exxon Mobil (XOM) holding down the #2 and #4 positions with weights of 2.4% and 2.3%, respectively. Valero yields 2.85% and XOM yields 3.25%. Both stocks are continuing to benefit from relatively high refining crack-spreads, especially for diesel. And both stocks have clearly trounced the broad market over the past year:
Amgen (AMGN) is the #6 holding with a 2.3% weight. Amgen’s recent Q3 earnings report was a strong beat on both the top- and bottom lines. The global healthcare company – which discovers, develops, manufactures, and delivers therapeutics – also raised guidance. The stock is up 43% over the past year and has reached an all-time record high. AMGN yields 2.7% and trades with a forward P/E of 16.3x.
Truck and nat-gas/diesel engine marker Cummins (CMI) is the #8 holding. Cummins beat estimates in Q3 with revenue of $7.3 billion was up 22.3% yoy. However, the company guided FY22 EBITDA lower. CMI expects to return ~50% of operating cash flow to shareholders in 2022 in the form of dividends and share repurchases. The stock yields 2.51%.
“Old-tech” company International Business Machines (IBM) is the #9 holding with a 2.3% weight. IBM has found new-life of late due to its hybrid-cloud platform and Red Hat software. The stock yields a strong 4.47% and is up 26% over the past year.
Defense & Aerospace leader Lockheed Martin (LMT) rounds out the top-10 holdings with a 2.2% weight. In the first week of November, Lockheed bagged two big Navy contracts: one for $765 million and the other for $581 million.
On November 11, Lockheed stock dropped after the company was a victim of a fake tweet on Twitter that claimed:
We will begin halting all weapons sales to Saudi Arabia, Israel and the United States until further investigation into their record of human rights abuses. #WeAreLM.
YCharts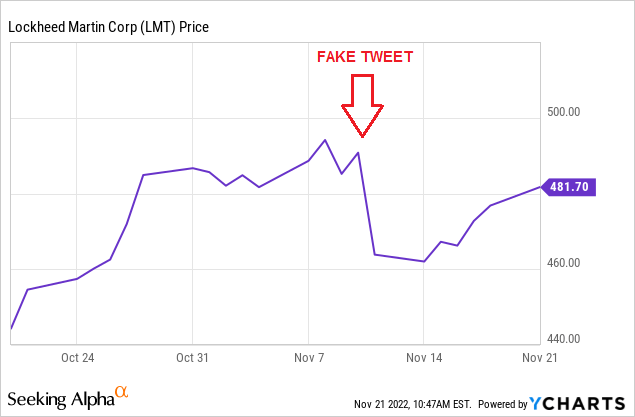
NOTE: red annotation added by the author.
Yet, as can be seen by the graphic, the stock has regained most of the ground it lost due to the false Tweet.
Going forward, Lockheed is likely to be a big beneficiary of increased orders from the U.S. Department of Defense (“DoD”) and fellow NATO members as a result of Putin’s horrific war-on-Ukraine and the resulting support of high-tech military equipment sent to Ukraine to enable the country to better defend itself. Indeed, the U.S. DoD recently announced it was moving quickly to “replenish weapons sent to Ukraine. LMT stock is up 40% over the past year, yields 2.52%, and trades with a forward P/E of 17.7x.
Overall, as of 11/18/2022, the SDOG ETF’s portfolio has the following sector exposure:
ALPS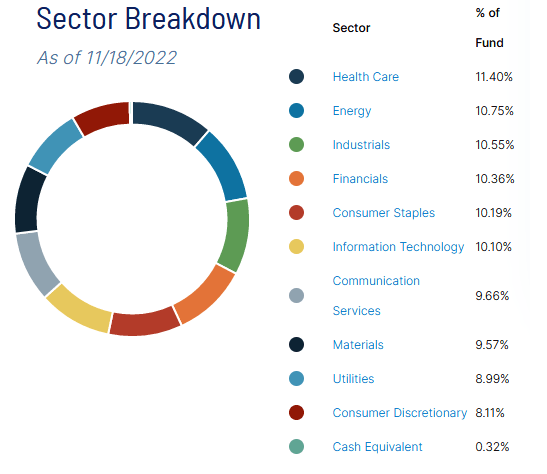
Again, I remind investors that – all things being equal – these 10-sectors will be re-balanced next quarter to each have a ~10% weight. That being the case, the way to view the graphic above is to realize that the best performing sector – during the current quarter – is on top (i.e. Health Care), and the list works its way down toward the worst performing sector on the bottom (Consumer Discretionary).
Performance
The SDOG’s long-term performance track record is shown below:
ALPS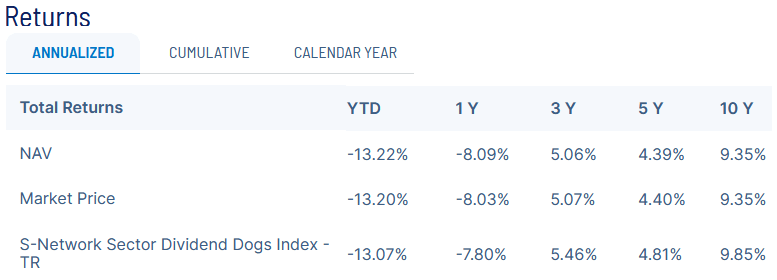
While the 10-year average annual return of 9.35% is admirable, it is interesting to note that it trails its tracking Index (i.e. the S-Network Dividend Dogs Index) by a pretty significant 0.5%.
The following graphic compares the 5-year total returns of the SDOG ETF with those of its dividend centric peers such as the SCHD ETF, the Vanguard Dividend Appreciation ETF (VIG), the Vanguard High Dividend Yield ETF (VYM), and the First Trust Morningstar Dividend Leaders ETF (FDL):
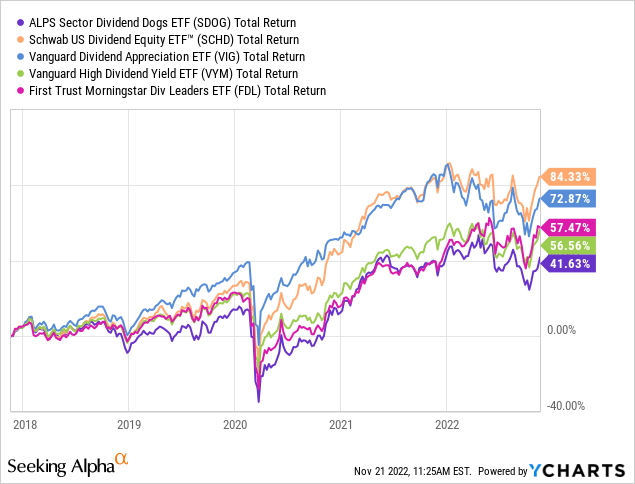
As you can see in the graphic, once again the SCHD dividend ETF beats the pack by a significant margin and – somewhat surprising to me – the SDOG ETF is, by a rather considerable amount, the worst performing ETF.
Risks
Dividend paying ETFs like SDOG are not immune to the overall investing macro-environment risks. High inflation, rising interest rates, and the negative impact of Russia’s unprovoked and unwarranted war-on-Ukraine – that has effectively broken the global energy and food supply chains – are all currently working against the global economy and are therefore putting pressure on stock markets around the globe.
Summary & Conclusion
In general, I like the theory behind the SDOG ETF’s strategy of investing in the top-5 dividend paying companies across 10 diverse sectors within the S&P500. However, the implementation of that strategy is lacking in my opinion. First off, the 0.40% expense fee is considerably higher than that of the arguable leader: SCHD’s expense fee is only 0.06%. That is a whopping 34 basis point difference and has much to do with SCHD’s superior returns. The other problem is that the SDOG ETF lags the index it tracks by 0.5%, a fairly wide margin, which again can somewhat be explained by the relatively high expense fee.
That said, I do expect the SDOG ETF to outperform the broad market over the next 6-9 months- so I rate it a HOLD. However, for my money – and for investors looking to build a well-diversified portfolio for the long-term – the SCHD ETF’s superior long-term performance track-record is hard to ignore and its current yield of 3.36% is only 3-basis points below SDOG’s current 3.39% yield.
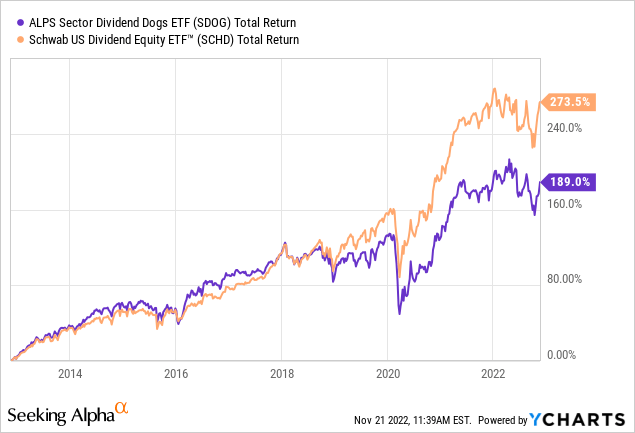
I’ll end with a 10-year comparison of the SDOG ETF’s total returns as compared to those of the SCHD ETF:
Be the first to comment