

bankrx
Investment Thesis
The AAM S&P 500 High Dividend Value ETF (NYSEARCA:SPDV) routinely underperforms its peers, suggesting that its free-cash-flow-yield strategy isn’t optimal. On its surface, this equal-weight-by-sector ETF has several attractive qualities, like good diversification and a low 12.80x forward earnings valuation. However, a look under the hood reveals an over-reliance on the high-performing Energy sector, poor quality compared to lower-cost alternatives, and questionable growth potential. I don’t recommend investors buy SPYD, and I look forward to explaining why in further detail below.
SPDV Overview
Strategy Discussion and Performance History
SPDV tracks the S&P Dividend and Free Cash Flow Yield Index and takes an equal-weight-by-sector approach, with five S&P 500 companies in each. I previously documented how specific sectors are advantaged in the selection process for value Indexes. For example, Financial companies account for 13-14% of the S&P 500 Equal Weight Index and often have low valuations. They’re more likely prominent holdings in other value-oriented Indexes, but the equal-weights-by-sector approach negates this advantage.
The Index screens companies for a high indicated dividend yield and trailing free cash flow yield, defined as free cash flow per share divided by the share price. Reconstitutions occur effective the last business day in January and July, and SPDV has a 0.29% expense ratio. The high 0.24% median bid-ask spread is worth noting, which adds to the cost of trading. For comparison, the Schwab U.S. Dividend Equity ETF (SCHD) has a 0.01% median bid-ask spread and a 0.06% expense ratio.
Advisors Asset Management provides the following performance history for SPDV. Since its inception, the gain through December 2022 was 6.88% compared to 9.67% for the S&P 500 Index. There was a 0.35% total annualized tracking error (6.88% vs. 7.23%) with the benchmark Index.
Advisors Asset Management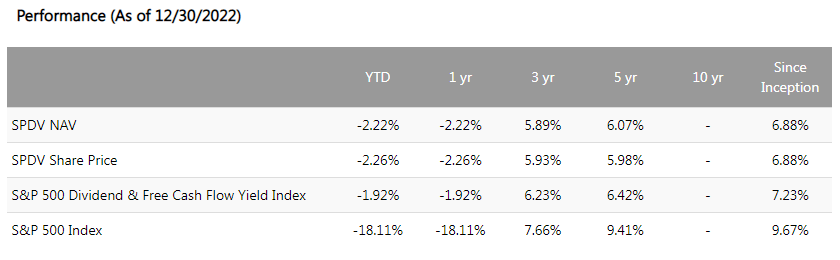
The S&P 500 Index isn’t an ideal benchmark not only because it’s more growth-oriented but because it’s market-cap-weighted. Instead, we can isolate the value of the screens by considering SPDV’s performance against the ALPS Equal Sector Weight ETF (EQL). As shown, EQL was superior in every way, including better returns (9.28% vs. 6.87%), lower standard deviation (17.71% vs. 20.82%), and a lower maximum drawdown (22.14% vs. 32.93%).
Portfolio Visualizer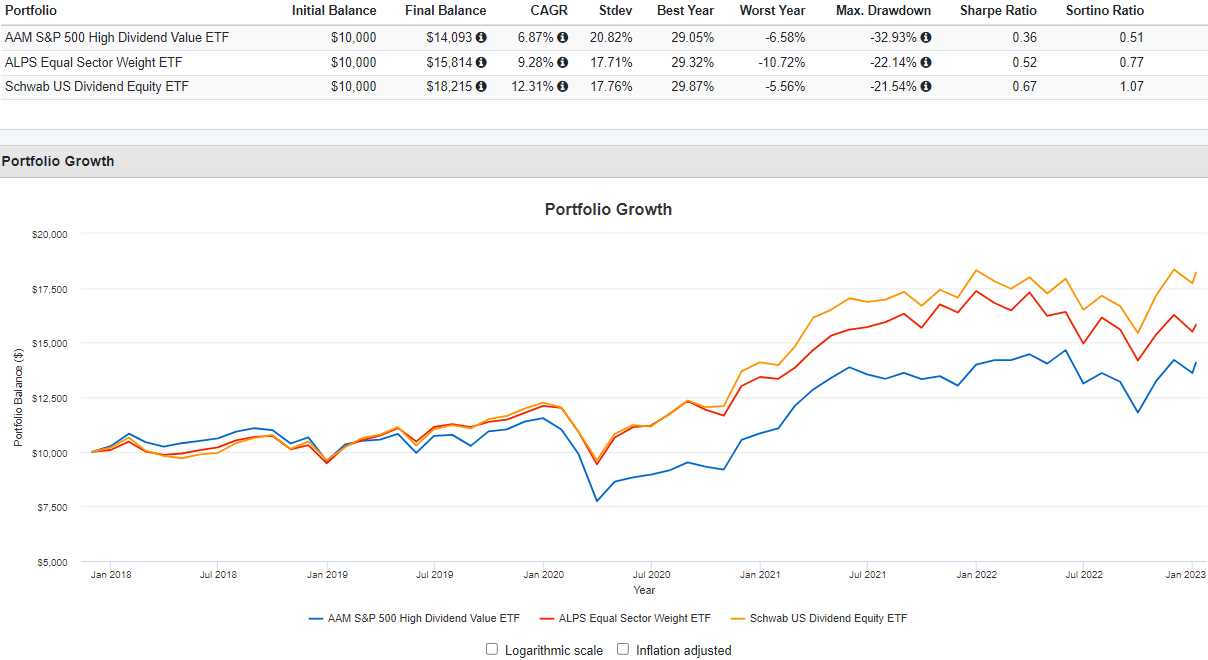
SCHD shows that a high-dividend ETF could earn a high total return over the last five years. SCHD gained an annualized 12.31% and never substantially underperformed SPDV in any year. Even in 2022, SPDV’s deep-value strategy only outperformed by 0.51%, while SCHD outperformed by 6.82% and 21.15% in 2019 and 2020. Maintaining NAV is crucial for distributions, and you can see in the graph below how SPDV’s portfolio income on a $10K investment dried up in those years while SCHD’s increased.
Portfolio Visualizer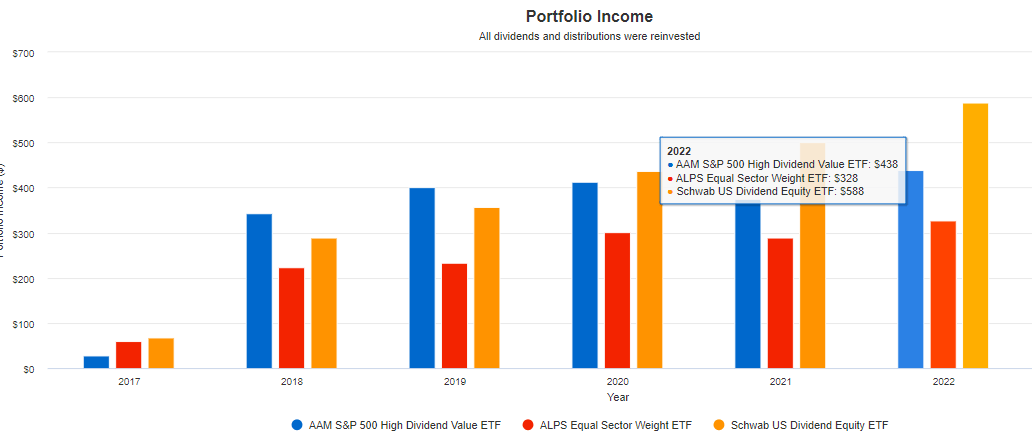
Weak dividend growth is why SPDV’s Dividend Grade isn’t stronger. The three-year growth rate is 3.89% compared to 14.10% for SCHD and combined with its poor track record, I’m not convinced the strategy works.
Seeking Alpha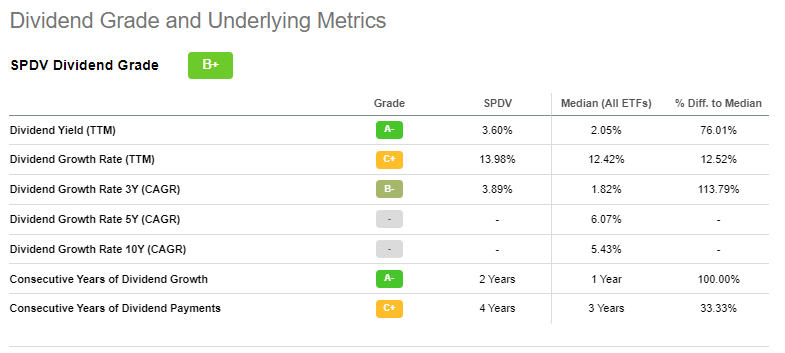
Sector Exposures and Top Ten Holdings
Each sector is assigned a 9.09% weighting (9.09% x 11 sectors = 100%) on each rebalancing date, using prices five days before the end of December and June. Readers should remember that exposures change between rebalancings based on performance. As indicated below, Energy, Health Care, and Consumer Discretionary are recent top-performing sectors, while Real Estate, Materials, and Communication Services.
Advisors Asset Management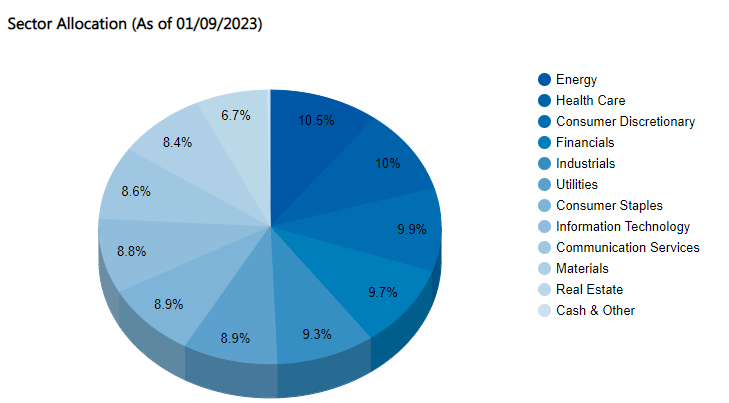
Individual holdings are equal-weighted like sectors, with the top ten listed below representing the best performers since the last rebalancing. They include Gilead Sciences (GILD), Bath & Body Works (BBWI), and Principal Financial Group (PFG).
Advisors Asset Management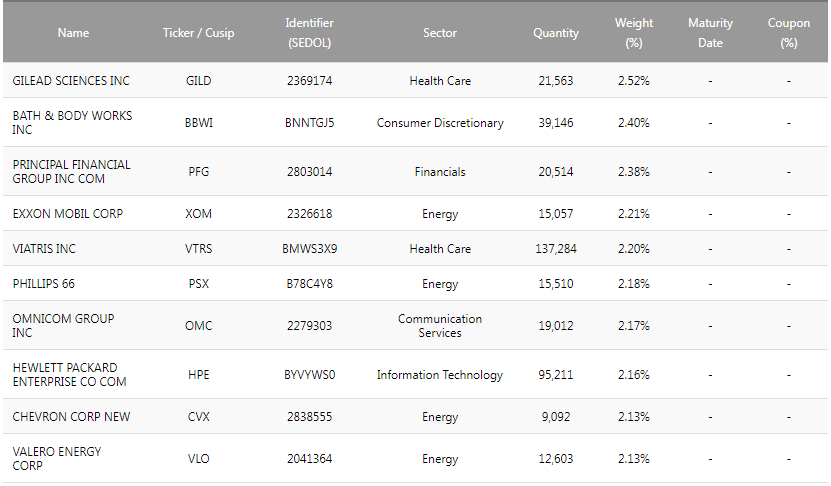
SPDV Analysis
Fundamentals By Company
The following is a representative sample of SPDV’s fundamentals, including at least two representatives from each sector. Many summary statistics look strong, including a 12.80x forward earnings valuation and an estimated 10.07% earnings growth rate. However, there are some red flags.
The Sunday Investor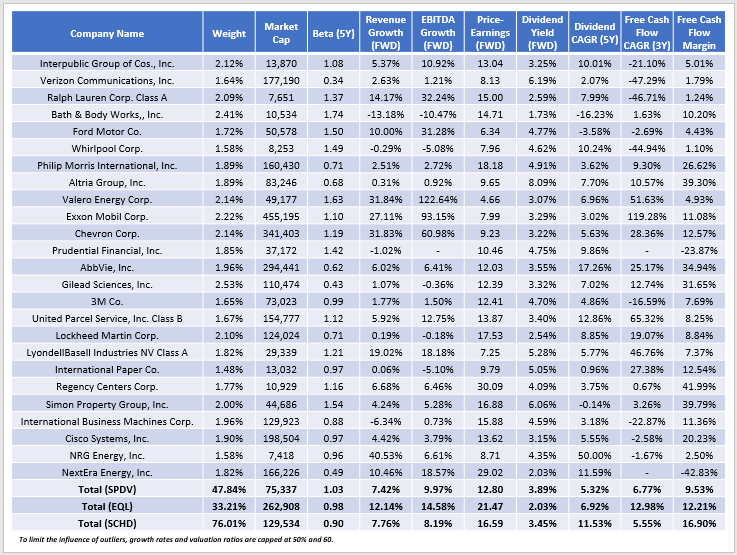
The share price is the common denominator for both dividend yield and free cash flow yield, and these results strongly suggest it’s the dominant factor. Consider how SPDV’s three-year free cash flow growth rate is only 6.77%, nearly half what EQL offers and only slightly above SCHD’s 5.55% figure. Moreover, free cash flow margins are just 9.53%, compared to 12.21% and 16.90% for EQL and SCHD. The sample reveals several companies with margins of 5% or lower, including Interpublic Group (IPG), Verizon Communications (VZ), Ralph Lauren (RL), and Ford Motor (F). Ford is a good example, as the company earned $0.66 free cash flow per share compared to $2.40 a year earlier. Buying a stock that lost 42% last year may work out eventually, but that’s effectively the strategy.
Seeking Alpha
Further evidence of aggressive bargain-hunting is with SPDV’s median $31 billion market capitalization. The weighted average is $75 billion, far less than most dividend-focused ETFs like SCHD offer. Usually, the result is more volatility and lower profitability. SPDV has a 1.01 five-year beta, suggesting no downside protection in market downturns, and its implied Seeking Alpha Profitability Score is 8.46/10 compared to 9.32/10 for SCHD.
SPDV’s summary growth metrics are better than expected, but they are unlikely to materialize in a recession. Oil prices likely fall in such a scenario, and there’s more margin for error with an ETF like EQL. To be sure, SCHD isn’t immune from these risks, either. I criticized poor growth in a recent article, comparing it against 100 peers. However, it’s superior to SPDV because of its lower volatility, more robust dividend growth, and superior profitability. As a bonus, SCHD’s track record is excellent, whereas SPDV’s is not.
Investment Recommendation
SPDV trades at just 12.80x forward earnings and has an expected 3.60% dividend yield after adjusting for expenses. While these are attractive features, I determined that selections were primarily because of low share prices rather than strong free cash flow growth or margins. As a result, quality and growth potential are limited, and investors effectively own a basket of poor-performing stocks that may deserve to be near the bottom of the S&P 500. Historically, the strategy has failed compared to EQL, its closest comparator. Barring any significant change next month when the Index reconstitutes, I recommend that investors refrain from buying SPDV.
Be the first to comment