

iQoncept
Thesis
The Schwab U.S. Large-Cap ETF (NYSEARCA:SCHX) and SPDR S&P 500 Trust ETF (NYSEARCA:SPY) are two of the most popular index funds in the large-cap space. They are identical in many ways, as to be elaborated on later. And as a result, they are almost interchangeable for many investors.
Such interchangeability is totally justified in the long term, as you can see from the figure below. Their historical performance and risk profiles are almost identical over the long term. To wit, since 2009, SCHX has delivered an annual return of 11.67% CAGR, only 0.01% different from SPY’s 11.68% CAGR. In terms of risk, these two funds are again almost identical by every metric as shown below. SCHX has historically had an average standard deviation of 14.80% against 14.66% for SPY (a negligible difference of less than 0.2%). In terms of worst-year performance, the difference is also within 1% (SCHX’s -24.7% vs SPY’s -23.9%).
Source: Seeking Alpha Data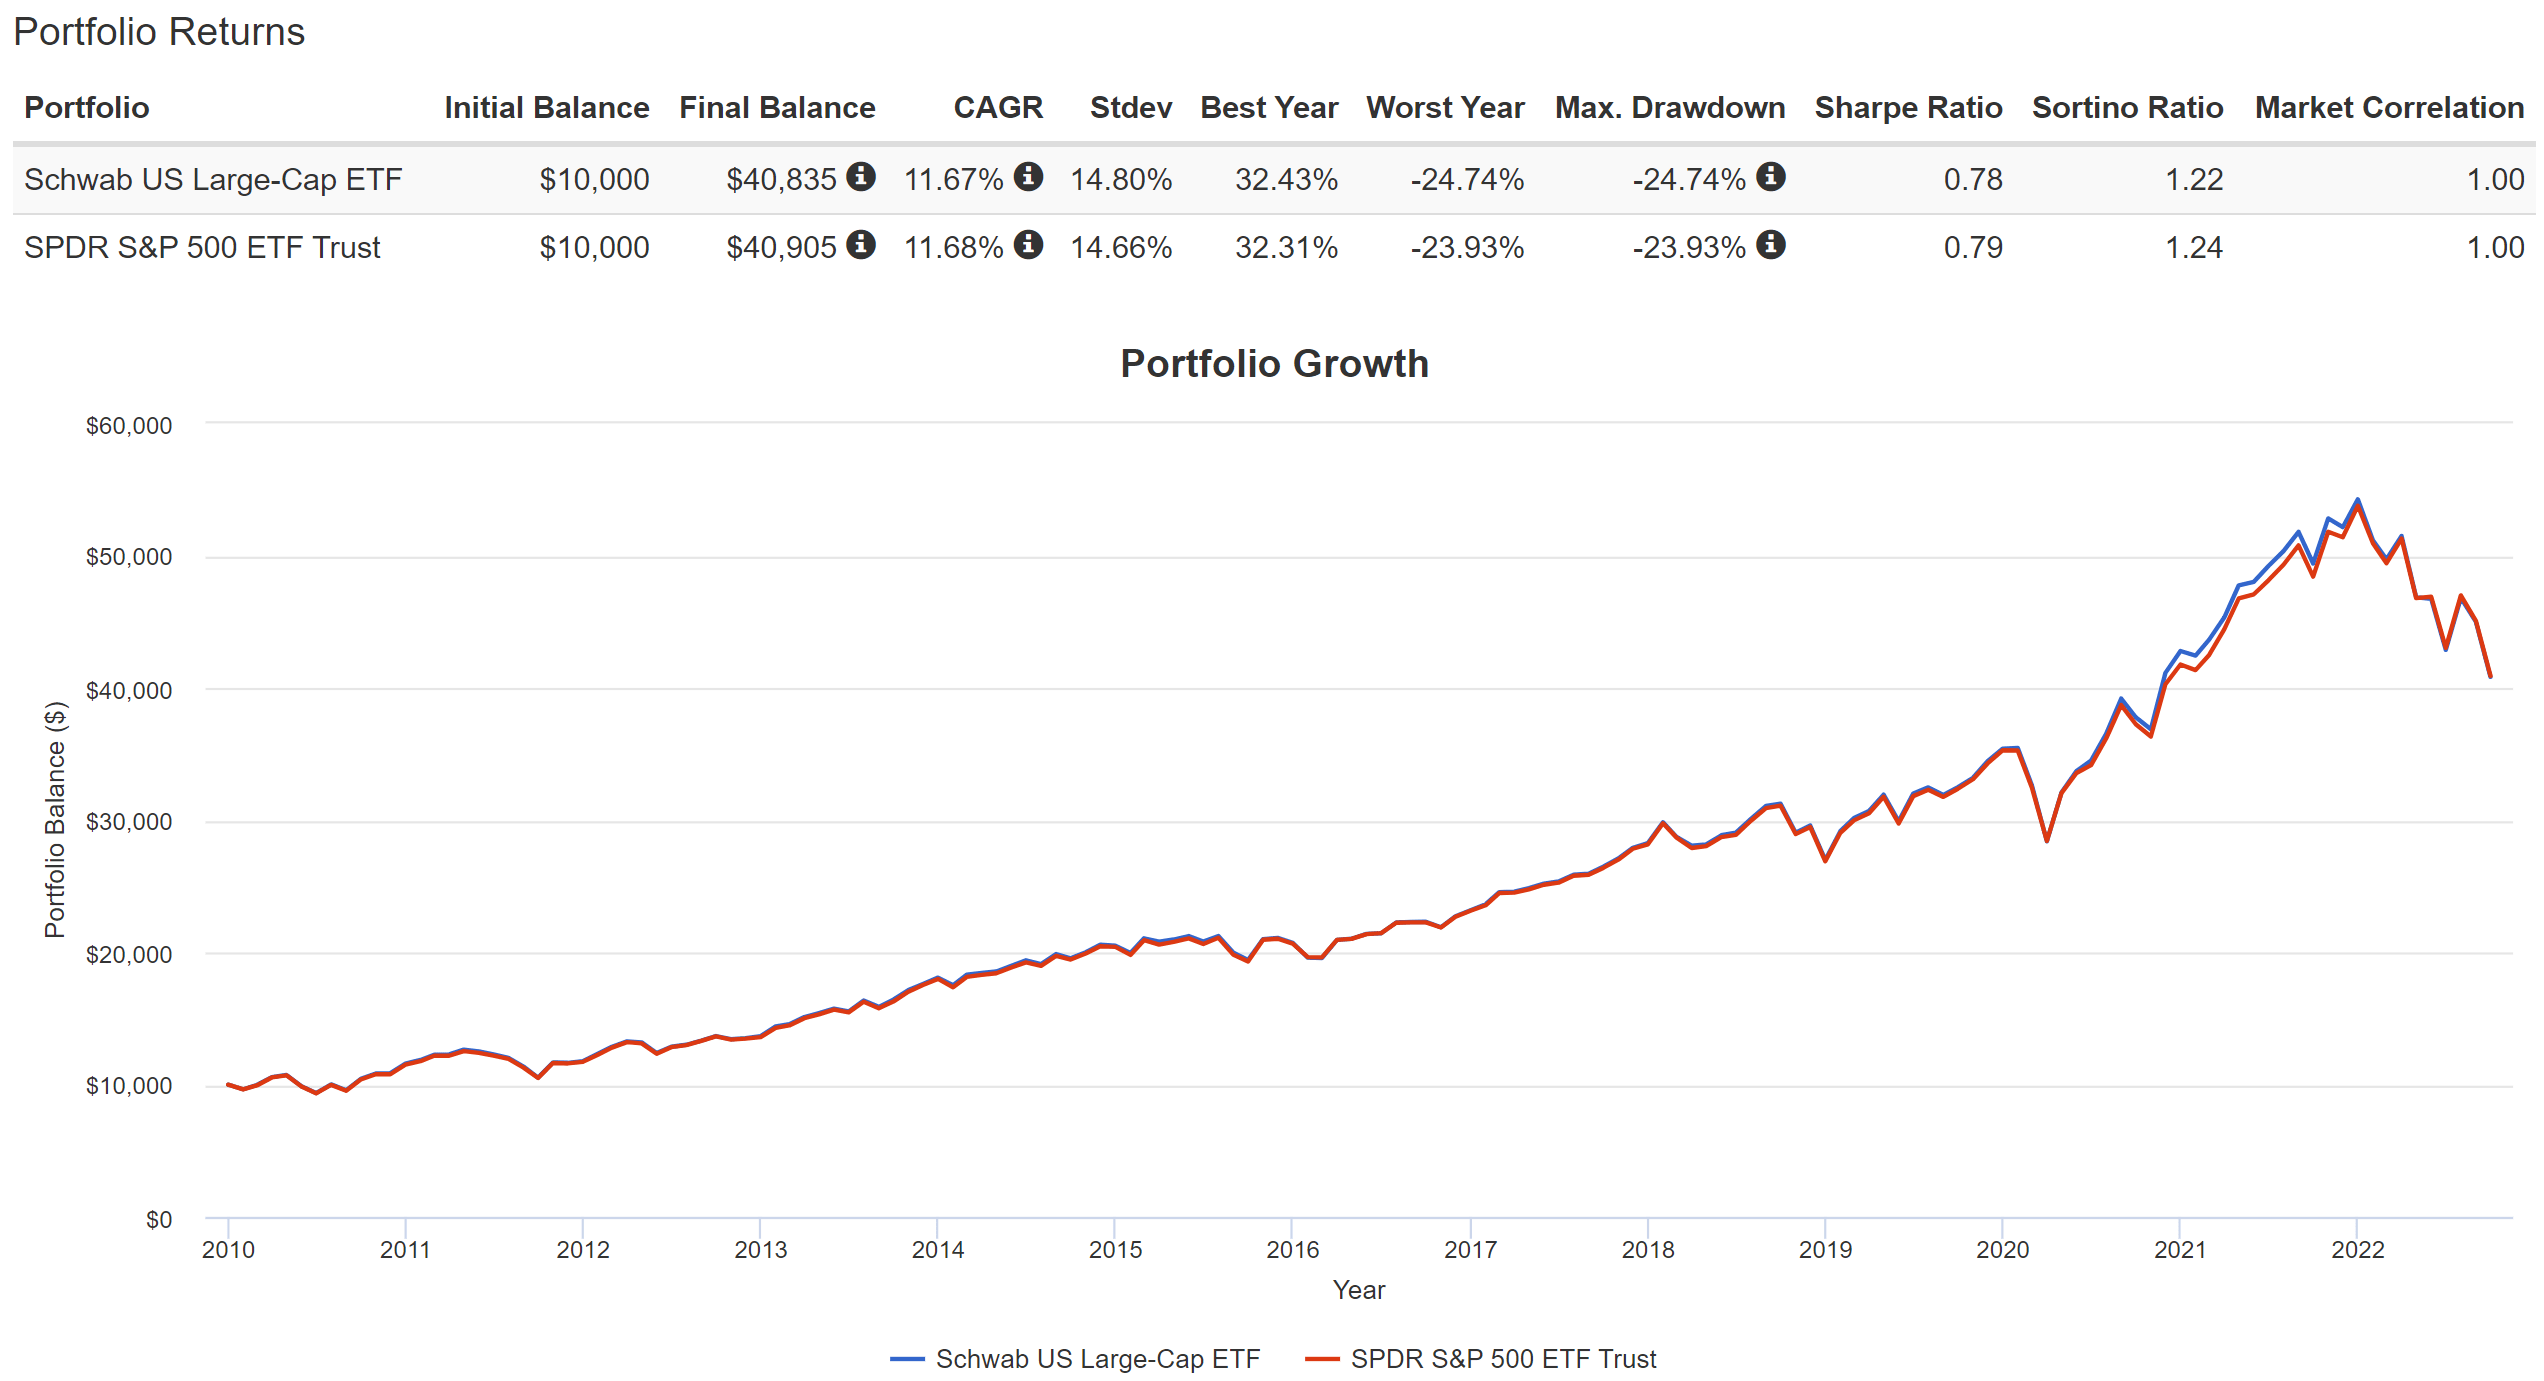
But very occasionally, a bigger divergence occurs. And now is such a time. With the turbulence in the equity market, both funds have suffered large corrections this year (after all, most of their underlying holdings are identical as to be seen later). However, the corrections they suffered are different by about 1.05%, as seen from the chart below. To wit, SCHX has lost 20.24% off its high, compared to SPY’s 19.19%. As a result, their performance has so far deviated by more than 1% from each other (compared to the 0.01% annual CAGR difference since 2009, as just mentioned).
And in the remainder of this article, we will further examine the implications of such a divergence, based on which a few action ideas will be suggested.
Source: Seeking Alpha Data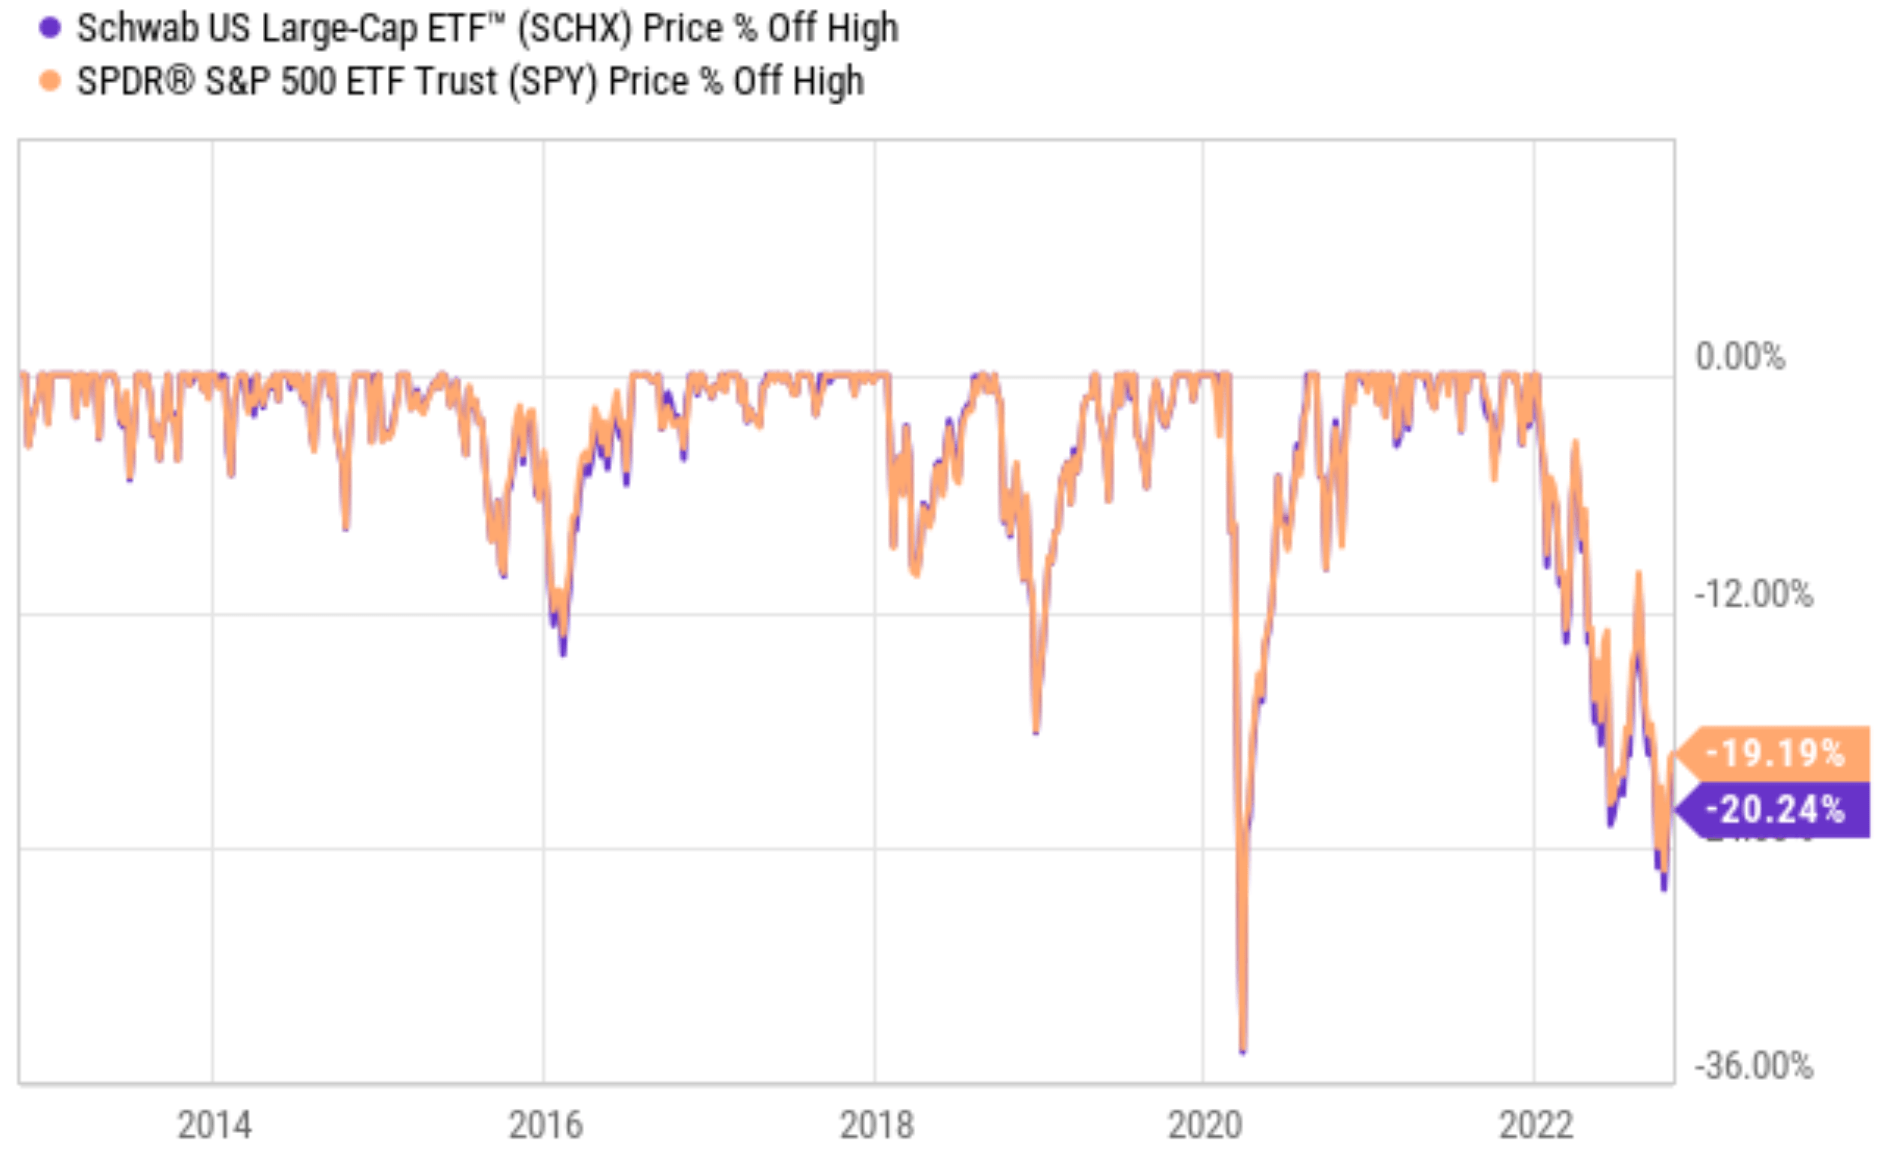
SCHX vs. SPY: Basic information
SPY needs little introduction, so here I will just highlight a few basics for SCHX. The fund is a large-cap fund tracking the Dow Jones U.S. Large-Cap Total Stock Market Index as detailed in the fund description below. As a result, SCHX holds a total of 750 stocks compared to SPY’s 500 (506 to be exact).
SCHX’s goal is to track as closely as possible, before fees and expenses, the total return of the Dow Jones U.S. Large-Cap Total Stock Market Index. The fund offers simple access to the 750 largest U.S. companies as ranked by full market capitalization.
Also, note that SCHX charges a much lower expense ratio of 0.03% compared to SPY’s 0.09%. In return, SPY is a much larger fund and offers better tradability and tighter trading spreads. SPY boasts more than 10x AUM (assets under management) than SCHX ($364.37B vs SCHX’s $29.19B as of this writing). The average trading spread or SPY is essentially zero (about $0.01 for a price close to $400), while SCHX’s average trading spread is 0.02%.
Source: Vanguard.com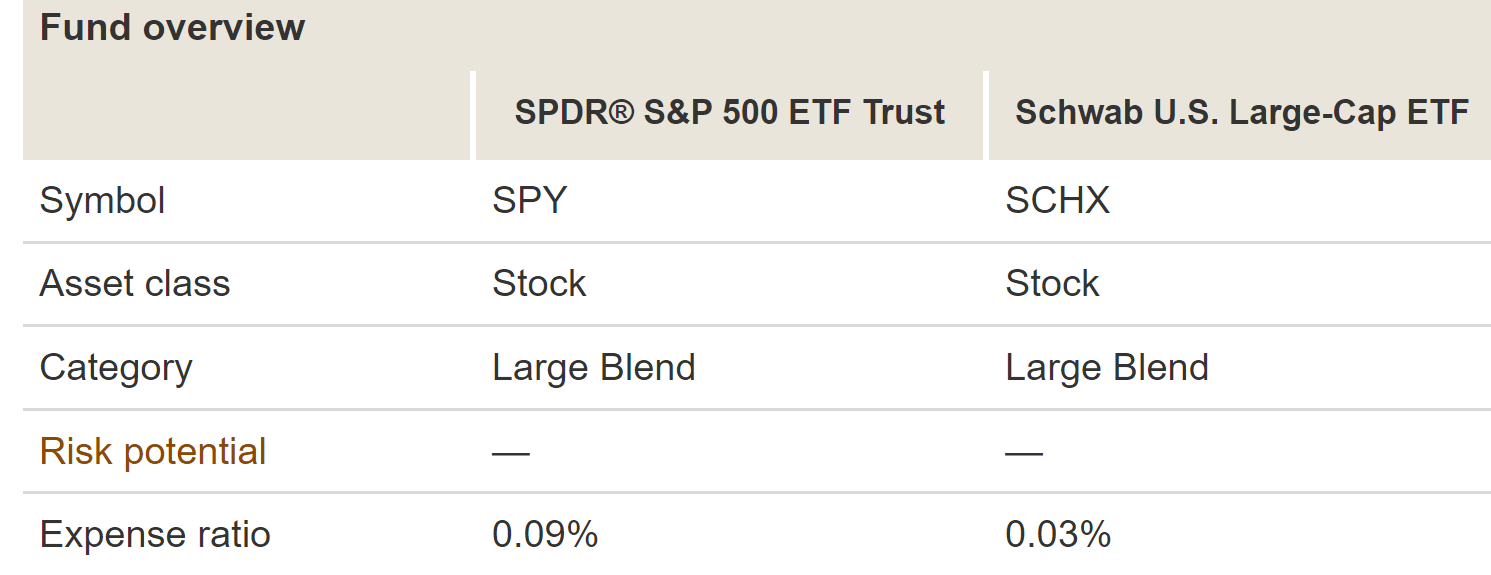
SCHX vs. SPY: A closer examination of 1.05%
In the first section, I made the argument that the 1.05% divergence this year is a bigger deal than on the surface by comparing it to the 0.01% annual CAGR difference since 2009. Here, let’s zoom in and examine the magnitude of their historical divergence more closely.
The chart below shows more granularity of their divergence in the past. As seen, on a 3-year and market price basis, SPY’s average annual return has been 8.11%. When compared to 7.91% from SCHX, the difference is only 0.2%, more than 5x lower than the 1.05% that has happened this year. On a 5-year basis, SPY outperformed SCHX by an even smaller margin of 0.12% (9.16% total return based on market prices for SPY vs 9.04% for SCHX).
Based on the above context, you can see that the 1.05% divergence that occurred recently is indeed quite large. And next, I will explore its implications in more detail.
Source: Vanguard.com data
SCHX vs. SPY: Valuation compression
The first implication involves the valuation contraction. Simply put, SCHX’s valuation is more compressed than SPY’s because of the divergence. Contraction in their valuation multiples obviously is the first direct implication. Very straightforwardly, SCHX is now trading at a more compressed valuation than SPY’s because of this relatively large divergence, as detailed in the chart below.
As you can see, the price-to-earnings ratio (“PE”) of SCHX currently stands at 17.8x, lower than SPY’s 18.0x by about 1.2%, approximately the amount of the divergence. In terms of price-to-book ratios (“PB”), SCHX’s discount is a bit larger. SCHX PB ratio is 3.3x, about 3% below SPY’s 3.4.
Source: Vanguard.com data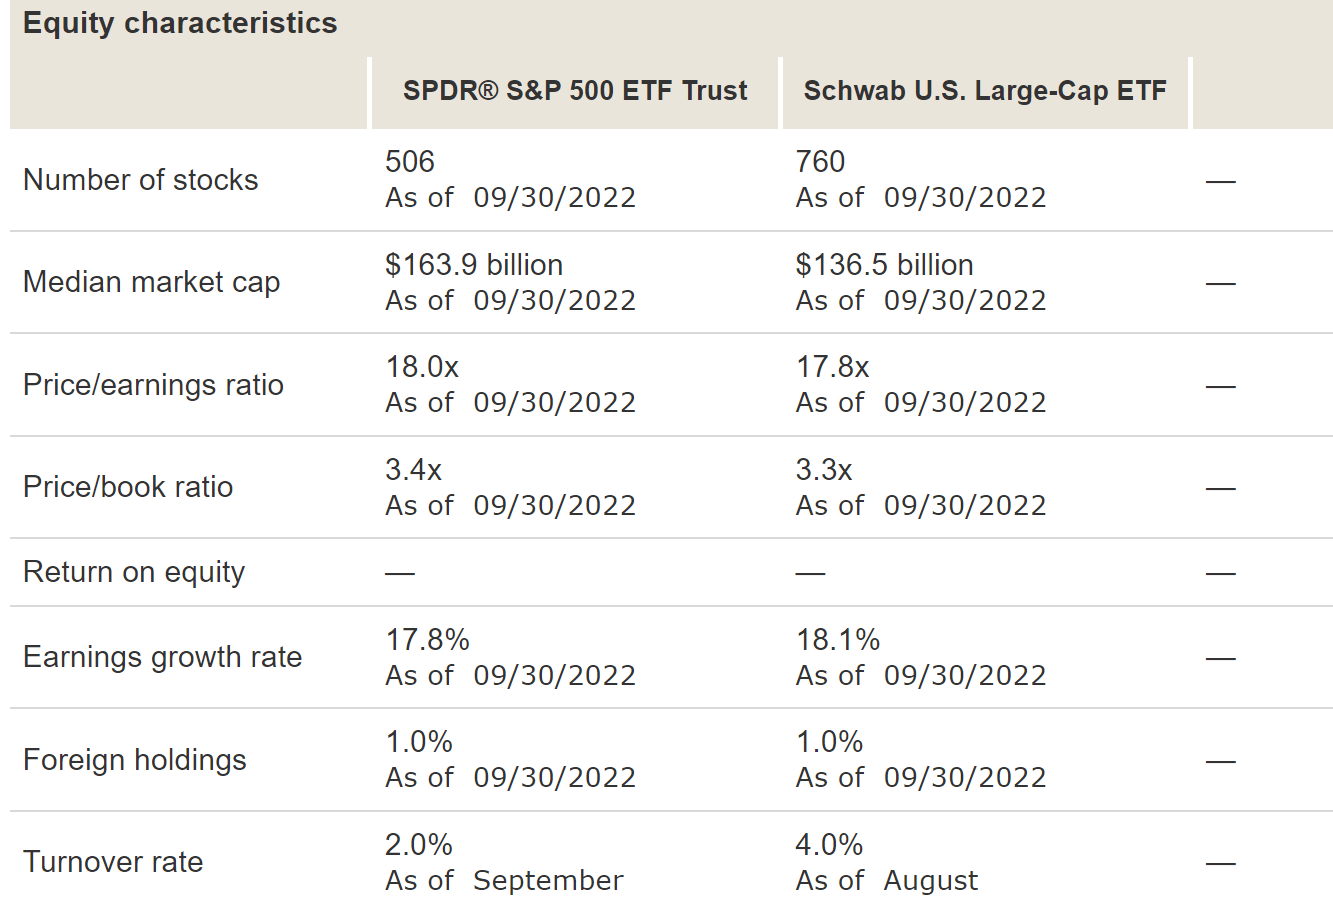
Despite the valuation discount, the holdings in the SCHX fund actually feature a better growth rate forecast, as seen. The earnings growth rate is projected to be 17.8% for SPY and 18.1% for SCHX. As a result, SPY’s PEG ratio is 1.01x and SCHX’s PEG ratio is only 0.983x.
The differences in their growth rate forecast are due to ~250 extra holdings in SCHX compared to the S&P 500 index. By the S&P 500’s standard for “large caps,” these 250 extra companies are mid-caps. As can be seen from the data below, the holdings in the S&P 500 index are currently suffering from downward earnings forecast adjustment now. The forward operating earnings per share forecast for SPY as of Oct 20 was 222.14, but it was then downward adjusted to 221.27 as of Oct 27, a downward adjustment of 0.4% in one week. In contrast, the S&P mid-cap 400’s operating earnings per share forecast have been adjusted upward from 192.32 as of Oct 20 to 192.71 as of Oct 27.
Source: www.yardeni.com data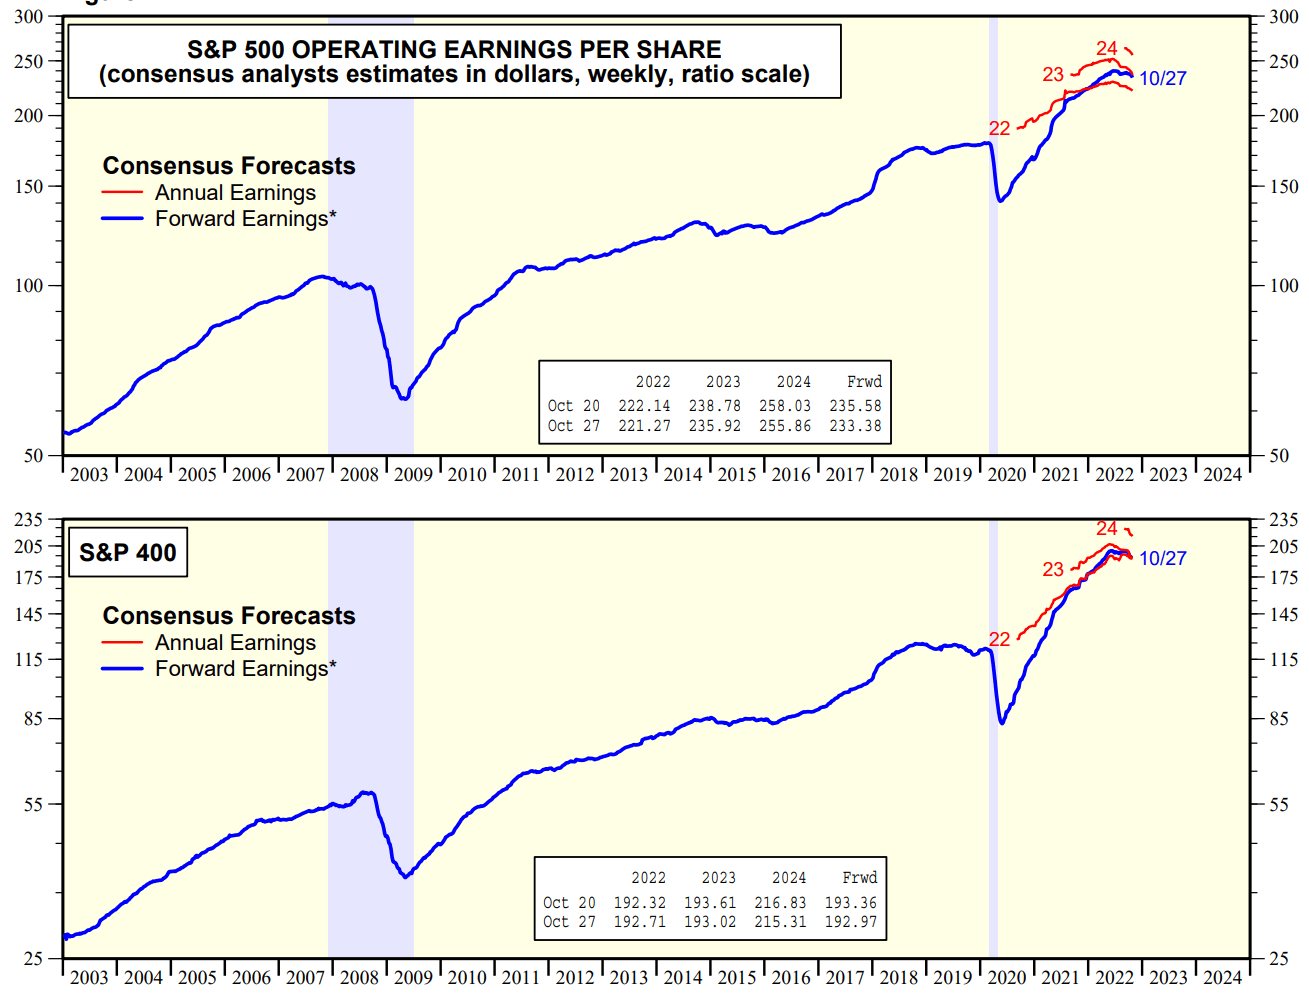
Other considerations and some actionable ideas
SCHX is also more tax efficient than SPY. As an example, the following chart shows that SPY outperformance (or performance) has been partially canceled off by tax headwinds in the past. If you recall from an earlier chart, on a 3-year and market price basis, SPY’s average annual return before taxes has been 8.11% and SCHX’s has been 7.91%, a small lag of 0.2%. And on a 5-year and pretax basis, SPY outperformed SCHX by an even smaller gap of 0.12% (9.16% for SPY vs 9.04% for SCHX).
Then, as you can see from the following chart, the annual total return after taxes on distributions and sale of fund shares has been 5.98% for SPY in the past 3 years, compared to 5.93% for SCHX. So SPY’s lead on a 3-year basis narrowed from 0.2% pretax to 0.05% after taxes. Similarly, in the past 5 years, the annual total return after taxes has been 6.94% for SPY, compared to 6.93% for SCHX. So SPY’s lead on a 5-year basis narrowed from 0.12% pretax to 0.01% after taxes.
Source: Vanguard.com data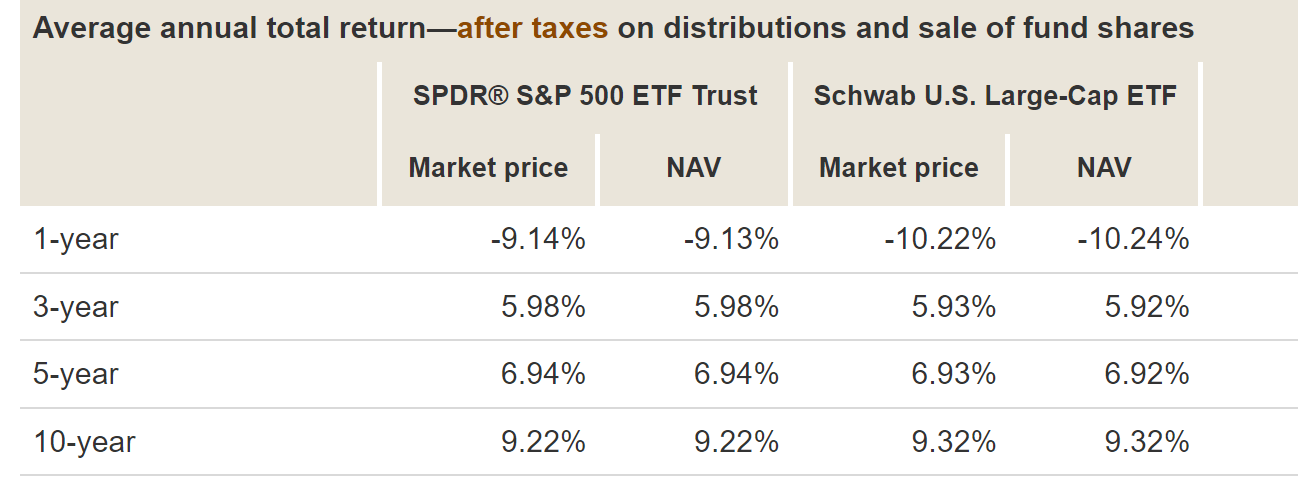
A few actionable ideas. Again, we see SCHX as a more attractive fund under current conditions due to its more compressed valuation and better growth prospects. Of course, its attractiveness is brought about by the extra 250 holdings that are considered mid-cap by the SP standard. As a result, more aggressive investors could consider holding a mid-cap sector fund directly, such as Vanguard Mid-Cap ETF (VO) or Schwab U.S. Mid-Cap ETF (SCHM). As seen in the charts below, S&P 400 mid-cap is currently valued at 12.6x FW P/E. It is a considerable 25% discount compared to the 16.7x FW P/E for the S&P 500 large caps. Furthermore, it is almost at the same level as the bottom valuation amid the height of the COVID panic sale. And before the COVID crash, an FW P/E of 16.7x has only occurred 2 times before since 1999 as seen: during the 2008 great recession, and briefly in 2011 during the European financial crisis.
Source: www.yardeni.com data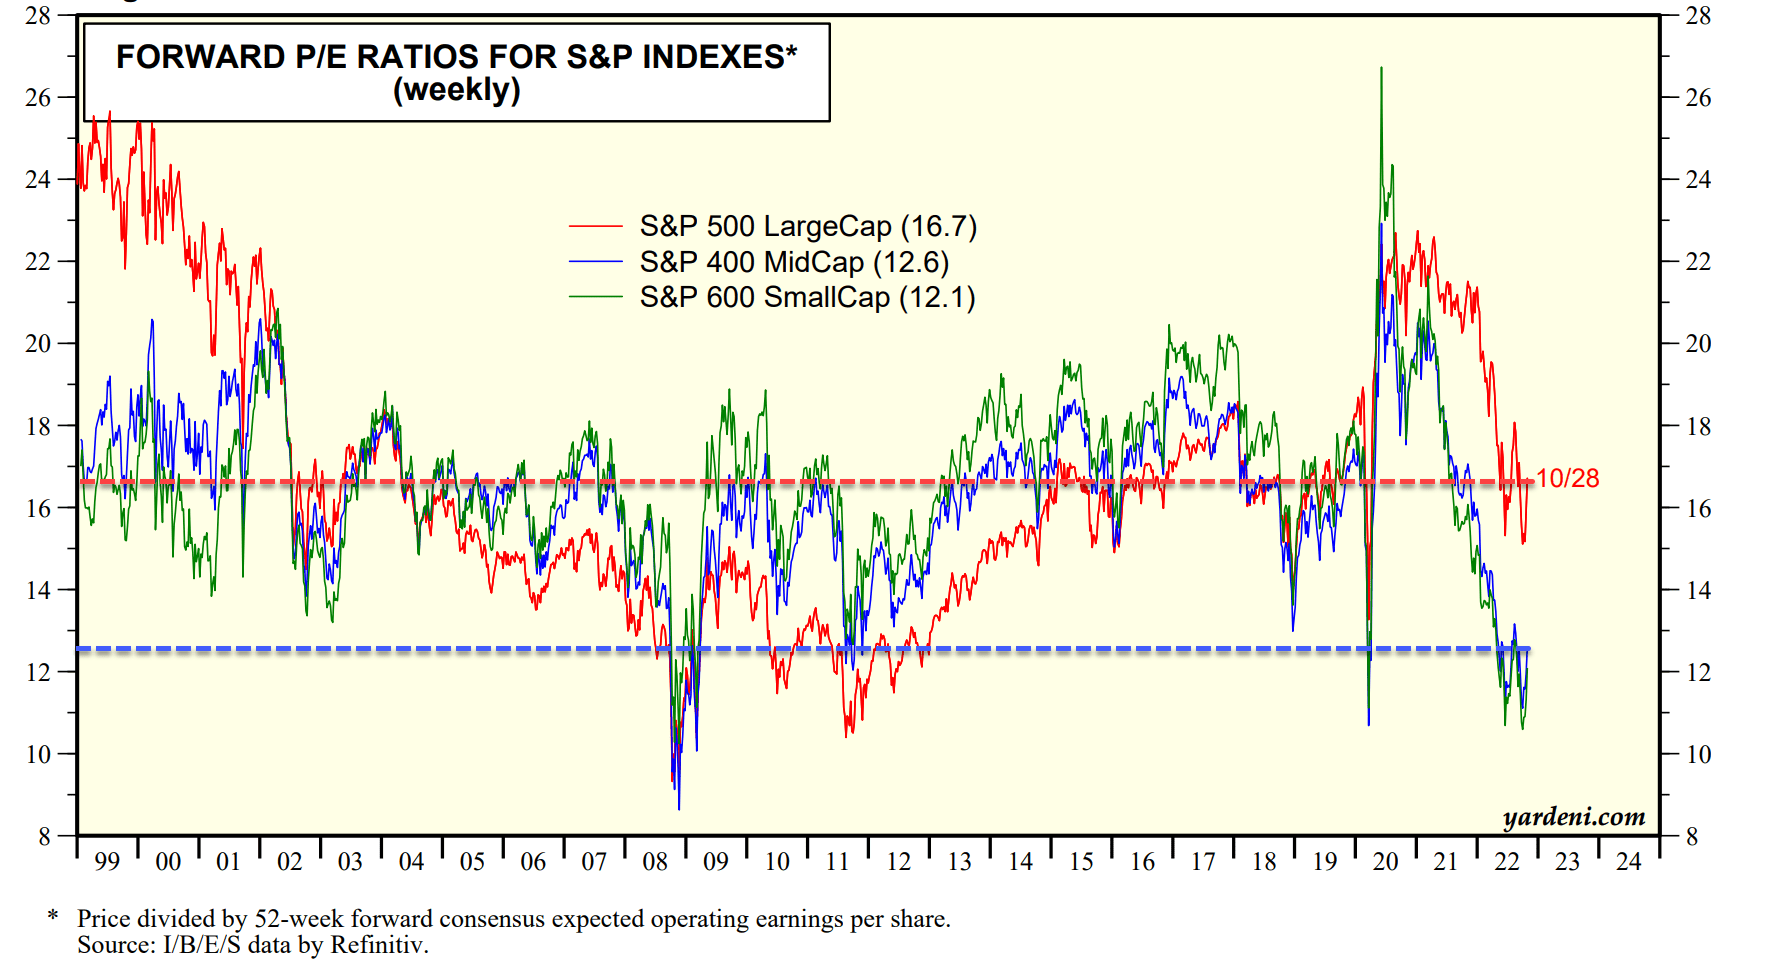
Risks and final thoughts
Given their market-fund nature, the risks associated either with SCHX or SPY are essentially the same macroeconomic risks associated with the economy. And plenty of other Seeking Alpha authors have discussed these risks already. Here I will point out one risk that is specific to SCHX. By holding more than 750 companies, SCHX is more diversified than SPX, but the additional diversification comes at the cost of holding small companies. To wit, the median market cap in the SPY fund is $163.9 billion, about 20% larger than the median market cap of $136.5 billion in the SCHX fund. Large size correlates positively to safety, as reflected in the larger (although slightly) volatility risks SCHX has demonstrated in the past.
To conclude, SCHX and SPY offer nearly identical performance and risks most of the time with a few exceptions. And right now represents just such an exception. SCHX now offers a more attractive valuation and higher growth forecast. Furthermore, SCHX also charges a lower fee of 0.03% compared to 0.09% from SPY. And the difference of 0.06% is actually not as small as it seems on the surface considering that the performance difference between these two funds is usually within 0.1% over a timeframe of a few years. The attractiveness of SCHX is, of course, brought about by the 250 or so holdings that are considered mid-cap by S&P standards. As a result, more aggressive investors could consider a concentrated bet on a mid-cap fund. Take the S&P 400 mid-cap as an example, its 12.6x FW PE is among the 4th lowest valuation since 1999.
Be the first to comment