


JulNichols/iStock via Getty Images
Investment Thesis
The purpose of today’s article is to evaluate the Schwab U.S. Mid-Cap ETF (NYSEARCA:SCHM) on its strategy, track record, and fundamentals compared to its peers. SCHM’s strengths include a category-leading 0.04% expense ratio and an impressive $9 billion in assets management. However, it sacrifices profitability, valuation, and earnings momentum compared to several of its peers, including the iShares Core S&P MidCap ETF (IJH). Given their similarities in performance and expenses, I think it’s only fair for these metrics to act as the tiebreaker. Therefore, I don’t recommend investors buy SCHM, and I look forward to explaining why in greater detail next.
ETF Overview
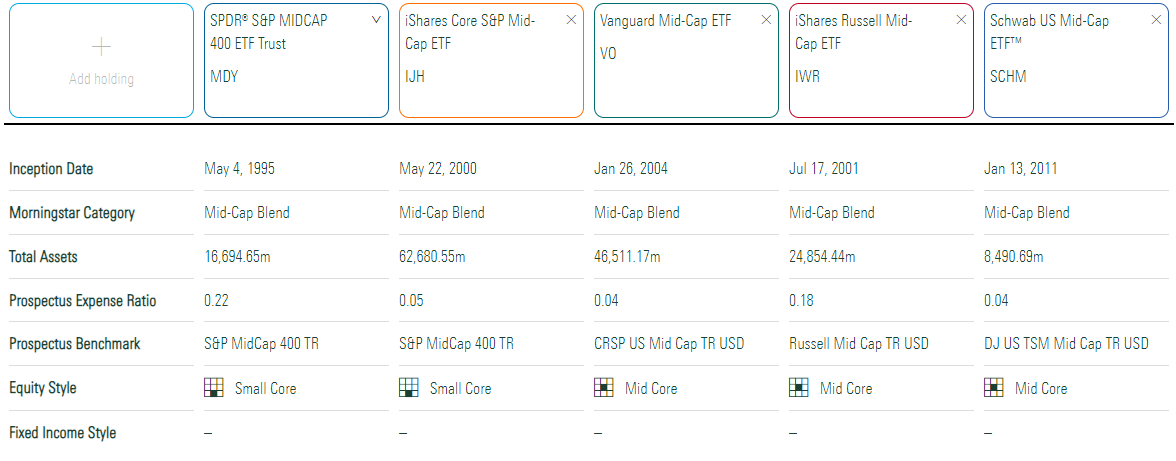
SCHM tracks the Dow Jones U.S. Mid-Cap Total Stock Market Index, selecting 500 mid-cap stocks based on total market capitalization and weighting them by free-float market capitalization. The Index, along with other U.S. Size Segment Indexes, reconstitutes in September and rebalances quarterly, with a reference date five weeks before the effective date. Buffer rules apply, but all things considered, it’s a pretty straightforward strategy.
Schwab was a bit late to the game with SCHM, given how it only launched on January 13, 2011. More established ETFs like the SPDR S&P MidCap 400 ETF Trust (MDY) and the iShares Core S&P MidCap ETF have been around since May 1995 and May 2000, respectively. They both track the same Index. Meanwhile, the Vanguard Mid Cap ETF (VO) and the iShares Russell Mid-Cap ETF (IWR) are other reasonably low-cost options with high AUM.
Morningstar
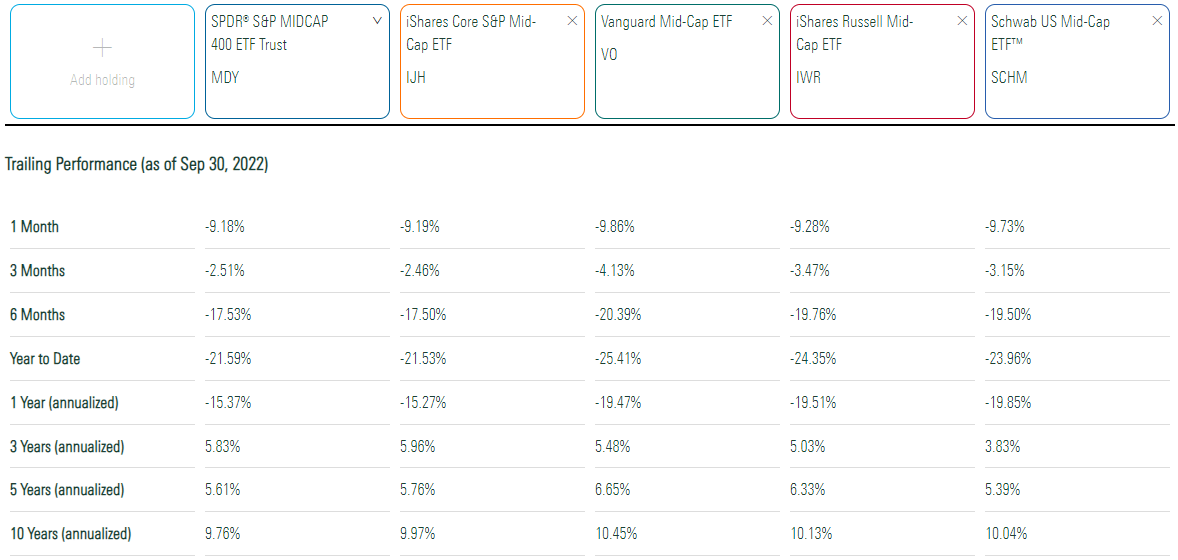
Through September 30, 2022, SCHM has returned an annualized 5.39% and 10.04% on a five- and ten-year basis. The ten-year figure is average, ranking ahead of MDY and IJH but behind VO and IWR. However, the more recent periods are less favorable.
Morningstar
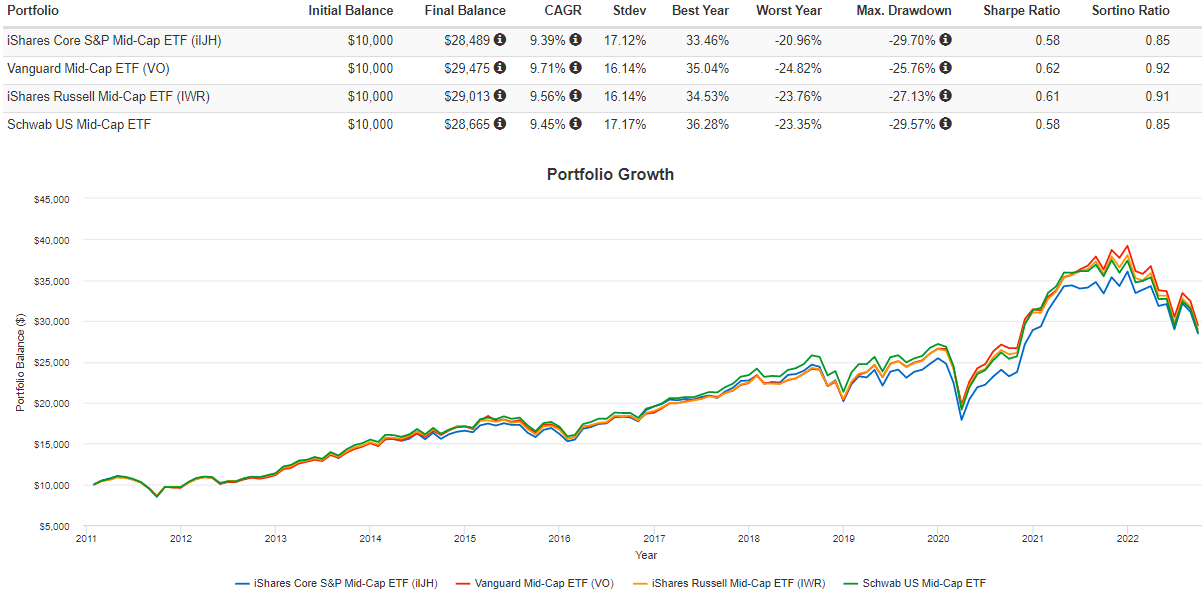
Finally, readers can consider SCHM’s returns and volatility since its inception. The following graph shows that SCHM gained an annualized 9.45%, or 0.06% better than IJH, with almost identical volatility. However, it’s trailed VO and IWR by 0.26% and 0.11% per year, despite these ETFs experiencing lower volatility.
Portfolio Visualizer
With such close results all around, it’s difficult to say which one is the best. Therefore, I will rely on an analysis of each ETF’s fundamentals to determine which one is in the best shape today.
ETF Analysis
Sector Exposures and Top Holdings
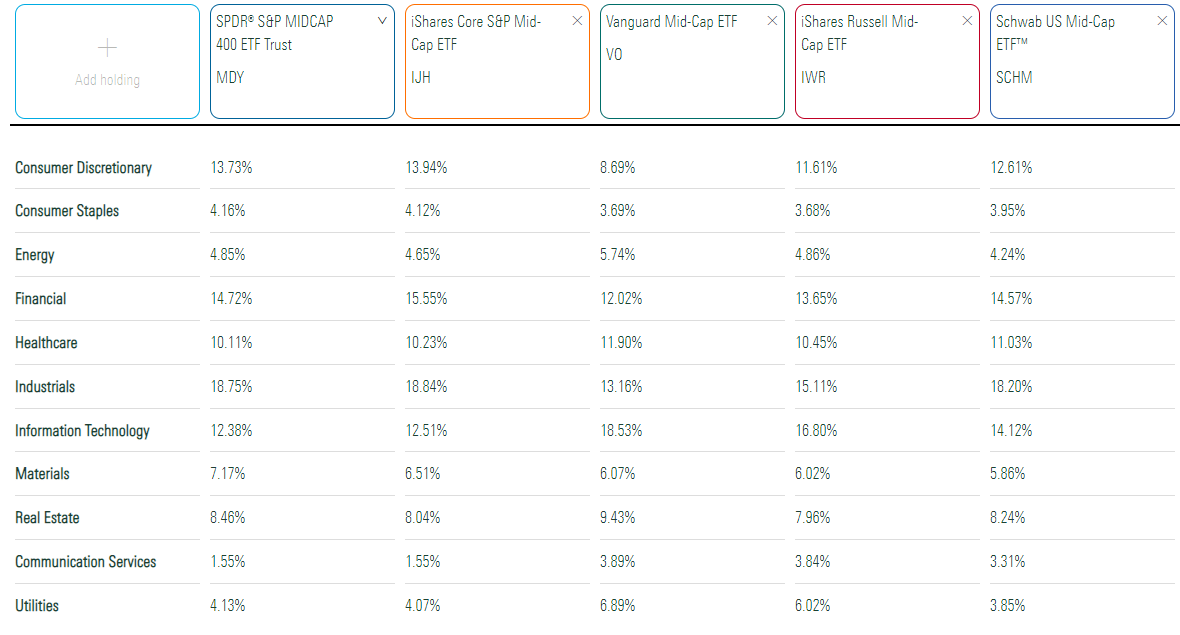
Morningstar has nice side-by-side comparisons of all funds’ GICS sector exposures. As expected, there’s not much difference, but SCHM seems to be the most balanced. It has neither the most nor least exposure to any sector relative to these four peers. VO has the highest exposure to Technology stocks at 18.53%, which likely explains its superior performance described earlier. Given the changing stock market conditions, this higher exposure may prove to be a liability going forward.
Morningstar
SCHM’s top ten holdings only account for 13.76% of the ETF because there are no “mega-mid-cap” stocks that can make it overconcentrated. In such instances where companies’ market capitalizations grow exponentially, they graduate to a large-cap Index. You’ll find this to be almost universally true in the mid-cap space. The key exceptions are the Invesco Russell Midcap Equal Weight ETF (XMHQ) and the Oppenheimer S&P MidCap 400 Revenue ETF (RWK), which have about 77% and 48% of assets in the top 50 holdings. These factor ETFs have higher fees but have done quite well over the last decade and are worth considering if you aren’t concerned with higher volatility.
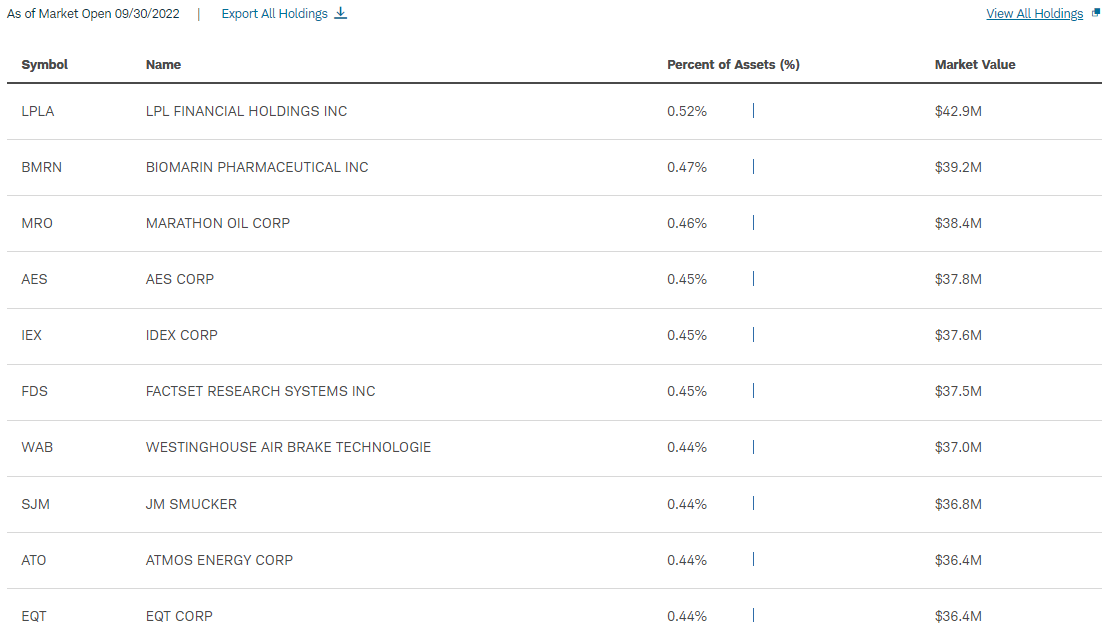
Schwab
Fundamentals vs. Peers
The following table highlights SCHM’s fundamentals for its top 25 industries. Since I don’t cover mid-cap ETFs often, I’ve also included the same metrics for IJH, VO, IWR, and RWK. I think this table helps illustrate how SCHM is a reasonably safe but ultimately average choice. Have a scan through, and I’ll offer my thoughts afterward.
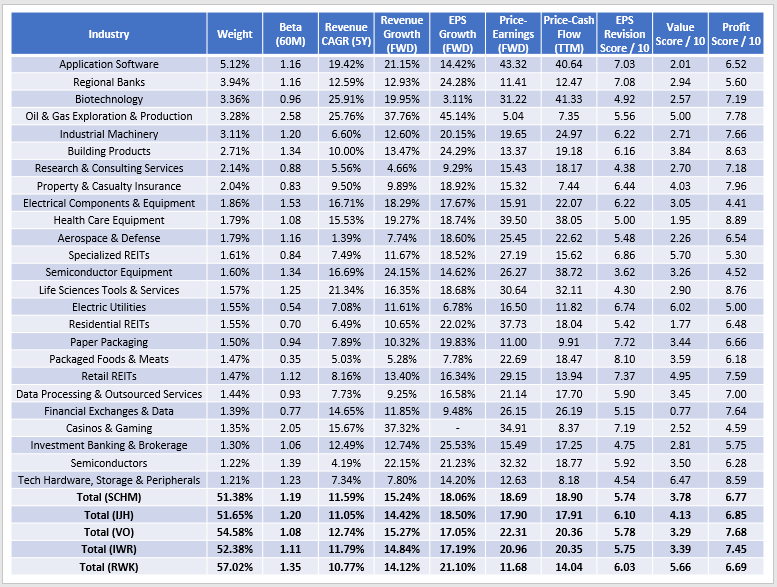
The Sunday Investor
First, SCHM, like most mid-cap ETFs, has above-average volatility, as indicated by its 1.19 five-year beta. For those wanting to play it safer, VO and IWR are better options, while RWK is the riskiest. RWK’s annualized standard deviation since January 2011 is 3% more than SCHM.
Second, there’s little difference in concentration at the industry level for all five ETFs, ranging between 51-57%. Some investors may prefer IWR because it has over 800 holdings, but those additions do little for diversification.
Third, I would rate SCHM’s historical and estimated 11.59% and 15.24% sales growth slightly above average, but it’s nothing significant. SCHM offers 18.06% estimated earnings growth and trades at 18.69x forward earnings, close to the 1:1 ratio growth-at-a-reasonable-price investors often seek. However, I’d note that IJH offers a slightly better combination (18.50% and 17.90x) and has a better overall Seeking Alpha Value Score of 4.13, which I’ve normalized on a scale of 1-10. VO and IWR offer a worse combination of earnings growth and valuation. Meanwhile, RWK is the classic deep-value play that looks great on paper if you can handle added volatility and believe markets are in an uptrend.
There are a few other differences I think investors should consider, including the metrics presented on profitability and analyst earnings revisions. SCHM’s profitability score is only 6.77 / 10, the lowest of the five choices. Its EPS Revision Score indicates the frequency and degree of analyst earnings estimates revisions and is also on the low side at 5.74 / 10. I place a lot of importance on these scores because of the degree of uncertainty in the markets. I don’t think it’s the time to be speculating much about low-profitable stocks that analysts aren’t confident in.
Investment Recommendation
SCHM has amassed $9 billion in assets under management in just over a decade, at least in part because of its category-leading 0.04% expense ratio. Its track record is respectable compared to other leading funds like MDY, IJH, VO, IWR, and RWK. However, I don’t think it’s the best choice in the mid-cap blend category. Other ETFs, particularly IJH, have similar volatility but better fundamentals, including higher earnings growth, lower valuation, and better profitability and earnings revision scores. I believe IJH is the most balanced ETF based on fundamentals, and readers should choose it over the cheaper SCHM. Thank you for reading, and I look forward to discussing this further in the comments section below.
Be the first to comment