

Ayvan/iStock via Getty Images
This article was coproduced with Dividend Sensei.
Over 5,000 stocks are trading on U.S. exchanges, and globally there are nearly 700,000 stocks from which investors may choose.
While many love this kind of choice, many investors feel overwhelmed at times, thus the popularity of index funds.
When Brad asked me for my favorite “one dividend stock to rule them all” recommendation, I realized this was a great opportunity to highlight one of my favorite core holding ideas.
In other words, if I could own just one dividend stock for the rest of my life, a buy-and-hold forever world-beater blue-chip, it would have to check off many important boxes.
- supreme safety and quality
- generous, very safe, and steadily growing yield
- wide and stable moat with exceptional risk management
- very attractive valuation (and it rarely becomes overvalued)
- world-beater blue-chip quality
- effectively a “risk-free” stock investment that you can buy and hold forever, in all economic and market conditions
- strong long-term growth prospects for great total returns
- a history of industry-leading total returns.
This is a tall order to fill, but fortunately, there is one high-yield blue chip that easily checks all these boxes.
Let me show you the five reasons why if I had to own just one stock for the rest of my life, Schwab U.S. Dividend Equity ETF (NYSEARCA:SCHD) would be it.
Obviously, no one MUST own just one stock forever, but this is one of the best core holdings you can buy to build the Ultra SWAN (Sleep Well At Night) retirement portfolio of your dreams.
Reason One: An Investment Strategy You Can Trust
There are several reasons why SCHD, an exchange-traded fund (“ETF”), is my favorite “buy and hold forever” single-security solution for income investors.
The first is the way this portfolio is constructed.
The index universe uses the Dow Jones US Broad Market Index, excluding REITs, which contained 2,524 stocks as of September 30, 2022. Then the US Dividend 100 index applies an initial filter to bring this extensive list of stocks to a manageable number of several hundred. The three initial screeners are:
- Minimum of ten consecutive years of dividend payments.
- Minimum Float Adjusted Market Capitalization of US$500 million.
- Minimum three-month Average Daily Volume of Trading of US$2 million.
The primary screening criteria apply safety and quality metrics, so that the companies in SCHD have dependable dividends, specifically ten years of consecutive dividend payments, sufficient size, and good liquidity.
Next, the stocks are ranked on four fundamentals.
- Free cash flow to total debt, defined as annual net cash flow from operating activities divided by total debt. Companies with no debt are ranked first.
- Return on equity, defined as annual net income divided by total shareholders’ equity.
- Estimated Dividend yield
- 5-year dividend growth rate, defined as the dividend rate for the prior year divided by the average dividend rate for the last five years, minus one.
So the SCHD dives deeper into quality, focusing on strong balance sheets, good profitability, and strong dividend yields. Not just high current yields, but high and growing dividends, which is another vital sign of quality according to Ben Graham.
The top 100 ranked stocks are selected to be part of the index with the following three buffer rules that favor current constituents:
- Constituent stocks will remain in the index so long as they rank in the top 200 based on the composite score.
- Non-constituent stocks are added to the index until the constituent count reaches 100.
- If two non-constituent stocks have the same composite score, the stock with the higher IAD yield will be selected first.
SCHD’s portfolio construction rules are straightforward, comprehensive, reasonable, and prudent.
- Despite the comprehensive screening criteria, the buffer rules result in a modest 46% annual turnover
- Helps with tax efficiency
Is it any wonder that Morningstar rates SCHD 5-star silver? This indicates industry-leading historical returns and an excellent investment strategy.
“This fund’s focus on fundamentals promotes durable yield, as stocks on firm financial footing are well-positioned to continue dividend policies. It also allows the fund to tap into the quality factor, historically tied to market-beating performance.
The fund’s profitability measures, like return-on-invested capital, comfortably exceed the Russell 1000 Value Index, its category benchmark. Dividend-oriented companies with healthy balance sheets tend to be more insulated from the market’s movements, so this fund usually strikes a defensive stance.” – Morningstar.
Ultra SWAN Quality Is What You Want In A Buy and Hold Forever Core Portfolio Position
SCHD is both a concentrated portfolio and highly diversified.
- Top 10 holdings are 41% of the portfolio
Morningstar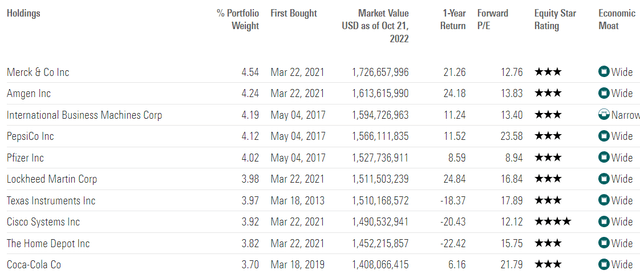
These top 10 holdings are chock full of Ultra SWANs, dividend champions, kings, and future aristocrats like MRK, AMGN, PEP, LMT, TXN, CSCO, HD, and KO.
- A-rated companies with 2.5% or less fundamental risk
- The risk of all ten failing simultaneously is effectively zero
The remaining holdings are a who’s who of quality and dependable dividends, including some of our favorite midstream names like OKE and deep value high-yield DK recommendations like 3M, VZ, and TROW.
Morningstar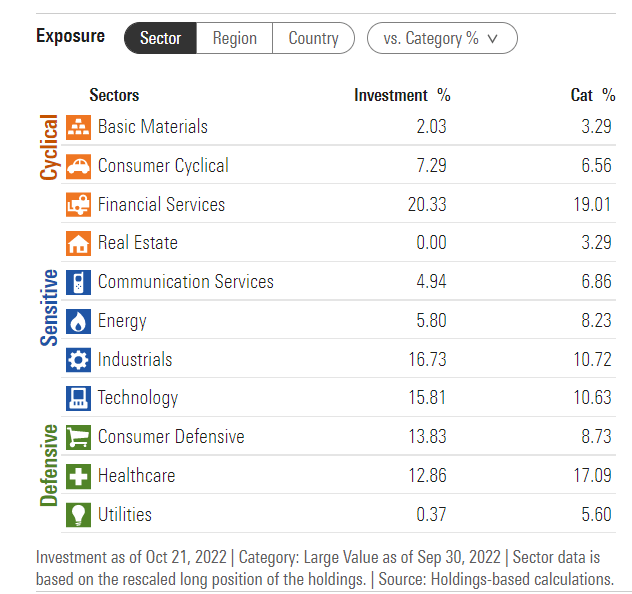
Per its rules, this portfolio has no REITs but offers exposure to 10/11 sectors.
By Morningstar’s analysis, this is one of the widest moat portfolios you can buy, with 85% wide and deep moat.
The companies offer impeccable balance sheets and strong profitability, including 22% returns on capital and free cash flow margins of 15%.
- 3x compared to average quality companies (5% FCF margins)
The dividend payout ratio is 49%, well below the 60% safety guideline of rating agencies.
- The S&P’s historical payout ratio is 40% to 60%, and the average dividend cut in historical recessions is 2% at these levels
But supreme quality and safety are the first reason I’m so bullish on SCHD, and I consider it the ultimate “single stock buy and hold forever high-yield solution.”
Reason Two: Exceptional Long-Term Income And Total Return Potential
What kind of returns can SCHD potentially deliver in the coming decades?
|
Investment Strategy |
Yield |
LT Consensus Growth |
LT Consensus Total Return Potential |
LT Risk-Adjusted Expected Return |
LT Inflation And Risk-Adjusted Expected Returns |
Years To Double Your Inflation & Risk-Adjusted Wealth |
10-Year Inflation And Risk-Adjusted Expected Return |
|
Safe Midstream |
6.1% |
6.4% |
12.5% |
8.8% |
6.5% |
11.1 |
1.87 |
|
REITs |
3.9% |
6.1% |
10.0% |
7.0% |
4.7% |
15.2 |
1.59 |
|
Schwab US Dividend Equity ETF |
3.8% |
8.5% |
12.3% |
8.6% |
6.3% |
11.4 |
1.84 |
|
Dividend Aristocrats |
2.8% |
8.7% |
11.5% |
8.1% |
5.8% |
12.5 |
1.75 |
|
60/40 Retirement Portfolio |
2.3% |
5.1% |
7.4% |
5.2% |
2.9% |
24.7 |
1.33 |
|
S&P 500 |
1.8% |
8.5% |
10.3% |
7.2% |
4.9% |
14.6 |
1.62 |
|
Nasdaq |
0.8% |
11.5% |
12.3% |
8.6% |
6.3% |
11.4 |
1.85 |
(Sources: Morningstar, FactSet, Ycharts)
SCHD yields nearly 4%, one of the highest yields among blue-chip ETFs.
Its 8.5% CAGR consensus growth rate is on par with that of the S&P 500 and Dividend Aristocrats, but it offers a far higher starting yield.
SCHD’s long-term consensus 12.3% CAGR is better than both the Aristocrats and S&P 500, and is on par with the growth-focused Nasdaq.
What evidence is there that SCHD can consistently deliver 12% to 13% returns over the long term?
Reason Three: Historical Returns That Put Its Peers To Shame
It’s great that analysts think SCHD can deliver long-term returns that are 1% better than the Aristocrats, 2% better than the S&P 500, and on-par with the Nasdaq. But how realistic is that? Pretty realistic.
Historical Returns Since November 2011 (Inception)
Portfolio Visualizer Premium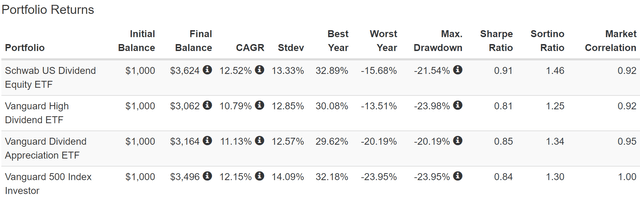
SCHD’s historical returns over the past 11 years are slightly superior to its other gold-standard dividend ETF peers like VYM and VIG (both of which are highly recommended in our ETF tracker), at 12.5% CAGR.
- Just as analysts expect over the long-term.
SCHD is one of the few dividend ETFs to beat the S&P 500 during one of the hottest bull markets in US history.
Its negative-volatility-adjusted total returns (Sortino Ratio) are the best of its peers and slightly better than the S&P 500.
99th Percentile Returns Over The Last 10 Years
For the last ten years, just eight ETFs have managed to deliver superior returns to SCHD, and in the previous five years, just 11.
- SCHD is in the top 1% of its peers.
SCHD’s rolling returns are consistently excellent, with 12.5% to 15% annual returns, slightly better than its lower-yielding Vanguard cousins.
SCHD has delivered relatively low volatility on its way to those exceptional top 1% returns. Consider its returns during the 2022 stagflation bear market:
- Nasdaq: -35% peak decline
- S&P: -28%
- 60/40: -21%
- SCHD: -16%.
For a non-hedged portfolio, SCHD has done a great job of helping long-term high-yield income investors sleep well at night in all economic and market conditions.
Inflation-Adjusted Consensus Total Return Potential: $1,000 Initial Investment
|
Time Frame (Years) |
8.0% CAGR Inflation-Adjusted S&P 500 Consensus |
9.2% Inflation-Adjusted Aristocrat Consensus |
10% CAGR Inflation-Adjusted SCHD Consensus |
Difference Between Inflation-Adjusted SCHD Consensus And S&P Consensus |
|
5 |
$1,468.65 |
$1,553.50 |
$1,612.71 |
$144.06 |
|
10 |
$2,156.93 |
$2,413.37 |
$2,600.82 |
$443.90 |
|
15 |
$3,167.77 |
$3,749.18 |
$4,194.37 |
$1,026.60 |
|
20 |
$4,652.33 |
$5,824.36 |
$6,764.29 |
$2,111.96 |
|
25 |
$6,832.64 |
$9,048.16 |
$10,908.82 |
$4,076.18 |
|
30 (retirement time frame) |
$10,034.74 |
$14,056.34 |
$17,592.74 |
$7,557.99 |
|
35 |
$14,737.50 |
$21,836.56 |
$28,371.93 |
$13,634.43 |
|
40 |
$21,644.21 |
$33,923.16 |
$45,755.63 |
$24,111.42 |
|
45 |
$31,787.72 |
$52,699.72 |
$73,790.44 |
$42,002.72 |
|
50 |
$46,684.97 |
$81,869.16 |
$119,002.38 |
$72,317.41 |
|
55 |
$68,563.78 |
$127,183.97 |
$191,916.01 |
$123,352.23 |
|
60 (investing lifetime) |
$100,696.06 |
$197,580.66 |
$309,504.36 |
$208,808.31 |
|
100 (institutional time frame, multi-generational wealth) |
$2,179,486.17 |
$6,702,560.00 |
$14,161,566.50 |
$11,982,080.33 |
(Source: DK Research Terminal, FactSet)
Over 30 years, 2% better returns than the S&P 500 can add to significantly better returns, including a potential 18x inflation-adjusted growth of your wealth.
Over an investing lifetime, it could result in life-changing 310x real returns.
|
Time Frame (Years) |
Ratio Inflation-Adjusted SCHD Consensus/Aristocrat Consensus |
Ratio Inflation-Adjusted SCHD Consensus vs. S&P consensus |
|
5 |
1.04 |
1.10 |
|
10 |
1.08 |
1.21 |
|
15 |
1.12 |
1.32 |
|
20 |
1.16 |
1.45 |
|
25 |
1.21 |
1.60 |
|
30 |
1.25 |
1.75 |
|
35 |
1.30 |
1.93 |
|
40 |
1.35 |
2.11 |
|
45 |
1.40 |
2.32 |
|
50 |
1.45 |
2.55 |
|
55 |
1.51 |
2.80 |
|
60 |
1.57 |
3.07 |
|
100 |
2.11 |
6.50 |
(Source: DK Research Terminal, FactSet)
Over an investing lifetime, that’s about 3x the potential inflation-adjusted wealth of the S&P 500 and 60% more than the dividend aristocrats.
But let’s not forget the #1 reason we own high-yield blue chips, safe and dependable income growth.
Reason Four: Exceptional Income Growth Track Record
SCHD’s annual dividend growth is higher and more dependable than the dividend aristocrats.
- 3.2% yield in 2012
- 13.3% yield on cost in 2022
- 15.1% CAGR income growth for the last ten years
- higher annual income every single year (better than the Dividend Aristocrats).
Cumulative Dividends Since 2014 Per $1,000 Initial Investment
|
Metric |
S&P 500 |
Dividend Aristocrats |
Schwab US Dividend Equity ETF |
|
Total Dividends |
$285 |
$289 |
$489 |
|
Total Inflation-Adjusted Dividends |
$224.41 |
$227.56 |
$385.04 |
|
Annualized Income Growth Rate |
7.8% |
10.7% |
14.9% |
|
Total Income/Initial Investment % |
0.29 |
0.29 |
0.49 |
|
Inflation-Adjusted Income/Initial Investment % |
0.22 |
0.23 |
0.39 |
|
More Inflation-Adjusted Income Than S&P |
NA |
1.01 |
1.72 |
|
Starting Yield |
2.2% |
1.9% |
3.0% |
|
Today’s Annual Dividend Return On Your Starting Investment (Yield On Cost) |
4.0% |
4.3% |
9.1% |
|
2022 Inflation-Adjusted Annual Dividend Return On Your Starting Investment (Inflation-Adjusted Yield On Cost) |
3.1% |
3.4% |
7.2% |
(Source: Portfolio Visualizer Premium)
SCHD has been growing its dividends at 15% annually over the last eight and ten years, turning a 3% starting yield into a 7.2% inflation-adjusted yield on cost and paying 72% more in inflation-adjusted dividends than the S&P or dividend aristocrats.
- All with superior annual income growth dependability
Reason Five: The World’s Best High-Yield Blue-Chips At A Wonderful Price
Many things are on sale in a bear market, but SCHD offers deep value blue-chip bargain hunters something special.
|
Year |
PE |
|
2011 |
13.23 |
|
2012 |
14.32 |
|
2013 |
16.29 |
|
2014 |
16.92 |
|
2015 |
17.26 |
|
2016 |
19.46 |
|
2017 |
19.14 |
|
2018 |
15.28 |
|
2019 |
14.28 |
|
2020 |
19.36 |
|
2021 |
14.72 |
|
2022 |
12.05 |
|
2023 |
11.68 |
|
2024 |
11.31 |
|
11-Year Average |
16.39 |
|
11-Year Median |
16.29 |
|
10-Year Average |
16.48 |
|
10-Year Median |
16.61 |
|
5-Year Average |
15.14 |
|
5-Year Median |
14.72 |
|
12-Month Forward |
11.74 |
|
Historically Overvalued |
-29.32% |
(Source: FactSet Research Terminal)
SCHD’s historical market-determined fair value P/E is about 16.6x (similar to the S&P 500’s 16.9). Today it trades at just 11.7x earnings.
- 9.2x cash-adjusted earnings
- Pricing in 0.4% CAGR long-term growth vs. 8.5% CAGR consensus
SCHD is 29% historically undervalued, making it a potentially Ultra Value, Buffett-style “fat pitch” table-pounding buy given its safety, quality, and impeccable dividend growth record.
Bottom Line: If I Could Only Own One High-Yield Blue-Chip, SCHD Would Be It
SCHD is an excellent choice for anyone looking for “one high-yield dividend stock to rule them all.”
- Very safe 3.8% yield (better than almost any high-yield blue-chip ETF)
- 8.5% CAGR growth
- 15% historical income growth (similar to what analysts expect in the future)
- 100 of the world’s best high-yield blue-chips
- Effectively a “risk-free” fundamental risk investment over the long-term.
But of course, it’s better not to own just one stock.
My Uncle’s New And Improved ZEUS Income Growth Portfolio
|
Stock |
Yield |
Growth |
Total Return |
Weighting |
Weighted Yield |
Weighted Growth |
Weighted Return |
|
QQQM |
0.8% |
11.5% |
12.3% |
16.67% |
0.1% |
1.9% |
2.05% |
|
SCHD |
3.8% |
8.5% |
12.2% |
16.67% |
0.6% |
1.4% |
2.04% |
|
EDV |
4.2% |
0% |
4.2% |
16.67% |
0.7% |
0.0% |
0.71% |
|
DBMF |
9.5% |
0.0% |
9.5% |
16.67% |
1.6% |
0.0% |
1.58% |
|
AMZN |
0.0% |
31.9% |
31.9% |
5.56% |
0.0% |
1.8% |
1.77% |
|
LOW |
2.4% |
20.1% |
22.5% |
5.56% |
0.1% |
1.1% |
1.25% |
|
MA |
0.7% |
22.9% |
23.6% |
5.56% |
0.0% |
1.3% |
1.31% |
|
BTI |
6.6% |
10.4% |
17.0% |
5.56% |
0.4% |
0.6% |
0.94% |
|
ENB |
6.7% |
4.6% |
11.3% |
5.56% |
0.4% |
0.3% |
0.63% |
|
MO |
8.6% |
4.7% |
13.3% |
5.56% |
0.5% |
0.3% |
0.74% |
|
Total |
4.3% |
11.5% |
15.8% |
100.00% |
4.4% |
8.6% |
13.0% |
(Sources: DK Research Terminal, FactSet)
Here is the performance of my Uncle’s new and improved Zen Extraordinary Ultra Sleep Well At Night, or ZEUS Income Growth Portfolio, which consists of four core ETFs and 33% individual blue chips.
- Slightly higher yield than SCHD on its own
- Slightly higher long-term income growth and total return potential as well
- 33% yield, 33% growth, 33% hedges (bonds and managed futures)
|
Metric |
60/40 |
New ZEUS Income Growth Portfolio |
X Better Than 60/40 |
|
Yield |
2.3% |
4.4% |
1.89 |
|
Growth Consensus |
5.1% |
8.6% |
1.69 |
|
LT Consensus Total Return Potential |
7.4% |
13.0% (historical returns since 2007 12.5% to 14% CAGR) |
1.75 |
|
Risk-Adjusted Expected Return |
5.2% |
9.1% |
1.75 |
|
Safe Withdrawal Rate (Risk And Inflation-Adjusted Expected Returns) |
2.9% |
6.8% |
2.33 |
|
Conservative Time To Double (Years) |
24.6 |
10.5 |
2.33 |
(Source: DK Research Terminal, FactSet)
Almost 2x the yield of a 60/40, with superior long-term return potential to the market, Aristocrats, SCHD, and Nasdaq.
- 12.5% to 14% CAGR rolling returns since 2007
A safe withdrawal rate of almost 7%, more than double that of a 60/40.
Combining SCHD with other world-beater blue-chip assets, including individual companies, can deliver even better yield, returns, lower volatility, and life-changing income growth.
- 19% CAGR income growth for this ZEUS portfolio since 2008
And this is why Dividend Kings and iREIT are fans of diversified and balanced blue-chip portfolios. Because they are the single best strategy to help you sleep well at night in every bear market and retire in safety and splendor.
Be the first to comment