

Andrii Yalanskyi/iStock via Getty Images
By Jill Mislinski
The October Preliminary Report came in at 59.8, up 1.2 (2.0%) from the September Final. Investing.com had forecast 59.0. Since its beginning in 1978, consumer sentiment is 30.1 percent below the average reading (arithmetic mean) and 29.2 percent below the geometric mean.
Surveys of Consumers chief economist, Richard Curtin, makes the following comments:
Consumer sentiment is essentially unchanged at 1.2 index points above September, in spite of a 23% improvement in current buying conditions for durables owing to an easing in supply constraints. Sentiment is now 9.8 points above the all-time low reached in June, but this improvement remains tentative, as the expectations index declined by 3% from last month. Continued uncertainty over the future trajectory of prices, economies, and financial markets around the world indicate a bumpy road ahead for consumers. The median expected year-ahead inflation rate rose to 5.1%, with increases reported across age, income, and education. Last month, long run inflation expectations fell below the narrow 2.9-3.1% range for the first time since July 2021, but since then expectations have returned to that range at 2.9%. After 3 months of expecting minimal increases in gas prices in the year ahead, both short and longer run expectations rebounded in October. [More…]
See the chart below for a long-term perspective on this widely watched indicator. Recessions and real GDP are included to help us evaluate the correlation between the Michigan Consumer Sentiment Index and the broader economy.
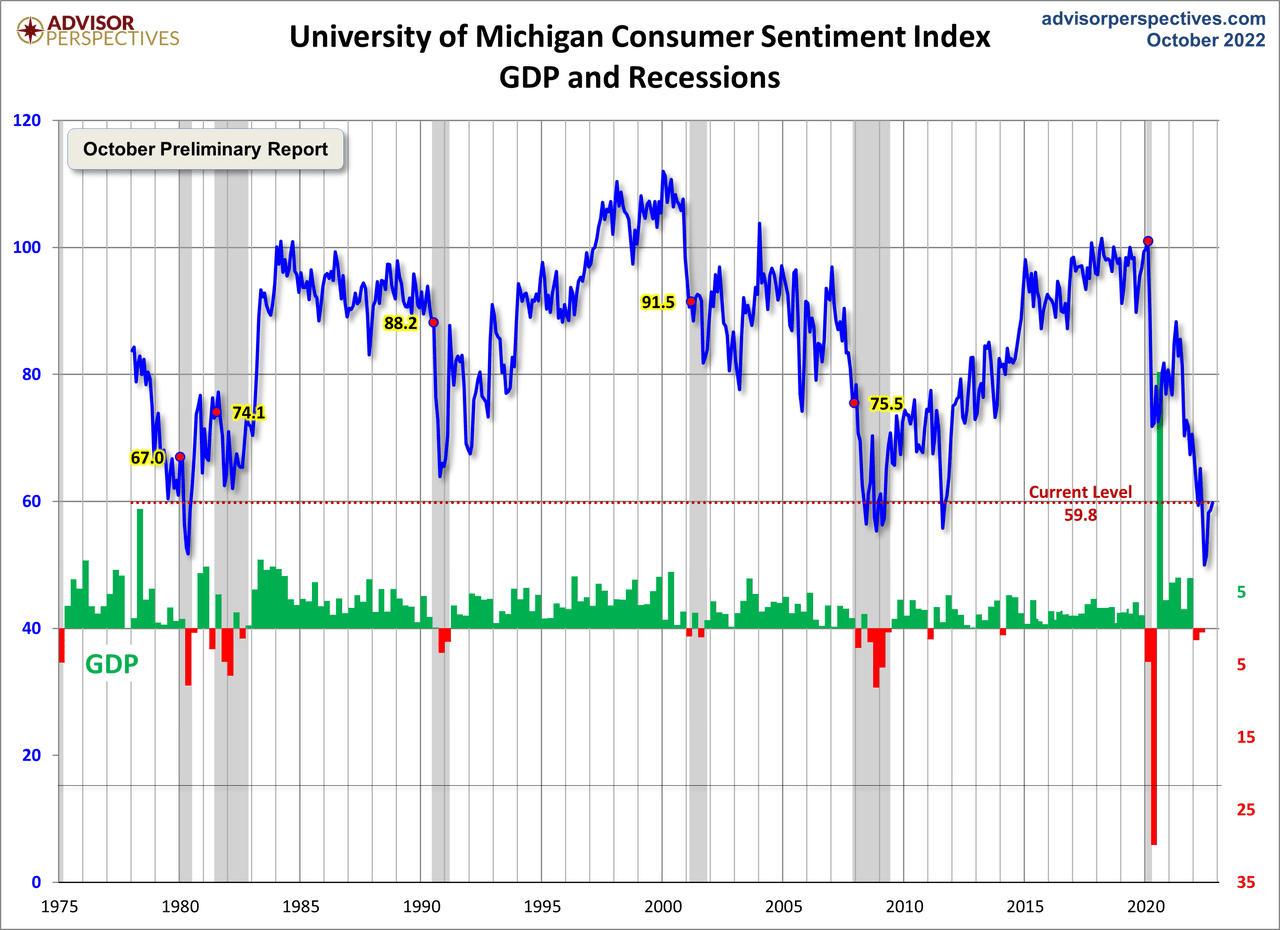
To put today’s report into the larger historical context since its beginning in 1978, consumer sentiment is 30.1 percent below the average reading (arithmetic mean) and 29.2 percent below the geometric mean. The current index level is at the 3rd percentile of the 538 monthly data points in this series.
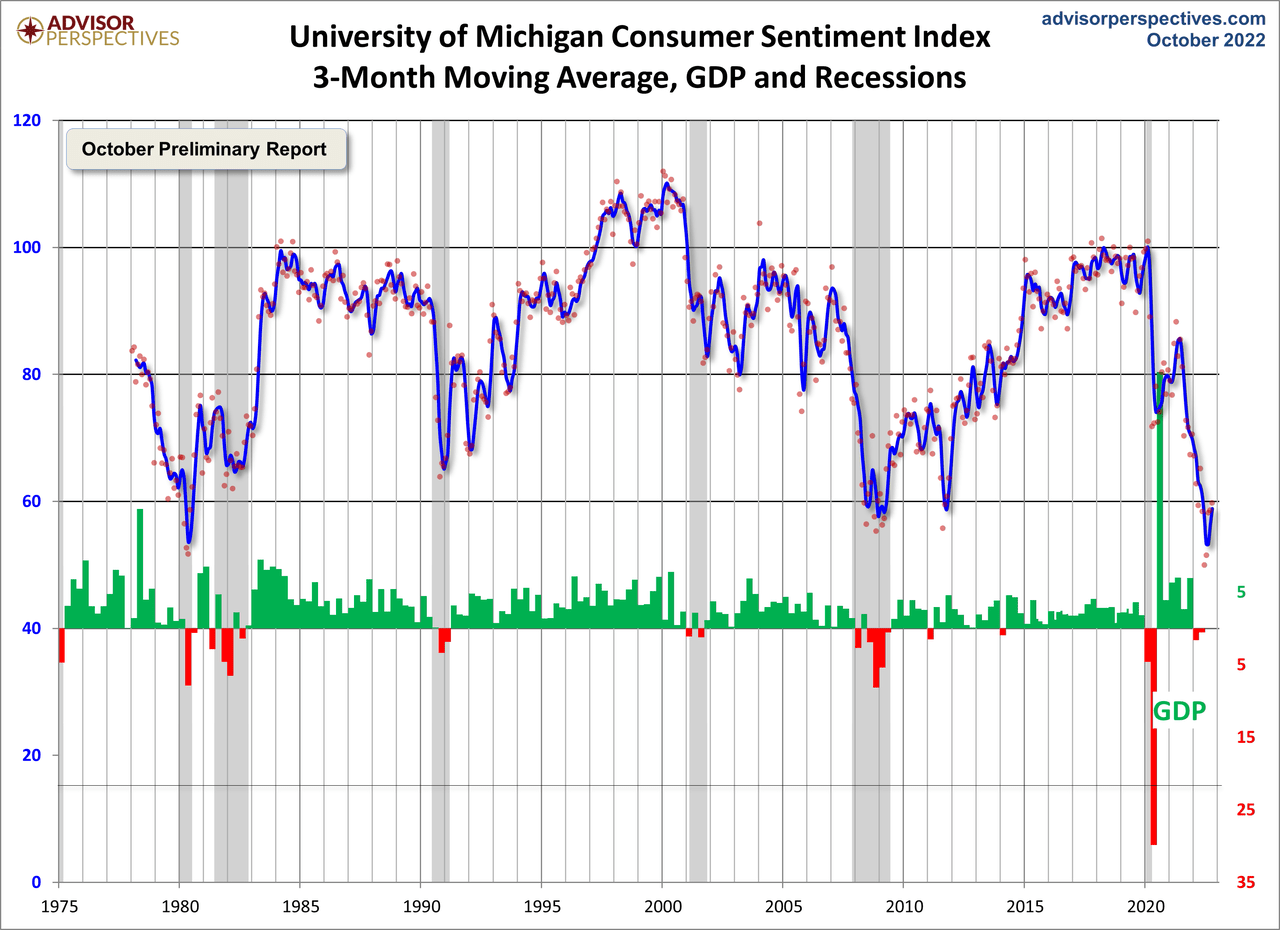
Note that this indicator is somewhat volatile, with a 3.0 point absolute average monthly change. The latest data point saw a 1.2 point increase from the previous month. For a visual sense of the volatility, here is a chart with the monthly data and a three-month moving average.
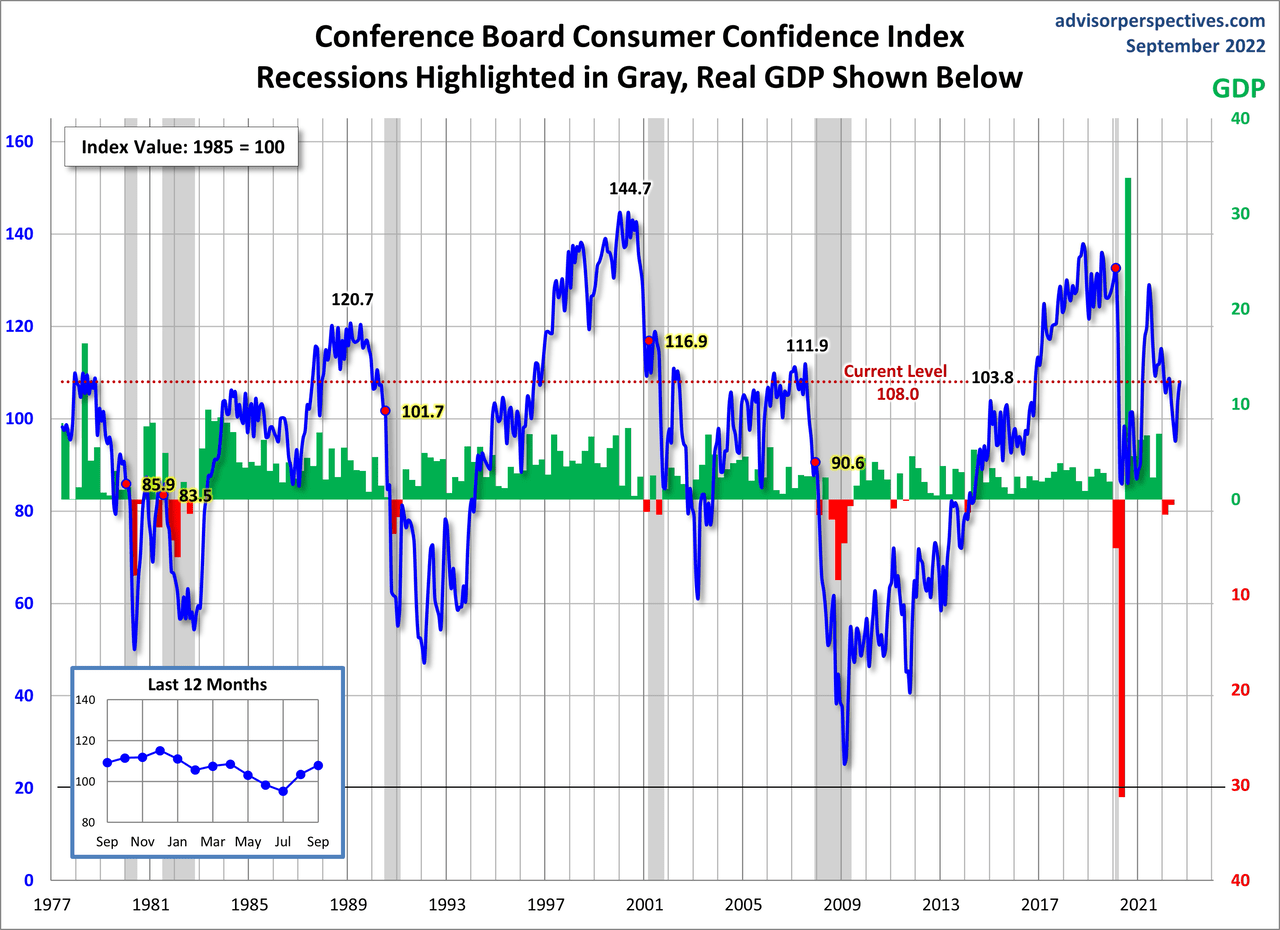
For the sake of comparison, here is a chart of the Conference Board’s Consumer Confidence Index (monthly update here). The Conference Board Index is the more volatile of the two, but the broad pattern and general trends have been remarkably similar to the Michigan Index.
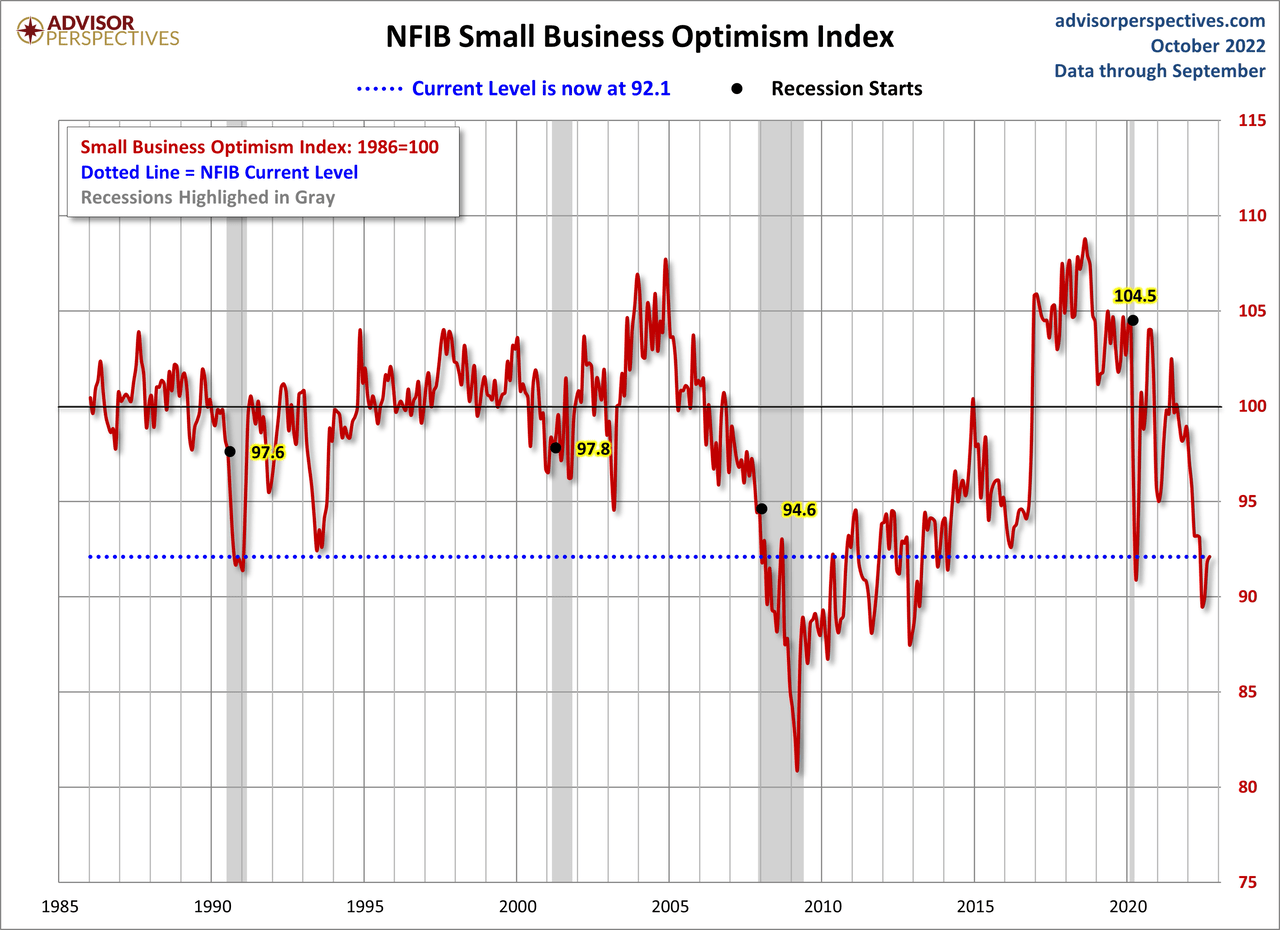
 And finally, the prevailing mood of the Michigan survey is also similar to the mood of small business owners, as captured by the NFIB Business Optimism Index (monthly update here).
Editor’s Note: The summary bullets for this article were chosen by Seeking Alpha editors
Be the first to comment