

Mongkol Onnuan
Thesis
Schwab U.S. Dividend Equity ETF (NYSEARCA:SCHD) is a high-quality ETF that is designed to fully replicate the performance of the Dow Jones U.S. Dividend 100 Index. Accordingly, the fund invests in “growth and value stocks” that pay dividends.
It has proven its market outperformance over time, beating the SPDR S&P 500 ETF’s (SPY) 5Y and 10Y total return CAGR. Furthermore, it has also outperformed the SPY significantly in 2022, as SCHD posted a YTD total return of -14.7%, against the SPY’s -23.8%. Therefore, we believe it helps dividend investors reduce their volatility risks while benefiting from the compounding advantage of SCHD’s dividend-paying companies.
Notwithstanding, SCHD’s exposure to financial companies (20.6%), industrial companies (16.3%), and technology companies (15.8%) meant the fund has also been battered by the bear market in 2022. Furthermore, a worse-than-expected global recession could compress the valuations of these companies further, resulting in more downside volatility for the SCHD.
However, we assess that SCHD’s battering has markedly improved its price action dynamics, even though there could still be risks of near-term selling downside. As a result, we believe that investors with a long-term perspective should find the current levels attractive from a reward-to-risk perspective.
We discuss the critical levels that investors should watch carefully and encourage investors to layer in overtime to reduce the impact of potential downside volatility.
Accordingly, we rate SCHD as a Buy.
SCHD’s Long-Term Uptrend Remains Robust
SCHD price chart (monthly) (TradingView)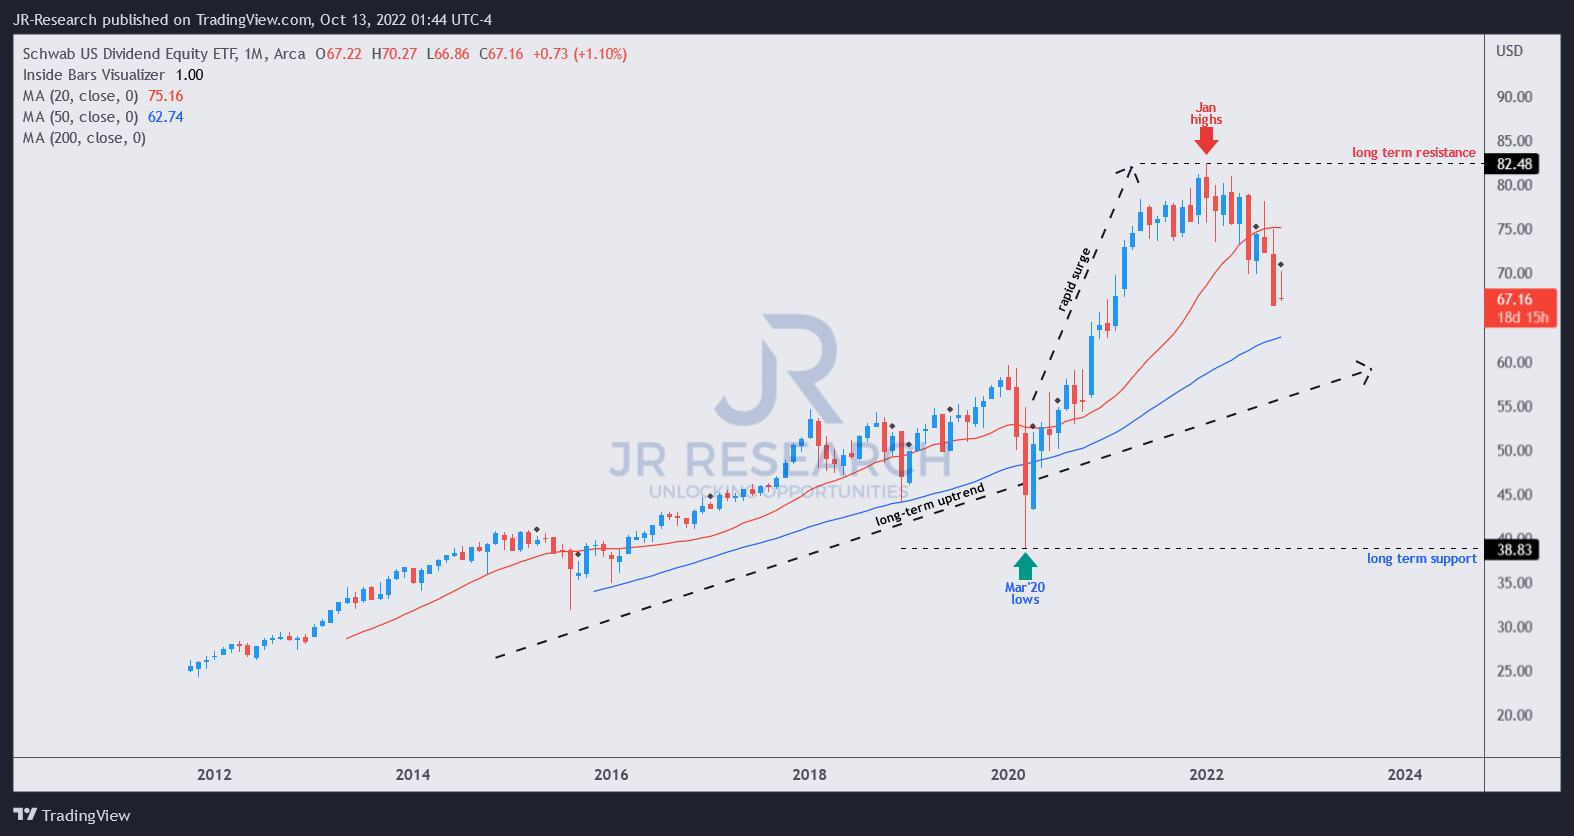
SCHD has an unmistakable long-term uptrend that indicates the market’s long-term bullish bias. Moreover, given its focus on dividend-paying companies, we don’t expect the market’s confidence in SCHD’s outperformance to change in the near- to medium-term.
Notwithstanding, the battering from its January highs is justified, as the run-up from its March 2020 lows was too fast. As a result, it lifted the market valuations to unsustainable levels once the Fed pulled the plug from its liquidity pump.
Our assessment suggests that SCHD could face further downside volatility as the world moves toward a global recession. As such, a re-test of its 50-month moving average (blue line) could unveil clues on where the potential bottoming process on the SCHD could form.
SCHD price chart (weekly) (TradingView)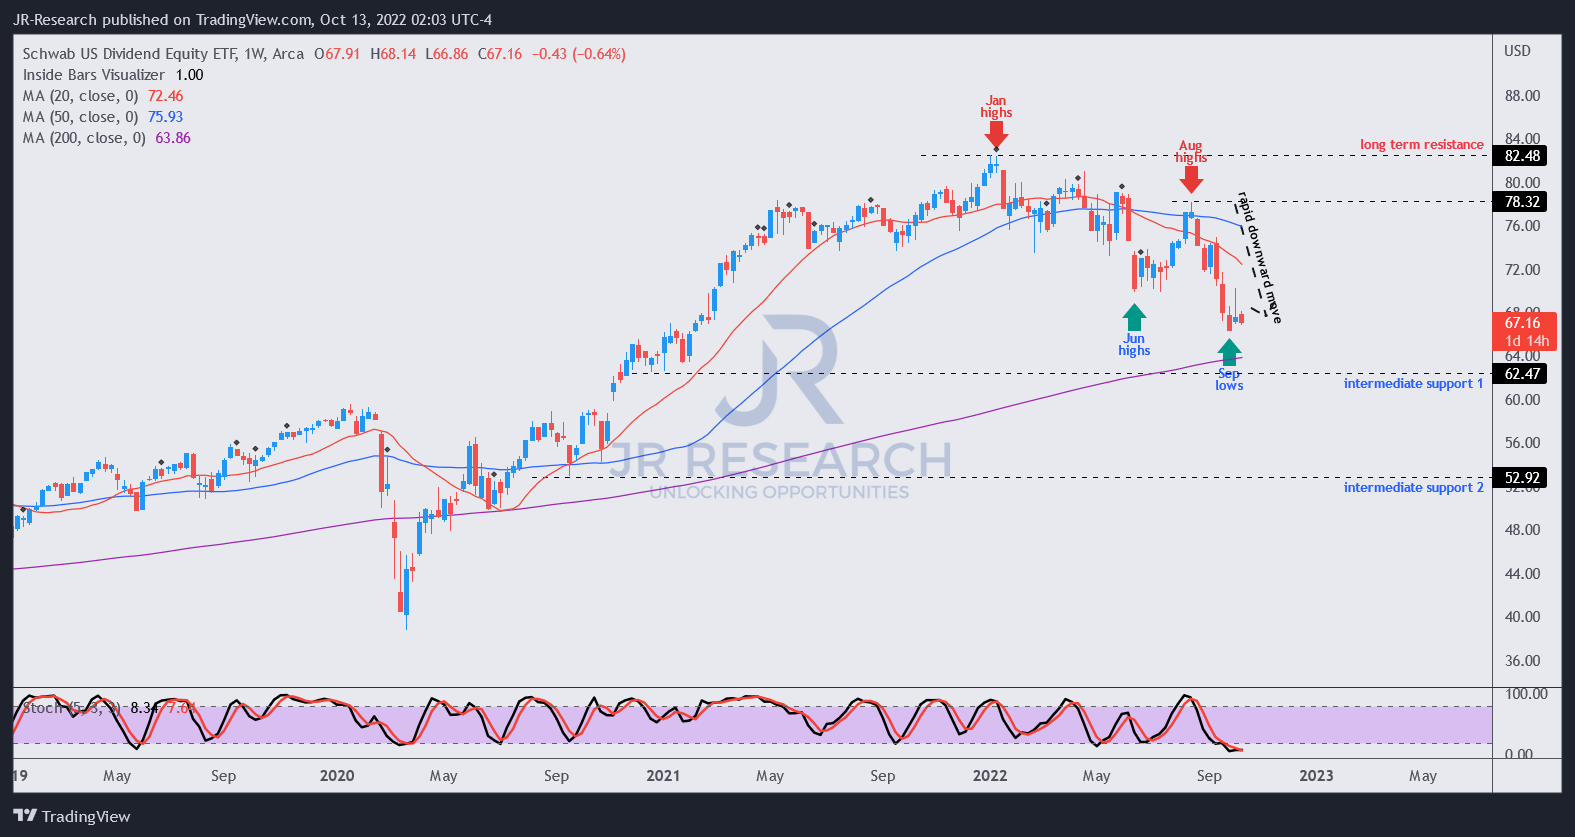
A closer look at its medium-term chart indicates that the market went into a selling overdrive from its August highs to its recent September lows.
As a result, we believe the downward spiral led to a near-term capitulation move against weak holders, de-risking the entry levels for investors still waiting on the sidelines.
As seen above, SCHD is nearing its 200-week moving average (purple line), which we postulate could attract long-term investors to stanch further selling downside.
Notwithstanding, our base case of a mild-to-moderate recession could be tested in the event of a worse-than-expected global recession. The IMF has also warned of “increased risks to the financial system,” given the rapid tightening pace across central banks globally.
Therefore, we are not ruling out the risks of a significant financial event that could trigger a severe recession. Hence, we encourage investors to be prudent while adding exposure to SCHD.
Our analysis indicates a potential re-test of its “intermediate support 1” and “intermediate support 2” is possible, with an eventual bottoming process between the two levels. However, we don’t expect a re-test of its COVID lows without a disastrous collapse in the EPS estimates of its holdings through 2024.
Is SCHD ETF A Buy, Sell, Or Hold?
SCHD last traded at a forward P/E of 11.2x, well below the SPY’s forward P/E of 15.1x. Hence, SCHD offers a discernible discount against the broad market, which should help mitigate downside volatility for investors.
SCHD Top ten holdings (Part 1/2) (TIKR) SCHD Top ten holdings (Part 2/2) (TIKR)
Furthermore, the forward P/E of its top ten holdings (accounting for 40% of its total exposure) has reverted to its 10Y mean or under it, given the battering in the market.
As such, we believe the reward-to-risk profile looks reasonably attractive, despite the specter of a potential global recession.
We rate SCHD as a Buy.
Be the first to comment