

Bilgehan Tuzcu/iStock via Getty Images
Investment thesis
Despite I consider SAP SE (NYSE:SAP) as fundamentally undervalued and underscored the opportunities for long-term investors in my previous article, I want now to focus on the short-term risks and opportunities, as the stock is technically in an extended downturn and the poor performance of the past years, compared to its industry references, seems not ending anytime soon. The stock has broken every important support level, crashing under its pandemic level, and is now facing its last support, before I likely see a more significant drop in its price. This situation could lead to a short-term rebound, but since the stock suffers from increasingly high relative weakness and no significant sign of a reversal is building up, the stock is not offering a safe entry point and suggesting that the risks are significantly higher than the short-term opportunities, qualifying the stock as a hold position until a more clear picture could suggest that a bottoming phase is building up.
A quick look at the big picture
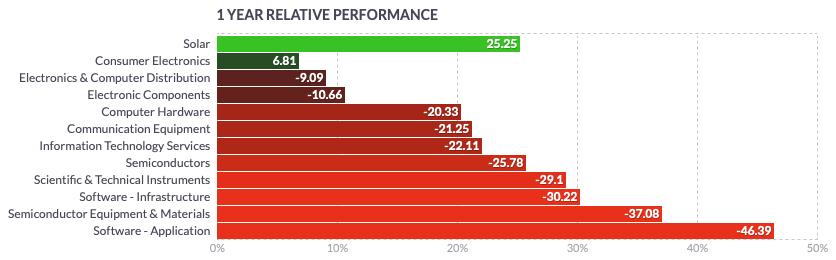
The technology sector in the US is among the winners in the last 3 months, led by a rebound in solar stocks, followed by companies in the consumer electronics and electronics components industries, while companies in the software application industry are slightly improving, after having been by far the laggards of the group in the past year.
finviz finviz
Looking at more specific groups of the industry, the iShares Expanded Tech-Software Sector ETF (IGV) marked its All-Time-High (ATH) on November 9, 2022, and has since severely corrected, losing 43%% until bottoming on June 16 and is since attempted to break out in August, but failed and got rejected close to its EMA200.
Author, using TradingView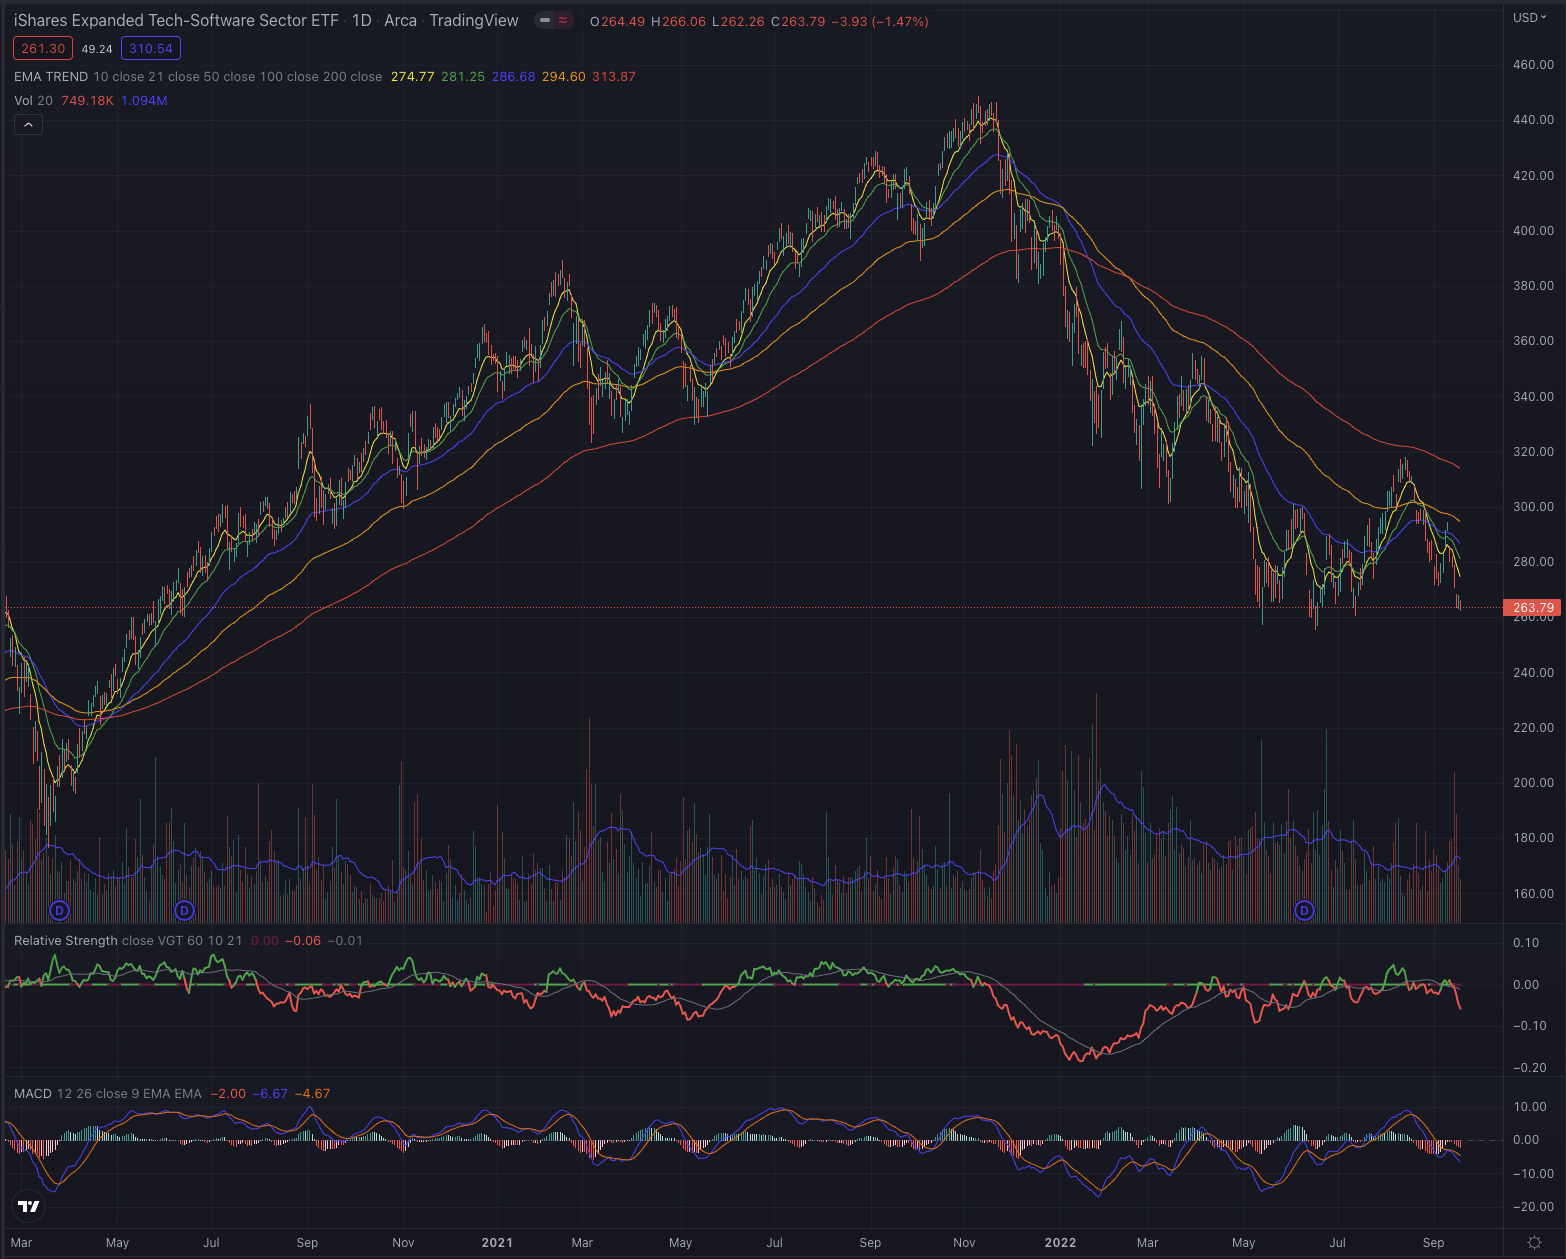
The First Trust Cloud Computing ETF (SKYY) has a very similar pattern but lost almost 50% until June 16 and has since attempted to form a sound base, but the recent price action has been increasingly negative. Both industry groups are still in a medium and long-term downtrend and are now approaching their low set in June as they continue to show progressive relative weakness when compared to the Vanguard Information Technology ETF (VGT).
Author, using TradingView
Looking back even further, SAP performed significantly worse than its main references, reporting a -23.92% performance in the past 5 years, while all its references outperformed the stock massively. The Vanguard Information Technology ETF is leading this comparison with over 120%, while even the broader S&P 500 has achieved a performance above 54% during the analyzed time.
Author, using SeekingAlpha.com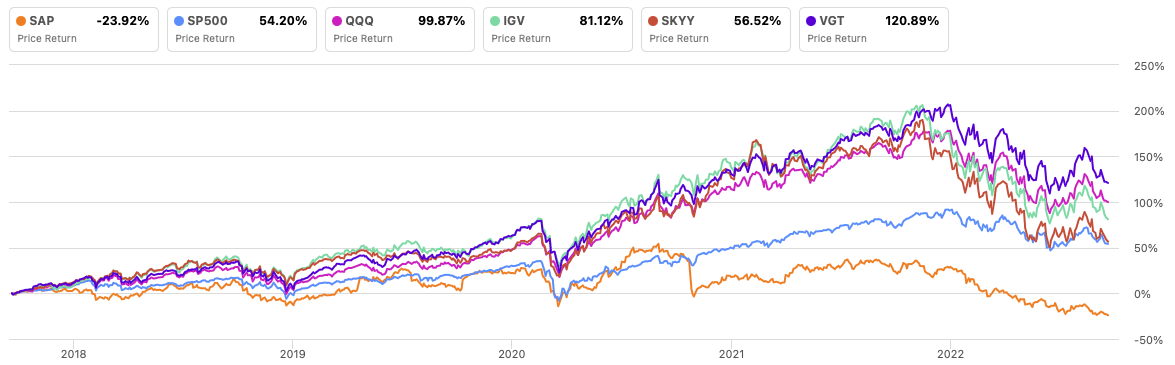
Where are we now?
In my last article SAP Has Now Become More Attractive, published on May 12, 2022, I changed my opinion on the company, as fundamentally it looked greatly undervalued and it offered an opportunity for long-term investors. On the other hand, I noted that technically the stock was still in a downtrend and I warned of a prolonged correction as the stock still didn’t bottom, and therefore I did not see a safe entry point for short-term traders. The stock has since lost almost 12% of its value and continues to mark lower lows, while every attempt to break out of its downtrend has been rejected. The stock broke under its pandemic low until EUR 82.29 (or $82.37) and is building an increasing relative weakness since the beginning of July.
Author, using TradingView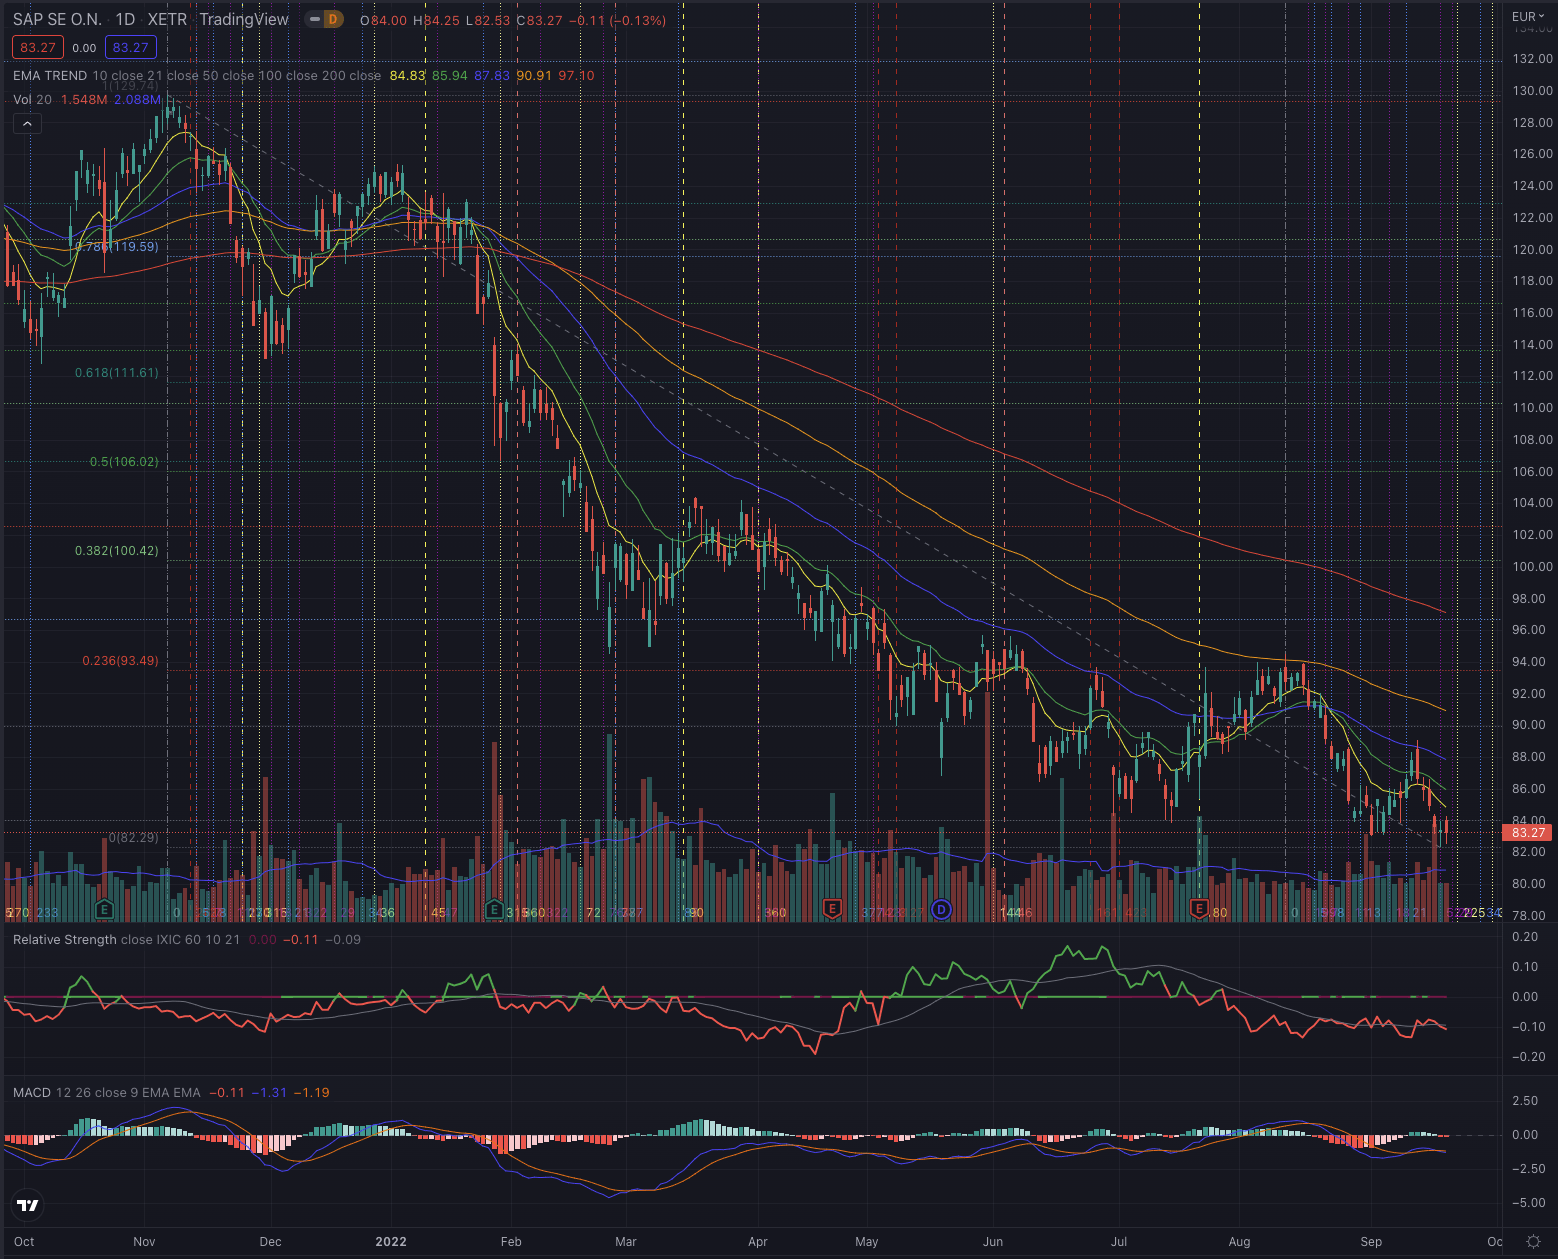
On its weekly chart, the stock crashed into a negative trend at the end of January and since its short term, EMA10 and EMA21 are acting as trailing resistances, rejecting every breakout attempt. The stock is now testing the lows of 2018, having given up all the profits of the last 4 years.
Author, using TradingView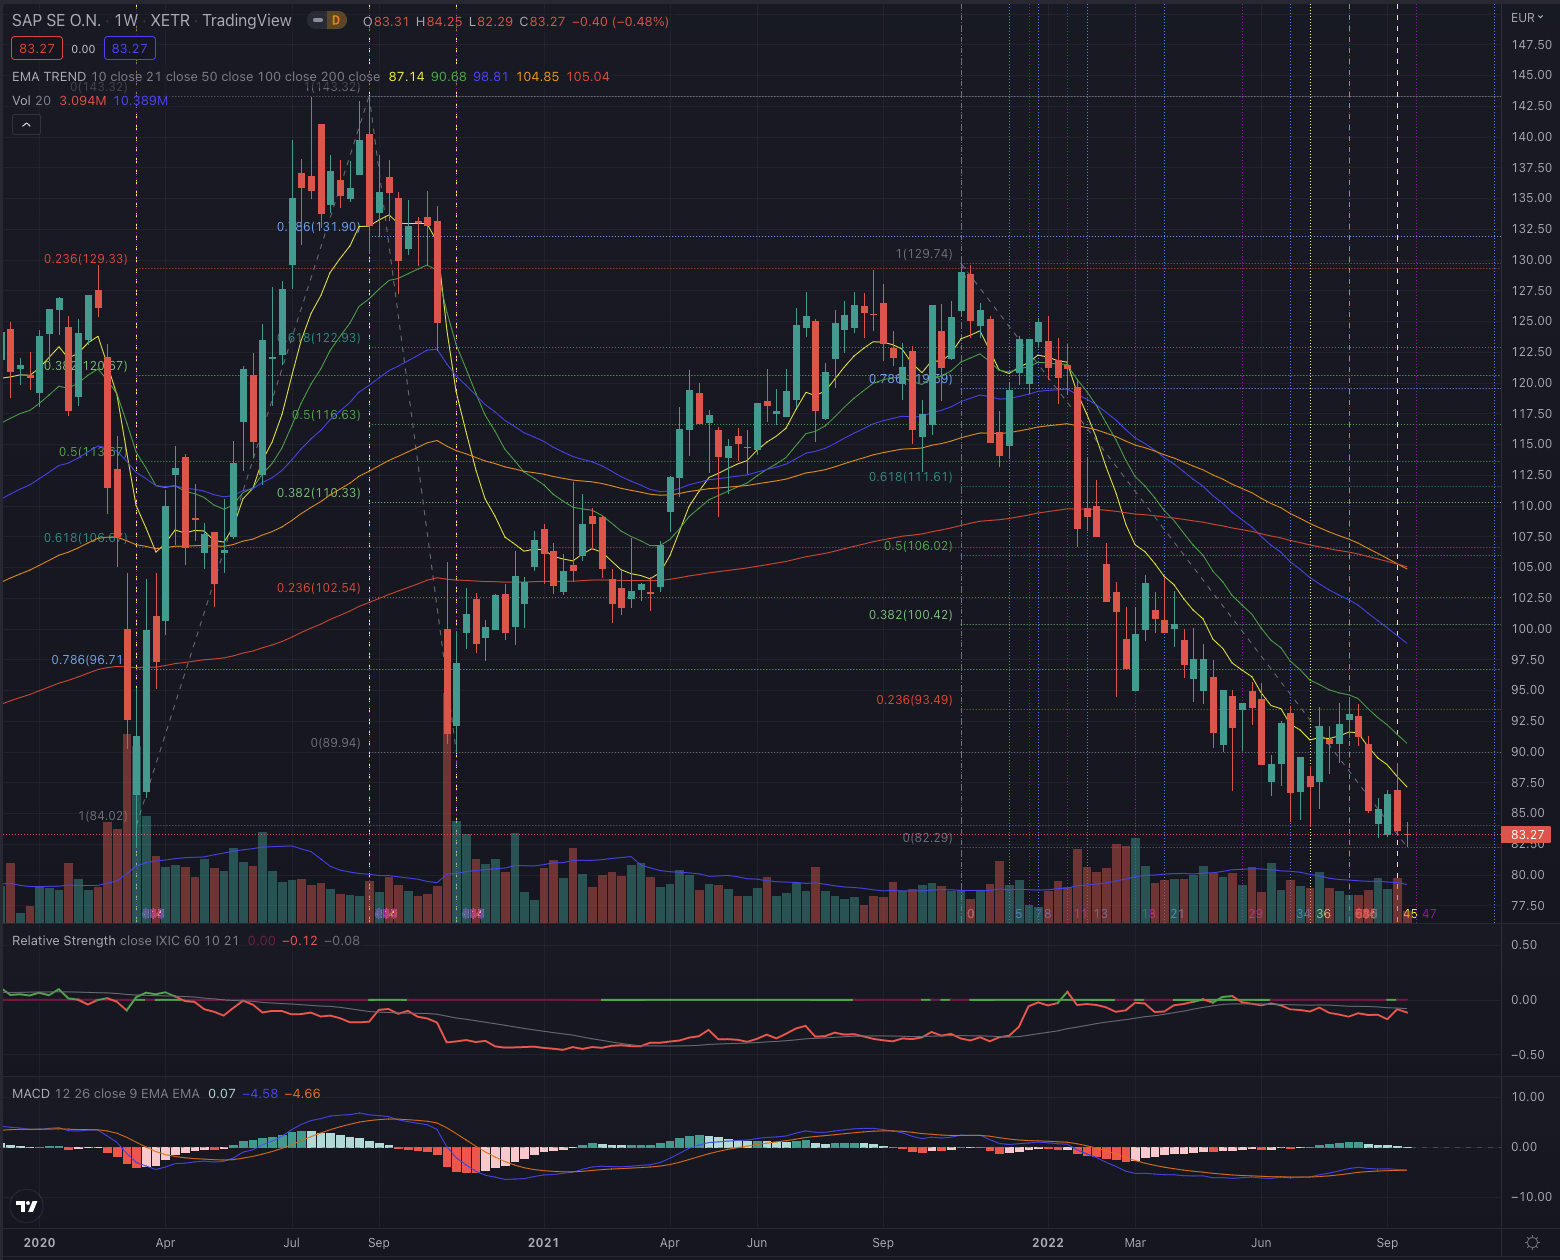
Technically the stock is still in a quite negative situation. It still shows a negative momentum confirmed by its MACD, and increasing selling pressure in the past week. The stock has very strong overhead resistances now not only formed by its trailing moving averages but also by the lows marked during the pandemic and more recently during its downtrend.
What is coming next
I expect the stock to continue performing negatively in the short term, as it seems that the bottom is still not hit, and all relevant indicators are suggesting that a possible turnaround is still out of sight. The stock is dangerously close to its important support at EUR 82.05 (or around $81.50), under which I see the stock likely falling until approximately EUR 75 (or around $74).
Author, using TradingView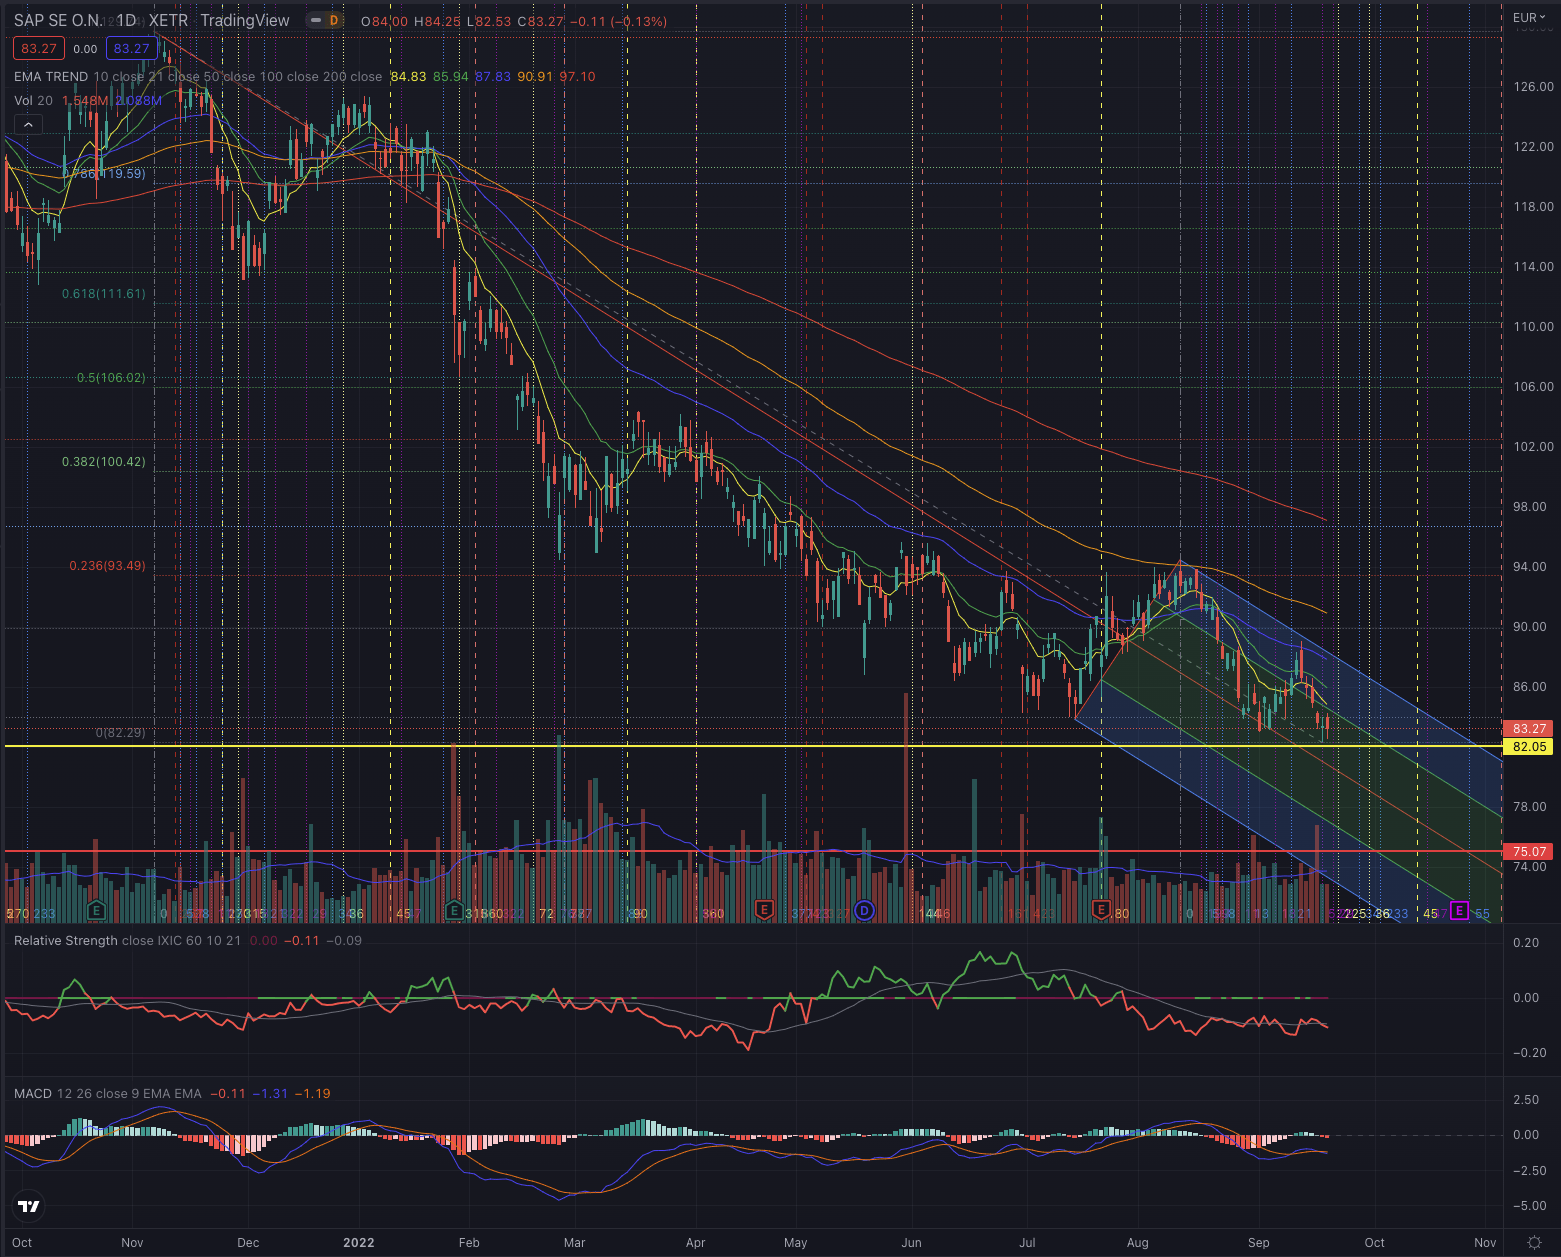
Investors should closely observe the price action and how the stock behaves at this crucial support level, and how an eventual attempt to overcome its resistance is confirmed or rejected, by particularly observing the trading volume in both directions. As the last few sessions showed a substantial spike in sell-side volume leading to an important support level, this could be the start of a short-term bottoming attempt, but it’s too early to make any conclusive statement in this sense, as if the selling pressure continues, the support level may break. If the stock instead manages to reverse and gains in positive momentum with stronger relative strength and increasing volume, I see a significant chance that it could attempt to overcome the ceiling of the downtrend channel and the EMA50, before reaching the previously set short-term top and try to break out towards its EMA200 on its daily chart. As this week will most likely be characterized by higher volatility, due to the Federal Reserve being expected to increase its interest rates, investors should be more cautious and set appropriate stop-loss orders by observing the mentioned support levels.
The bottom line
Technical analysis is not an absolute instrument, but a way to increase investors’ success probabilities and a tool allowing them to be oriented in whatever security. One would not drive towards an unknown destination without consulting a map or using a GPS. I believe the same should be true when making investment decisions. I consider techniques based on the Elliott Wave Theory, as well as likely outcomes based on Fibonacci’s principles, by confirming the likelihood of an outcome contingent on time-based probabilities. The purpose of my technical analysis is to confirm or reject an entry point in the stock, by observing its sector and industry, and most of all its price action. I then analyze the situation of that stock and calculate likely outcomes based on the mentioned theories.
SAP has many elements that indicate the stock is technically in a difficult situation, despite fundamentally the company may be significantly undervalued. In my previous article, I put the accent on more fundamental aspects, while here I purposely disclose my opinion based on technical analysis and address this article to more short-term traders. From a technical perspective, the stock is not in a buy position as it is still in a downtrend and close to an important support level. I, therefore, change my rating based on purely technical aspects and from a near-term perspective. Although a rebound could happen, the risk at this point overshadows the short-term opportunities as a strong reversal seems not likely in this market conditions and the bottoming process would take some time before forming a sound base from which to start a new significant uptrend. Investors should be prepared for ongoing higher volatility for the stock, by considering the risk of falling toward new lows, as the general market and particularly stocks in the technology sector are still quite exposed to unfavorable market conditions.
Be the first to comment