

Seiya Tabuchi/iStock via Getty Images
Investment Thesis
As an Australian natural gas producer, it was logical that we benchmarked Santos (OTCPK:STOSF) against Woodside (WDS), a peer we’ve analyzed previously. We concluded that with many key valuation metrics aligning closely, the main differentiating factor was the shareholder return (i.e. dividend and buyback) programs of the two companies. Although expected to become more attractive over time, with Santos’ current approach less appealing than its competitor, we find ourselves favoring Woodside.
The Company
An Australian-based hydrocarbons E&P company, Santos operates five main sites situated across the country and in neighboring islands. Its customer base is also concentrated in the Asia Pacific region, with a significant portion of production supplied to the domestic gas market. Referencing production volumes from recent activity reports, the contribution is well spread across the various locations, although the expected end-of-life of reserves later this year in the Northern Territory has been neatly offset by an increase from PNG operations subsequent to the merger with Oil Search.
Increased production from the PNG site is offsetting imminent end-of-life reserves in Northern Australia and maintaining annual volumes around 100-110mmboe (Santos quarterly production reports)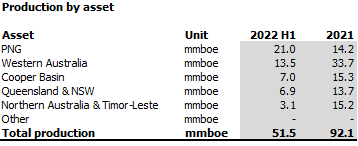
Its production pipeline consists of a recently approved project in Alaska scheduled for first oil in 2026, and the Barossa project which will backfill in the Northern Territory from 2025 (although now at risk of being delayed). We estimate the company’s annual production volumes to come in around 120-140mmboe once these projects come online, up from current levels of 100-110mmboe.
The company utilizes free cash flow as a key performance metric – for example, it calculates $25-35 brent oil equivalent as its free cash flow breakeven point. Shareholder returns are determined using a cumbersome calculation methodology that ranges between 10-40% of free cash flow.
To try and succinctly summarize, using recently released half-year results, its 19% of earnings equivalent paid as dividends represented an annualized return of 3%, with another 27% earnings equivalent set aside for buybacks (2% equivalent of outstanding issuance). Considering that prior six months saw exceptionally high oil prices (brent average $105) and record first-half profits for the company, we feel the eventual amount returned was a little light. We will elaborate on this further below.
Santos’ H1 2022 record profits of $1.1bn were equivalent to EPS of $0.39 and a trailing P/E ratio of 7x.
Woodside Comparison
At this juncture, we think it’s useful to build a potential investment case side-by-side with Woodside.
When viewed through valuation metrics, both companies have comparable P/B, P/E and RoE metrics. Also, somewhat evident at first glance is that Woodside is conveniently roughly double the size of Santos when looking at a wide range of metrics from production to capex budget, from market cap to calculated operating cash flow. Initial impressions would suggest that with similar looking valuations and growth prospects, on a per-share basis Santos is on level-footing with Woodside.
Santos and Woodside share comparable valuation metrics (blue highlighted). The major differences lie in its gearing levels and capital return programs (orange) (based on published financial information)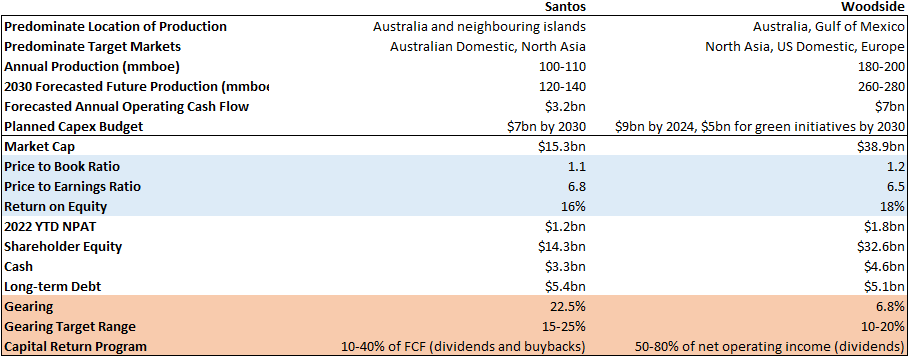
However, we think the size difference is a telling indication of two natural gas companies moving in diverging directions.
Woodside essentially only doubled in size after its recent merger with BHP Petroleum, and in the process took on sizable assets outside of Australia. We think this reflects a strategy to aggressively expand into new markets and become a larger global player. Simultaneously, it achieved lower gearing post-merger which allows them to operate an ambitious dividend program which we think conveys a strong intent to reward shareholders.
In contrast, we view Santos as more comfortable consolidating its position in the Asia Pacific region, and therefore content with the size of its presence at the moment. We don’t fault the company for pursuing this strategy, but we think that this means less justification to retain profits, and therefore the company should be more liberal with shareholder returns. We acknowledge that the current gearing level (22.5%) is at the upper end of the company’s target range, and hinders increased shareholder returns as this would erode the capital base and in turn increase gearing further. However, we see this as a near-term concern that should alleviate within the next few years.
Cash Flow Analysis
We are convinced that gearing can be brought down (through full repayment of outstanding debt) and still leave ample funds to return to shareholders, by mapping out forecasted cash flows to be generated for the next 8 years.
We model that by 2030, the company could be sitting on over $10bn without an avenue to invest it. We think the current amount set aside for shareholders (in blue) could be at least doubled (in orange) (own analysis)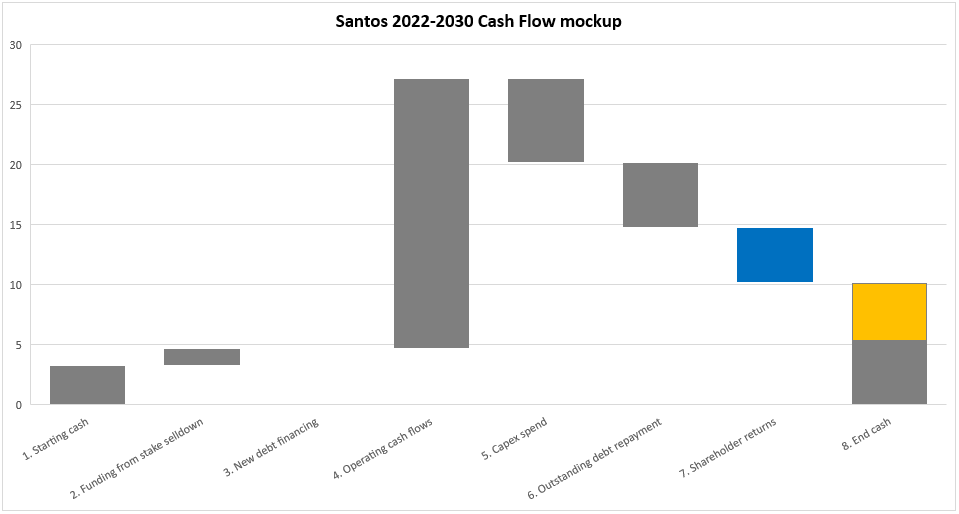
- Starting cash
- Funding from stake selldown: includes the $1.4bn from an expected 5% stake sale in the PNG project. Management is also pursuing other sales, notably in Alaska
- New debt financing: assumed none, as likely any cash inflow would likely be offset as additional capex spend outflow
- Operating cash flows: Santos’ own calculation for the 8 years assuming $65 brent oil
- Capex spend: Santos’ own estimate of $7bn
- Outstanding debt repayment: assumes full outstanding amount of $5.4bn is repaid
- Shareholder returns: assumes 40% of free cash flow paid out
- End cash: essentially starting cash + 60% of free cash flow
Applying conservative assumptions, we calculated that by 2030 Santos’ cash position will at least double to over $10bn – an excessive amount especially if the company doesn’t have a clear strategy on how it will reinvest and compound returns on incremental cash. We think the company does not pursue significant growth, and therefore eventually will agree to return more capital to shareholders. Our model suggests that the amount returned could be doubled (i.e. 80% of FCF) during this timeframe, and still allow for enough cash to repay all debt and maintain a healthy cash position.
For now, it is likely the company is exercising prudence in case of events such as an untimely energy market collapse. This reasoning, in addition to the prioritization of debt servicing, are valid reasons for the company to retain cash. However, we look for a sufficient buffer to build up within 2-3 years that will facilitate a policy pivot and eventuate in hefty dividend payouts and a substantial buyback program in the second half of this decade.
Conclusion
With earnings potential to cover investment outlay within at most 8 years by our calculations, we are not worried with the company’s profitability, but rather concerned about how much and when an investor will receive those profits.
Looking forwards, although the stock price may be supported by buybacks and fluctuate correspondingly with energy prices, we think it is hindered from seeing meaningful appreciation by the company’s modest growth pipeline.
Therefore, as a classic value stock, we would value a higher amount, a shorter time horizon, and certainty of returns to investors. We sense that with the company currently focused on managing down its gearing levels, it will take a couple of years before the company can commit to meaningful improvements on these 3 points. Our model does suggest though that Santos could sustainably return to its shareholders double the amount it is currently committed to, and therefore there is significant upside risk that backloaded returns could reward handsomely.
In the meantime, considering that its rival’s valuation metrics are quite similar and promise greater immediate capital returns, we view Woodside as a more enticing investment choice.
(Reported $ amounts reference USD as it is the reporting currency of Santos. AUDUSD = 0.65 assumed in analysis)
Be the first to comment