

da-kuk
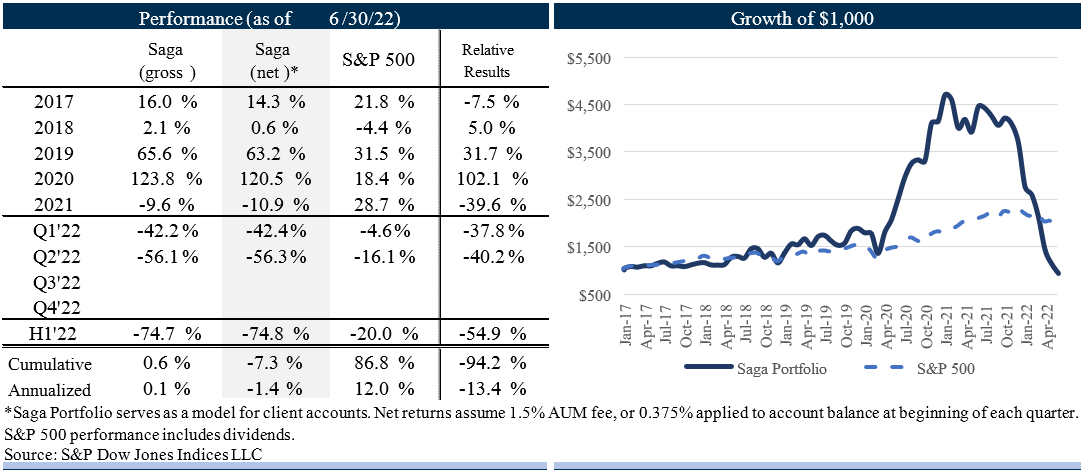
During the second quarter of 2022, the Saga Portfolio (“the Portfolio”) declined 56.3% net of fees. This compares to the overall decrease for the S&P 500 Index, including dividends, of 16.1%.
The cumulative return since inception on January 1, 2017, for the Saga Portfolio is -7.3% net of fees compared to the S&P 500 Index of 86.8%. The annualized return since inception for the Saga Portfolio is -1.4% net of fees compared to the S&P 500’s 12.0%. Please check your individual statement as specific account returns may vary depending on timing of any contributions throughout the period.
I have to admit the decline in the Saga Portfolio during the first half of the year has been surprising. Experiences like this can be quite alarming and raise several legitimate questions. What is going on? Are these declines permanent or an opportunity? Is this just the manic market acting extra bipolar or were mistakes made?
I typically try to avoid discussing short-term share price movements, but the continued declines deserve some explanation. When owning a concentrated portfolio of stocks that have prices set every day, we must always be prepared for any price action the market will throw at us. However, the extent and scope of the recent declines have been surprising and not something I would have placed a high probability on, absent a complete meltdown of the economy. While some of our companies have experience certain headwinds in operating results this year, no widespread meltdown has been experienced as far as I can tell.
The challenge of investing in companies that have a potential multi-decade runway to compound shareholder value in front of them is balancing their long-term outlook with a valuation that provides a sufficient margin of safety. Discovering and understanding these opportunities is extremely difficult. Buying and holding on to them during the inevitable, and sometimes significant, volatility can be even more challenging.
It is very easy to be influenced by frightening headlines or short-term speedbumps, but what matters is understanding a company’s value proposition and ability to grow its competitive advantage into the future, not guessing the beginning or end of business cycles, the Fed’s next interest rate move, or the infinite number of other things to worry about. Of course, eventually the cash flows of any specific company are what matter and will be what determines the value of the company.
Despite a more challenging macro environment, there has not been any material changes to the long-term outlooks or competitive strengths of our companies, with the exception of GoodRx (GDRX). During the first half of the year, a structural change in GoodRx’s business model was revealed which invalidated the initial investment thesis (i.e. it was mistake) and resulted in the Portfolio selling its shares which we discuss in more detail later.
The only silver lining was that this occurred during a broader market sell-off which provided the opportunity to reallocate the Portfolio into investments selling at what I believe to be extremely attractive prices.
Despite the ups and downs experienced over recent years, nothing has changed surrounding Saga Partners’ core investing philosophy and process. For the purpose of this letter, I thought it would be a good time to dive deeper into the Saga Portfolio’s investing philosophy and explain why we invest the way that we do. Then I will also explain each of our companies and why we own them.
The Search for a Theory of Investing
Good theories explain why and how something happens and therefore provide good predictive value. Since investing is all about forecasting the future, it helps to have good theories that explain what will lead to strong returns. However, much of the investing industry use rules of thumb to make decisions. Rules of thumb are short cuts that look to past patterns or correlations to make predictions.
They can be a helpful tool and “probably” work under a certain set of circumstances, but they don’t understand why or how something works and therefore can also be misleading. One will not know if the circumstances that cause an expected outcome change and therefore make the rule no longer applicable.
An example of an investing rule of thumb might be a company that sells for a low valuation multiple is cheap and one that sells for a high multiple is expensive. While it may very well be the case that historically many companies that sold for low multiples were undervalued, they weren’t undervalued because they sold for a low multiple, but rather because they were purchased for an attractive price relative to the net cash returned to owners.
All investors go through their own journey of figuring out what works or doesn’t work. My journey, like many others, started with the basic heuristics that Ben Graham outlined in The Intelligent Investor, which stated that undervalued companies sold for low multiples. However, I realized inconsistent results when attempting to apply this in the real world. Then I leaned further into buying “high-quality” companies that had a track record of earning high returns on capital, lots of free cash flow, and sold for relatively low multiples.
My results improved but I still discovered too many inconsistencies than what one would expect from a good theory. There was still a disconnect between theory and reality that kept me searching for better explanations.
If you look at the great fortunes over time, they have mostly been made through concentration in a business that has compounded at a high rate over a very long period of time. Companies like Walmart (WMT), Amazon (AMZN), Costco (CSCO), Microsoft (MSFT), Apple (AAPL), Google (GOOG,GOOGL), Sherwin-Williams (SHW), Progressive (PGR), Transdigm (TDG), Copart (CPRT), Old Dominion Freight (ODFL), or a handful of others spent decades of their life as public companies in a state of being systemically undervalued despite often selling for what was widely considered “overvalued” multiples.
What’s special about these companies is their long-term excess returns. The advantage of owning them was not the returns earned in a single year or two, but the returns that one got from owning them for 5, 10, or 20+ years, which are irrelevant to most market participants who only care about a shorter time horizon. When one thinks over that much longer time horizon, the kind of information that matters to an investment is much different than the kind that matters over the next year.
If one had the ability to look into the future and understand the causes that led to Walmart or Amazon shareholders’ success, the key was not in attempting to buy in and out of them, but in holding them as long as one believed they sold for attractive prices relative to those prospects. That does not mean that the shares wouldn’t experience significant drawdowns during the holding period as the economy faced recessions, inflation, or risks of potential competitive threats surfaced. Despite that, they continued to compound intrinsic value per share far and above that of the general market.
It can be difficult to hold on to companies, even when you believe they have very attractive long-term outlooks. This is especially true if surrounded by an adrenaline-fueled environment such as Wall Street where people shout prices every minute and distribute reports with opinions on all the reasons to worry and take action each day. It is likely that more money has been lost in attempting to buy and sell the stock of a company like Amazon than simply holding shares as long as one believed its long-term prospects looked attractive relative to the current price.
Charlie Munger calls this type of investing “surfing,” comparing it to when a surfer catches a wave and then just stays there for a long time. He uses the example of National Cash Register in the early 1900s. The Company had the best distribution system, patents, and the ability to continue improving the product as technology improved. Munger said any “well-educated orangutan” could see that buying into a partnership with National Cash Register in the early days was a no-brainer.
Of course, it is easy to look back at the long-term winners, but is it possible to pick them ahead of time? Unless one wants to get lucky by guessing how a stock will jump up and down, a portfolio that wants to outperform over the long-term, must identify and own the few stocks that outperform the market over the long-term.
The one law of investing is that intrinsic value is the present value of the future net cash returned to owners per share. If one could perfectly predict all the cash in and out of a company for the rest of its life and apply the appropriate rate of return (discount rate) they require, they would have the exact intrinsic value of the business. While the above definition is true, the problem that misleads many Wall Street analysts is that it takes an inherently quantitative approach to a subject that is inherently qualitative.
Businesses are living entities made up of resources, technologies, and networks of people. Simplifying what is a highly complex adaptive entity into a discounted cash flow model, without considering the qualitative dynamics that may be driven by power laws, is sure to miss the target. 10+ years may seem far away but that is where the majority of a company’s intrinsic value is determined, at least for the companies that will still be alive and well, which is typically our hunting ground.
While there can never be any way to perfectly predict the exact cash in and out of a company, there can be good explanations about how products/services, management, and innovations in companies solve problems over time. Analysts prefer the hard numerical data available because it is viewed as more objective and reliable. However, the numbers that represent revenues, costs, and profits in financial statements are the result of judgements that can produce grossly inaccurate reflections of true earning power. Financial statements are merely a piece of the puzzle for determining value, not the sole determining factor of it.
The better a theory predicts the value a company produces over time, the better one can judge a company’s earning power over time, and the better one can make informed investing decisions today.
The Best Theories of Investing…At Least That I Know of For Now
A good theory (explanation) of investing would understand the causation as opposed to correlation of successful investments, and be applicable throughout time regardless of industry, macroeconomic cycles, business lifecycles, and technological revolutions. Is it possible to identify the previously mentioned companies without the benefit of hindsight?
I think the key is better understanding the causality of competitive advantage, and more importantly the durability of a competitive advantage. This makes intuitive sense because a competitive advantage means there is something a company can do to a better extent than others. It provides the ability to earn higher returns on invested capital than other companies by either charging higher prices, having lower costs, and/or lower capital investment needs.
The durability of its advantage is what prevents competitors from replicating a similar value proposition. If a company has no durable competitive advantage, it would be a commodity and the price of its product or service would be competed down to the lowest cost provider’s cost of capital, generating no excess return for owners and therefore lackluster stock returns over its life.
I have found Clayton Christensen’s writings to provide an essential framework for thinking about competitive advantage. His theories address how and why companies behave and respond to certain variables. These responses can often be counterintuitive to conventional thinking and being able to predict unconventional outcomes more accurately than what is widely believed provides the ingredients for a great investing opportunity.
The first two concepts of his below surround the idea of competitive advantage while the third touches on the durability of a competitive advantage:
- Theory of Jobs to Be Done is a framework that states a customer “hires” a company’s product or service to perform a specific job. A job is the progress that a customer wants to make when they face a particular problem. The theory attempts to understand the tasks that customers look to a product for, so companies can then create the right experiences to solve a specific job to be done. Theodore Levitt famously said, “people don’t want a quarter-inch drill, they want a quarter-inch hole.” Focusing on the job to be done typically requires integrating internal capabilities and processes in order to execute the job consistently, which is critical for competitive advantage and relates to the next theory.
- Law of Conservation of Attractive Profits (it’s really a theory) states that the power to capture attractive profits shifts to the activities in the value chain where the customer is not yet satisfied with the performance of available products. When resources are in high demand/scarce (not good enough), those who own and control those resources have pricing power. When resources are abundant (good enough), the price for access to those resources is set by the lowest cost provider. The scarcer a resource, the closer to monopoly-like dynamics. The more abundant a resource, the closer to commodity-like dynamics. Note that the terms “resources” and “jobs to be done” can be interchanged.
These two theories go hand in hand. Competitive advantage is built by creating the experiences that customers seek both in purchasing and using the product or service. Typically, when products are not good enough, a company must build internal processes to integrate around that part of the value chain where the experiences are in highest demand to ensure that those experiences are consistently delivered. What matters is not the bundle of product attributes put together, but the experiences enabled to help customers make the progress they require.
Products and technology are not a competitive advantage in and of themselves. While it may be easy for competitors to copy products, it’s difficult for them to copy experiences that are well integrated into a company’s processes. Processes emerge from thousands of small decisions about how to solve a certain problem. They get better and better from learning and iterating what works and doesn’t in an effort to best provide the job customers hire a company to do.
Integration can either provide a company with a unique, hard to copy value proposition which customers are willing to pay higher prices for (better convenience, quality, brand) and/or a relative cost advantage by streamlining frictional costs (low-cost provider, scale economies shared model). The reason customers are willing to pay premium prices for a product that perfectly solves the job to be done is because the full cost of a product that fails to do the job can cause wasted time, frustration, and spending money on other solutions that don’t perform the job to be done as well.
Companies that fail to integrate around a job risk becoming replaceable commodities, forced to compete on price with look-alike competitors. Just think of most airlines, automakers, rental car companies, or personal computer manufacturers.
If you look at some of the most successful companies throughout history, they either benefited from integrating important parts of the value chain (vertically integrating around the hard to solve problems) or benefitted from being a key link/essential modular component in the value chain (horizontal strategy by attempting to be the sole supplier or distributor benefitting from economies of scale, network effects, or owning a cornered resource).
We will discuss in more detail in the Portfolio Review below, but the Saga Portfolio companies that vertically integrate the key parts of their value chain (Carvana, Redfin, Trupanion, LGI Homes) achieve profits by selling differentiated products/services. The horizontal companies (Facebook, The Trade Desk, Roku) on the other hand, achieve profits by being the crucial scaled access point/distributor in their respective value chain.
- Theory of Disruption explains and predicts incumbent companies’ response to an innovation that provides simplicity or affordability to a market. It states that when a competitive threat attempts to steal an incumbent’s most profitable customers, the incumbent will use its significant resources to try and beat the threat. In almost every case the incumbent wins by being better positioned for sustainable innovation. However, if a competitive threat discovers a disruptive innovation that can serve a whole new and different customer base, the incumbent leader almost always ignores it. Disruptive products are typically not good enough to compete with existing technology and therefore typically target the low-end of the market where customers are viewed as less profitable/unattractive by incumbents. Through incremental technological improvements (sustaining innovation to the disruptive innovation), the disruptive product improves and can eventually better serve the incumbents’ core customer base with cheaper or easier to use products. This theory explains how historically powerful companies like Western Union (telegraph network), Sears (department stores), and IBM (mainframe computers), fell to companies like AT&T (wired telephones), Walmart (discount retail), and Microsoft (personal computer operating system), which initially possessed fewer resources and had to build a whole new value chain network. These dynamics have nothing to do with the power of the incumbent, but rather how companies respond to technological innovation.
Combining the Jobs to Be Done, Conservation of Attractive Profits, and Disruption Theories provides a framework for understanding a company’s value proposition, competitive advantage, and durability of that competitive advantage to help drive investing decisions.
Understanding where a company and its products are in their life cycle is essential. In immature markets, often the product/service is not “good enough” in terms of performance or accessibility. This typically leads to integrated providers where companies inhouse more components of the value chain. When a market matures, modular standardized solutions become “good-enough” in terms of performance. Third-party providers can eventually leverage a scale and price advantage to take over the market.
Attractive returns then shift away from activities where the immediate customer is more than satisfied, because it is there that standard modular integration occurs. Jim Barksdale, former CEO of Netscape, expressed this pattern in his famous quote, “there are two ways to make it in business: one is to bundle, the other is to unbundle.”
It may seem counterintuitive to think of disruption and change as predictable; however, it has played itself out over and over again throughout history. Many public equity investors evaluate what a company looks like today and not necessarily what it will look like in 10 years from now. They are anchored to the most recent quarter’s results. Some companies are mature, not facing disruptive innovation, and will likely look very similar in 10 years as they do today (think Coca Cola). However, this is a widely accepted view that is likely already reflected in its current price, and therefore would not provide excess stock returns.
“Disruptive” companies by definition are doing something different and are therefore potentially not well understood. People are generally not comfortable betting on change. In fact, thinking that the future may look different from the past is widely considered speculative. While many changes are difficult to predict, certain changes, where a company has discovered a disruptive innovation, accomplished product-market fit (job to be done), and is following the predictable path of sustaining innovation, can be even more inevitable than certain consistencies.
Analysts often do not appreciate the trajectory of improvement in the product/service and underestimate its future success over and over again. Eventually as it becomes more obvious that the up-and-coming disruptor turns into the incumbent, growth slows, margins expand, and its attractive economics are better reflected in the financials and therefore easier to analyze. The company is no longer considered speculative as consensus views it as “high-quality” which is likely reflected in its valuation.
Evaluating Results
Of course, these theories of investing must be tested to determine their validity (market outperformance). It feels a little awkward to explain the foundational theory that drives the Saga Portfolio philosophy when, following the first half of 2022 results, our prior outperformance has turned into lackluster returns since inception.
In an activity like investing where there is a component of luck in the outcome, generating useful feedback can be challenging. The inputs are not always directly related to the outputs. Returns (output) could either reflect the process (input) or be the result of good or bad luck (chance). Short-term feedback is entangled with the noise of daily news and stock market moves that fluctuate for an infinite number of reasons. However, eventually the results to an owner will be reflected in the change in a stock price plus the dividends received over the holding period.
The question is how long a period is needed to determine if an investing thesis is sound. I have always said our results should be judged over a five-year period, at the very minimum. The caveat would be if the beginning or ending period was during an unusual time. I would argue the current market (at least where many of our investments are situated) is a bit unusual.
Although one can only make that argument for so long before the market is forever in a state of being unusual. I do not want to be like the “permabear” that has underperformed for the past decade by staying in cash but rationalizes his actions because the sky is always going to fall tomorrow.
One way to help form constructive feedback is to document the process that led to a certain judgement. Documenting why you are investing in something and what you expect to happen helps provide a track record to understand whether a positive result was due to a good judgement or good luck, or if a bad result was due to a bad judgement or bad luck. It will still not be perfectly clear feedback, but with enough time and decisions, it should provide some understanding as to what led to certain results, which one can learn from, iterate, and improve their process and decision making going forward.
When we lay out an investment thesis, it typically includes why a company has a competitive advantage (accomplishes a job to be done better than alternative solutions), the durability of that competitive advantage, and assessment of the market opportunity (growth). Then explain how that will be reflected in its financials based on an understanding of the operating leverage and capital requirements inherent in the business model. Subsequently, numerous datapoints may provide confirming or disconfirming evidence to our initial thesis.
If it appears that the longer-term trends of growth, margins, market share, or any other quantitative metrics are tracking far from initial expectations, it potentially suggests there is a misunderstanding of the qualitative advantages and opportunity of the business, and therefore forces a reassessment of the investment thesis from a first principles basis.
We attempt to focus on what causes a business to succeed or fail in the long term while paying relatively little attention to shorter-term effects. This long-termism keeps us focused on what we expect the steady state of the business to be as it nears maturity. The underlying competitive dynamics and business models that drive value typically change little overtime. In ranking the importance of confirming or disconfirming evidence to an investment thesis, we place the most weight on the qualitative analysis of a company’s competitive advantage in its value chain.
Then, we track the longer term quantitative financial trends and data (sales, margins, unit economics, market share), and finally place little to no weight on macro-economic forecasts or current news headlines. The key is getting the business analysis correct. If we invest in great businesses with strong long-term outlooks at reasonable prices relative to those outlooks, the stock should take care of itself despite the macroenvironment.
Portfolio Review
When a stock crashes, that means there is either a perceived, yet invalid, decline in intrinsic value of the business from prior periods, or the intrinsic value is truly lower than previously believed and therefore the lower share price more accurately reflects the actual intrinsic value. It is our job to determine whether it is the former or the latter. During such times, we cannot look to the market for answers because it will be shouting panic.
In order to evaluate the recent share price declines experienced during the first half of the year, I thought it would be helpful to provide my thoughts and the reasoning for each one of our companies. I do not typically discuss every company in such detail, but I thought it would be helpful given the circumstances. With the growing word count of this letter, I have included the write-ups in the appendix for reference.
In that section, I review the companies that are experiencing what I believe to be speedbumps along their journey of compounding shareholder value (LGI Homes, Meta, Carvana, Roku, and Redfin), companies that continue to execute exceedingly well despite the macro environment (Trade Desk and Trupanion), and a situation where recent problems are more pervasive in nature and detrimental to the long-term investment thesis (GoodRx).
Conclusion
Over the last five and a half years, there has been much to worry about, whether it was rising interest rates, trade wars, Presidential elections, wars, nuclear tests by hostile nations, inflation, deflation, or a pandemic that shut down the entire world’s economy…to name a few.
In June, consumer sentiment was at all-time historic lows since the University of Michigan began tracking it in 1952. It seems surprising that sentiment is worse than during past crises such as the 1970s energy crisis and hyperinflation, September 11th, Great Financial Crisis, or COVID pandemic.
In reality, we are living in the freest and most prosperous time than at any point in history. Of course, there are very real problems facing the world today that need to be tackled. However, that is the natural state of the world. There will be very real problems to solve in 5, 10, and 20 years from now, with scary headlines to boot worrying about what the Fed will do next, whether a recession is around the corner, or the numerous other problems we cannot predict.
“Actively” managing a stock portfolio during a time of what appears to be renewed negativity can lead to increased focus on the here and now and less on the distant future. All of us who seek to have successful long-term performance also feel short-term pressure—and that’s because the long-term is an aggregation of short terms. It is very easy to be influenced by the pressure to perform in all periods, which can distract from thinking like owners of businesses. The key is to do what you think is the right thing over the long term.
Our companies continue to execute to the best of their abilities in what appears to be a more challenging macro environment. While a potential crisis or recession reduces current period operating results, over time they tend to benefit the competitively advantaged businesses models at the expense of the losing ones. We are broadly invested in companies that are positioned to not only survive, but more likely flourish, following any major downturn in the economy. I would not be surprised if we look back at any economic distress in five or so years as a net positive development for our companies in total.
During times of greater volatility and periods of large drawdowns, I am reminded of how truly important the quality of our investor base is. I have spoken to many of you in recent months to discuss my thoughts surrounding some of our Portfolio companies and the broader investing climate.
It is completely natural to react in certain ways to rising or declining stock prices. It takes very special investors to look past near-term volatility and trust us to make important decisions on your behalf as we continually try to increase the value of the Saga Portfolio over the long term. I, along with my family, are on this multi-decade journey alongside you with essentially all of my investable assets in the Saga Portfolio.
As always, I am available to catch up or discuss any questions you may have.
Sincerely,
Joe Frankenfield
Appendix 1
|
*Saga Portfolio serves as a model for client accounts. Net returns assume 1.5% AUM fee, or 0.375% applied to account balance at beginning of each quarter. S&P 500 performance includes dividends. |
Appendix 2
For each of our Portfolio companies, I provide the financial data and stock returns during the period that we were owners, starting with the longest holdings, which reflects the experience both fundamentally and from a shareholder price perspective.
LGI Homes (LGIH)
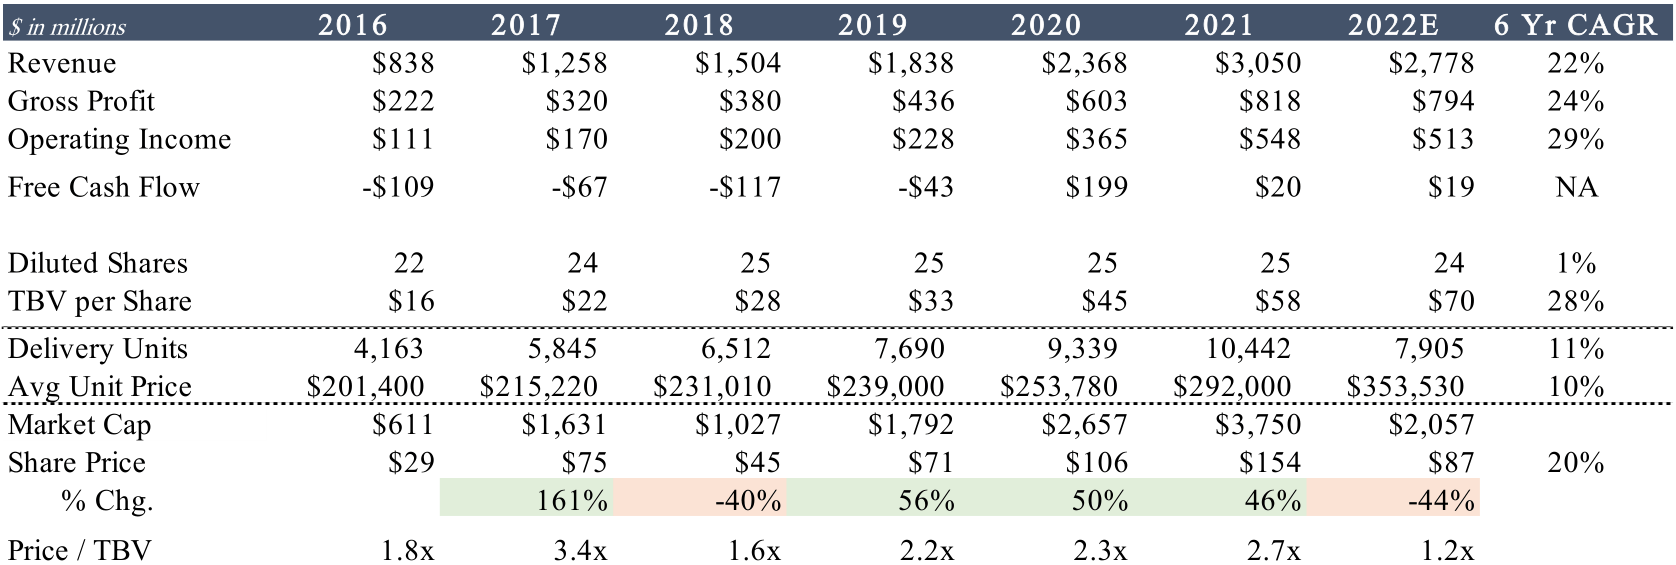
LGI Homes should be a familiar name. The Portfolio first bought LGI in Q1’17 and then sold it during Q1’21 to take advantage of other opportunities that appeared relatively more attractive. Subsequently, shares increased over 50% from our sell price, only strengthening belief in our inability to time tops and bottoms. As shares declined this year as a potential reaction to LGI’s supply chain headwinds and a greater aversion to housing related stocks, we are excited to be owners again.
LGI builds and sells standardized entry-level, single-family homes at attractive prices. Their competitive advantage comes from numerous integrated processes that all work together to drive building quality homes fast and at low price points. There is no proprietary technology or knowledge, but LGI has integrated around a very specific job to be done, which is very difficult for any other homebuilder to replicate, resulting in industry-leading growth and returns on equity.
The company has an assembly line-like process. It starts with acquiring land that other homebuilders typically view as unattractive, typically further outside urban areas. A key determinant in their land acquisition strategy is the number of renters that live within a 25-mile radius. LGI tests for demand by sending out fliers, assesses conversion rates, and then acquires the land if they determine there is sufficient demand to earn at least a 25% gross profit margin.
Their high inventory turnover is the result of only having ~4-5 standard floor plans, not allowing any customization, using similar materials across all homes (one kind of carpet, one kind of countertop, etc.) which decreases the time to build a home to an average of 60 days as opposed to the industry standard 90180 days.
Unlike most homebuilders, LGI does not rely on realtors or brokers. They generate their own demand through direct mail and digital marketing that focuses on converting renters, who may not have even been looking to buy a home, to homeowners. This gives LGI access to customers that other homebuilders are not targeting.
Typically, an LGI home is larger, has greater amenities, and is cheaper than an apartment. The selling process is extremely effective; LGI schedules meetings only on the weekends, never shows someone a home they can’t afford (based on estimated income and credit checks), and will not schedule second meetings with the same customer.
On the macro front, the housing market has been in a flux. There has been a general lack of new homes built since the Great Financial Crisis combined with a post COVID surge in home demand caused prices to surge. With mortgage rates increasing this year, home affordability has declined to near multi-decade lows.
Counterintuitively, LGI should benefit regardless of the macro housing environment. If housing demand remains strong, LGI will benefit with the rest of the industry; if conditions worsen (higher mortgage rates, unemployment, inflation, etc.), LGI’s lower home price points compared to existing homes, competitors, or rising rents will make their value proposition that much more attractive to customers.
If new home demand deteriorates substantially, LGI’s industry leading margins may decline, but it would mean less profitable competitors would be in an even worse position, likely providing the opportunity for LGI to acquire land and supplies at distressed prices. Even if the housing macro environment is as bad as after the Great Financial Crisis, LGI should still be able to provide attractive profitability and growth. LGI’s unique business model and integrated process serves as a moat that insulates it from competition and macroeconomic headwinds.
LGI is one of the few companies we own where GAAP earnings are actually a fair proxy for earning power. They do not have a lot of intangible growth investments that run through the income statement. Their growth investments are captured in growing inventory (homes) that are not expensed on the income statement until sold.
Notice how despite free cash flow remaining essentially breakeven historically, there has been significant growth in intrinsic value over the past six years. Change in tangible book value per share is a good proxy for growth in intrinsic value which has grown at a 28% CAGR since 2016 as LGI is able to build and sell more homes.
In 2022 management delayed opening and developing new communities as supply chain bottlenecks resulted in cost pressures and slowing construction cycle times. Given the uncertainty, LGI changed their policy in H1’22 to only selling homes that were within 90 days of closing as opposed to the normal 60 days, resulting in longer sales cycles and selling fewer homes in 2022. Looking forward, management has indicated that demand for homes remains strong and that supply chains are normalizing, permitting them to sell homes within 60 days of closing, allowing them to increase community count 20-30% next year.
|
Source: Company filings, Factset, Saga Partners Note: 2022E values are Factset consensus expectations, market cap and share price are as of 6/30/22.
|
The Trade Desk (TTD)
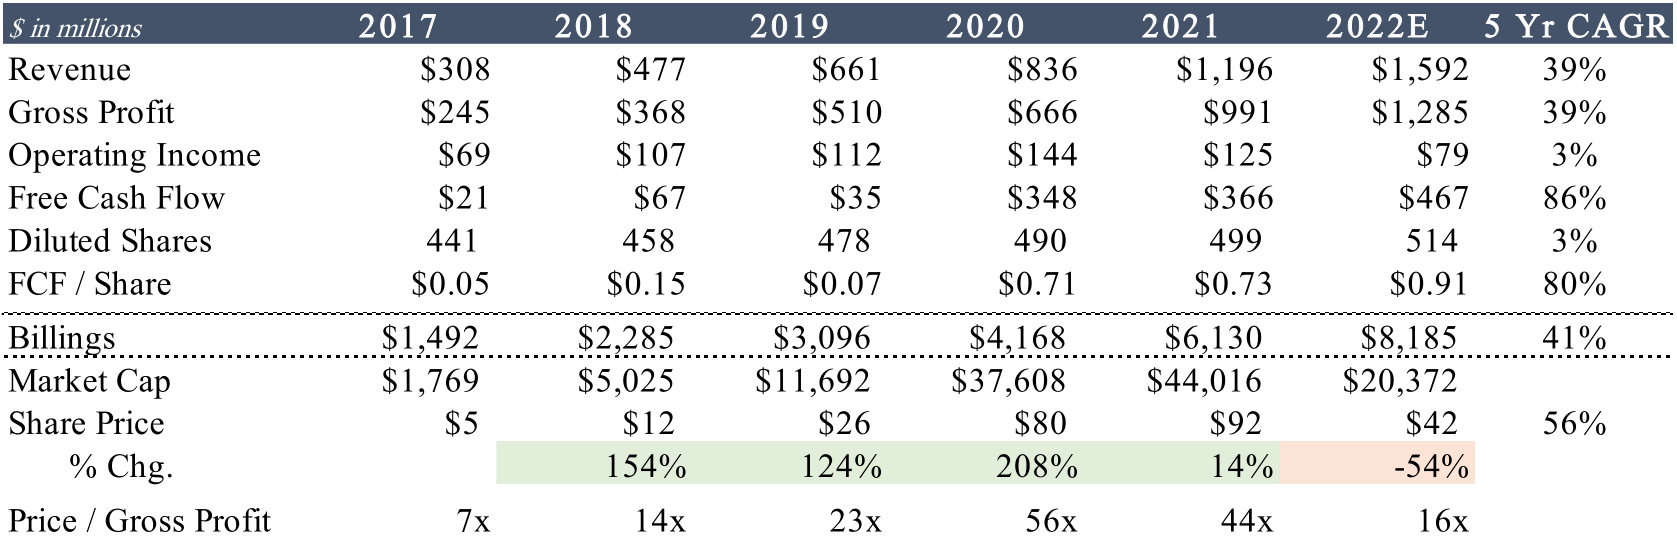
The Portfolio first purchased The Trade Desk in Q4’17. The Trade Desk is a software platform that helps advertisers filter, value, and purchase the supply of digital ad inventory (display, mobile, social, connected TV, connected audio) available across the world. There is a long-term secular trend of more media moving online, providing the advertisers the ability to use data to reach targeted consumers. The Trade Desk provides price discovery for advertisers by using data (programmatically) to value inventory for an advertiser’s specific goals.
In the digital advertising value chain, there is a marketplace where ad inventory is bought and sold. Sellers of ad inventory called sell side platforms (SSPs) run auctions for publisher’s inventory through ad exchanges, selling it to the highest bidder. Buyers of ad inventory, called demand side platforms (DSPs) like the Trade Desk, have to “look” at the auctions being run in order to potentially bid on the inventory for their advertising customers. Programmatic advertising provides the ability for one-to-one targeting using granular data to determine ROI on ad spend.
Trade Desk’s competitive advantage comes from its high operating leverage and economies of scale. In order to be effective, DSPs must look at all available auctions being run. Looking at each auction costs money even if no bid is made. The only way for the DSP to monetize “looking” is to win the auction. However, the more an advertiser pays for inventory, the lower the ROI on ad spend, but too low of a bid would risk losing the auction. Therefore, The Trade Desk helps the advertisers determine how much specific inventory is worth for their specific goals.
The Trade Desk picks inventory for its advertising customers from over 500 billion digital ad opportunities every single day, which is expected to cost over $300 million in platform operation expenses this year. If another DSP had half as much ad spend as the Trade Desk, to be as effective they would still have to look at all 500 billion ad opportunities, but platform costs per ad dollar would be twice as much. This makes it very difficult for a subscale DSP to be profitable.
Alternatively, the smaller DSP could just look at half of the ad opportunities, therefore cutting their auction expenses in half. However, they would have less premium inventory to choose from so advertisers would get a worse return on their ad spend. This naturally gravitates advertisers to the DSP with the greatest scale. Essentially, there is a minimum level of cost that a DSP must incur by looking at all available inventory in the world in order to provide a similar value proposition. This dynamic only increases as programmatic ad inventory proliferates in the future.
There is also a two-sided network effect. It costs SSPs money to send an impression out to bid to each DSP. SSPs only get paid if the impression is sold. Therefore, SSPs only want to send impressions to the DSPs that are most likely to win the auction. They concentrate bid requests to the scale DSP buyers like The Trade Desk. Then The Trade Desk can pick through all the available inventory, bid on the highest-return impressions, and refine its bidding based on historical prices, which improves return on ad spend and attracts more advertising dollars from its customers.
Advertisers want to use the DSP that has access to the most ad inventory because it increases the chance they will get access to the best inventory for their campaign goal. Having the most advertising customers attracts more inventory, which attracts more advertising customers.
While The Trade Desk has established itself as the dominant independent demand side platform, growing its relative advantage each year, it does trade for a high multiple based on recent fundamentals. When valuing The Trade Desk, question is how many ad dollars would have to go over The Trade Desks platform to justify a $20 billion market capitalization?
Long-term, global ad spend will continue to grow in line with the global economy, digital ad spend will grow as a proportion of total ad spend, and all digital ad spend will be allocated programmatically. For market perspective, global advertising spend was $780 billion in 2021, digital advertising made up nearly $400 billion of it, and programmatic advertising made up nearly $45 billion of digital. The Trade Desk is expected to have ~$8 billion of ad spend in 2022.
Over the next five years, programmatic ad spend is expected to grow at a 15% CAGR, reaching ~$120 billion by 2028. The Trade Desk should continue to take share of programmatic ad spend going forward rising from an expected ~16% share in 2022 to 25% share in 2028. That would provide gross ad spend on The Trade Desk of $30 billion and assuming a 20% take rate provides $6 billion in revenue, growing at a 30% CAGR.
Operating margins near end state are expected to be ~40% which seem possible given their relative competitive advantage to smaller competitors and the cost structure of their platform business model, providing $2-$3 billion in operating income.
Growing revenue 25-30% from a $1.6 billion base is not the norm when it comes to most businesses. Few have accomplished such feats. However few businesses have had a globally scalable platform like the Trade Desk that benefits from winner take most dynamics. Unlike most linear businesses, it does not get weighed down by size. The bigger The Trade Desk gets, the stronger its business gets. It has high operating leverage which requires nominal costs to support increasing ad dollars to go over its platform.
While the above scenario would result in a highly favorable outcome to shareholders, the big returns will not come from owning The Trade Desk over the next five years, but over the next 5-20 years. $25-$30 billion in ad spend in 2028 is still a drop in the global ad spend bucket. There is a potential future where all digital advertising is allocated programmatically over a single platform and that platform could very well be The Trade Desk, in which case it would be one of the most valuable businesses in the world.
But let’s not get ahead of ourselves, for that to happen the major digital media company walled gardens Alphabet, Meta, and Amazon, which control about 2/3rd of digital advertising, would have to come down and be part of the open internet, but that is a topic for a different letter. For now, we are happy holding on tight to our shares for what is bound to be a volatile but likely very lucrative journey.
|
Source: Company filings, Factset, Saga Partners Note: 2022E values are Factset consensus expectations, market cap and share price are as of 6/30/22.
|
Trupanion (TRUP)
The Portfolio first bought Trupanion during Q3’18. Trupanion provides pet insurance to help owners budget for vet expenses if their pet needs care. While pet insurance has historically been a bad product with confusing, if not misleading, coverage that left pet owners and veterinarians distrustful of pet insurance, Trupanion simplified the product by providing comprehensive coverage and increased transparency to help customers and vets understand the value proposition.
Trupanion’s competitive advantage primarily comes from being a low-cost provider. It integrates all the parts of the value chain that matter which creates efficiencies and a better customer experience. Unlike most competitors, Trupanion underwrites its own policies and doesn’t reinsure their policies. They have their own call centers, a national salesforce of Territory Partners, and process their own claims. The combination of these efforts reduces operating costs by ~20% relative to peers.
These savings are used to offer customers higher payout ratios (~70% of premiums earned are paid out in vet claims) compared to an average of 50% for peers. This naturally attracts more customers over time which helps Trupanion scale operating costs further, which can further be share with customers. Other factors like the relationships that Territory Partners have with vets and hospitals, which typically take 2-3 years to build through repeated visits and its integrated automated claims software called Trupanion Express all feed into building its durable competitive advantage.
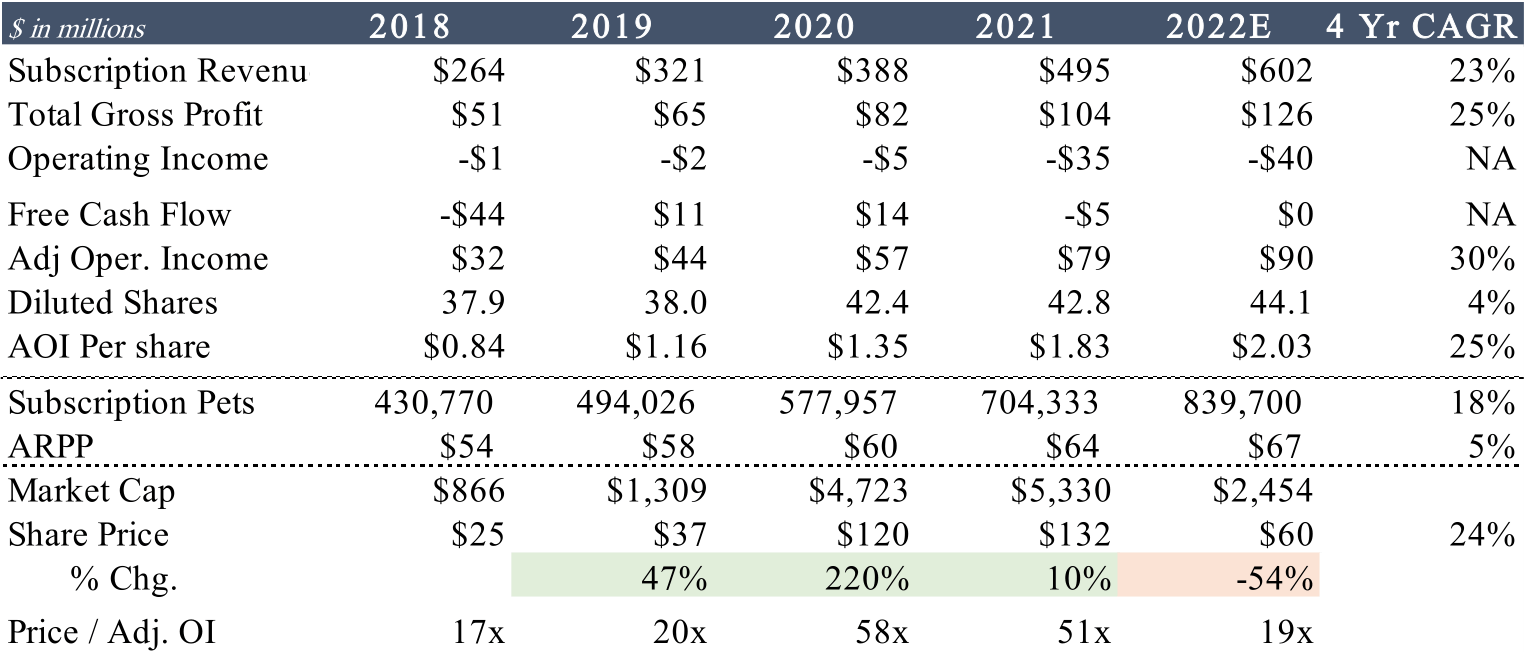
From a financial performance perspective, Trupanion’s operating results have almost perfectly matched my initial expectations from four years ago. They have grown subscription pets at an 18% CAGR and average revenue per pet (ARPP) at a 5% CAGR, providing a 23% subscription segment revenue CAGR. Their business model has proven to be very predictable.
I also want to note that Trupanion’s financials are a great example of a company that is investing through their income statement which results in no GAAP earnings and essentially breakeven cash flow. Trupanion spend a lot on growth marketing spend but should be viewed more as an investment to acquire an asset (new pet subscription) that lasts on average seven years. Therefore, current GAAP earnings are a poor reflection of Trupanion’s earning power today. A better reflection of earning power is operating income before pet acquisition spend which is adjusted operating income in the chart below.
A test of whether they are actually earning a strong return on their investment marketing spend would be if they continued to invest available cash flows today yet experienced no growth in new pet subscriptions. This would indicate either bad investments or the need to invest so heavily to simply run-in place, suggesting a much lower earnings power. However, with only a ~2% penetration rate in North America vs. 5-25% in many other developed nations, and Trupanion’s strong track record of earning a 30-40% ROI on pet acquisition spend, the company should continue to invest as much as possible to grow earnings power far into the future.
|
Source: Company filings, Factset, Saga Partners Note: 2022E values are Factset consensus expectations, market cap and share price are as of 6/30/22. Adjusting operating income is operating income from existing pets before pet acquisition spend.
|
Meta Platforms, Inc. (META)
(Meta formerly known as Facebook, when I discuss the social media apps specifically, I’ll still refer to Facebook)
The Portfolio first bought Meta in Q4’18. It was a controversial investment then and has continued to be to this day. The core mission of the company has been to make the world more open and connected. To do that, it needs to connect everyone in the world, which it largely has done with its nearly 3 billion monthly active users across its family of apps (Facebook, Instagram, and WhatsApp). That type of scale is hard to grasp and is getting pretty close to essentially every smartphone user outside of China and Russia.
From an investing perspective, there are questions surrounding Apple’s iOS App Tracking Transparency (ATT) changes that limit sharing user data across apps, investments in virtual reality (VR) and augmented reality (AR) i.e. the metaverse, and competitive threats surrounding the rise of TikTok. It seems like only yesterday (or last year) that one of the major risks of Facebook was that the company was too powerful, had too much influence on public opinion, and faced antitrust and regulatory concerns.
There has been a lot of focus on the investments in the metaverse. My high-level thoughts are that the digital evolution has progressed from text, to pictures, to video, and will progress to virtual reality into the future. This trend seems inevitable as technology advances because that is a better way for people to interact digitally, just as pictures were better than text. Like other digital ecosystems, there will be an operating system in which other programs are built upon and Meta is attempting to build it. If the company is successful in its efforts, it would likely enable massive economic value. However, our investment in Meta does not depend on its success in the metaverse.
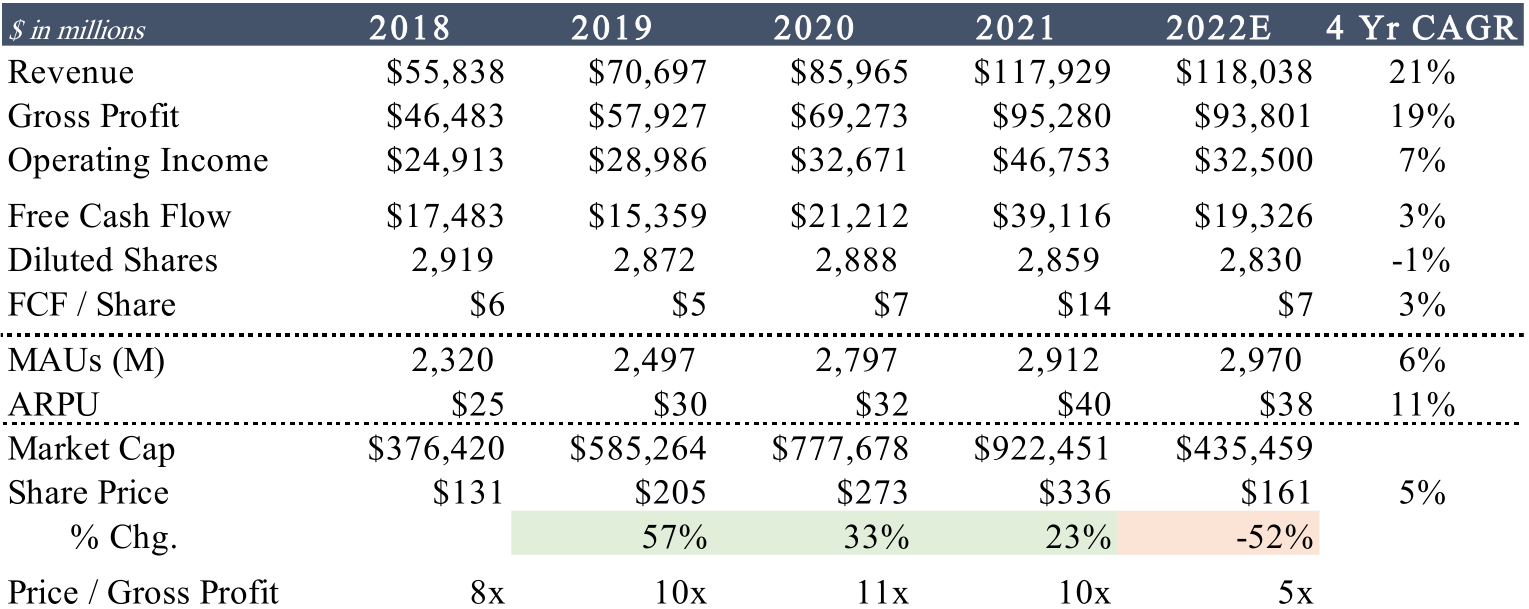
From a financial standpoint, Meta is expected to lose/invest ~$14 billion in its Reality Labs segment in 2022. While that is a big investment, it’s not a “bet the company” type of investment, making up ~12% of the $118 billion in expected revenue in 2022. Meta is expected to have $20 billion in free cash flow this year after spending $30 billion in capital expenditures. This is also a year they are facing an estimated ~$10 billion revenue headwind from Apple’s ATT changes, migrating user engagement to the currently less monetizable Reels from Stories, and seeing a pullback in advertising spend due to general economic uncertainty.
If this is what Meta looks like under financial difficulty, then I can only imagine what they will look like when there aren’t as many headwinds (we can look to 2021 for an idea, which had ~$39 billion in free cash flow after spending $10 billion in Reality Labs and $19 billion in capex).
Reality Labs aside, the overarching thesis is that Facebook is the dominant social media company. Questions surrounding its durability, competitive threats, and whether it is “cool” will likely continue. However, I think the durability of Facebook’s competitive advantage is stronger than what the market appears to believe.
The demand or “job to be done” of having a digital identity/profile will continue to exist far into the future and I do not see any other company able to do that job better than Meta. Similarly, LinkedIn may not have the best interface or content, but there is a demand for a professional online identity.
People discussing that they never use Facebook or Instagram is almost a sign of just how prevalent it is throughout society. Those that leave the platform often find themselves sucked back in because their children’s school posts updates on snow days and bus schedules on their Facebook group or they want to sell their old workout equipment and Facebook marketplace is the best place to go.
Facebook has become more of a social utility that is difficult to replace, not a viral sensation with the risk of crashing. If for some reason Facebook were to shut down, another company just like Facebook would take its place because there is a demand for its platform to provide a digital profile that connect to one’s social network. However, now that Facebook exists, trying to recreate it is nearly impossible. Let’s not forget the many attempts to displace it including Google’s direct attempts with Orkut (2004) and then with Google+ (2011).
Most recently, TikTok has had a meteoric rise to over one billion global users and presents a potential competitive threat. The disruption by TikTok has been different from prior social media companies such as Twitter and Snapchat because its content-filtering algorithm is not based on one’s social network (in which Facebook has the obvious advantage) but by an AI recommendation engine. Video does not come from your social network but from anyone on the platform where algorithms filter and surface the most appealing videos.
AI content generation is a massive computational undertaking. The companies with the most data and the greatest amount of computing resources are going to have an advantage in making the shift more quickly and effectively. Over time, the ranking algorithm turns into a machine learning-driven model that is constantly iterating based on every click and linger.
It isn’t perfectly clear to me how much of a threat TikTok really is. Facebook is clearly investing a lot of resources (roughly $30 billion in capex largely to expand its data centers in support of its AI infrastructure). I think at worst for Facebook, TikTok establishes itself as the winning short form video entertainment application potentially competing more directly with YouTube. That would obviously decrease Facebook and Instagram’s potential engagement inevitably decreasing ad inventory, and therefore, earnings power.
I think at best, Facebook uses its substantial resources to invest in its AI capabilities, incentivizes great user generated content, and is able to make Reels as successful as Stories was for them. Given their willingness to invest for the long-term by creating tools that are less monetizable today, plus the ability to combine AI capabilities with their social graph, Facebook has a good chance of building a very successful recommendation engine that can be applied across all of its applications.
Sentiment from both the general public and Wall Street has continued to be negative on Meta. From a public good perspective, I understand there are many negatives to social media and the interactions that may happen on Meta’s different platforms. However, I am in the camp that in aggregate, Meta and its platforms are a net positive to society and the economy, albeit with some much-needed regulation and controls. Meta helps connect the world, exchange information, communication, services, and goods which enhances economic output.
An analogy would be that the formation of a city increases the rate of crime, pollution, and disease. However, those negatives are more than offset by the increase in social interactions, trade, and prosperity, and with enough time and effort those problems can be tackled through further technological innovations.
From an investing perspective, it is very difficult to find a company that is the leader in their space, has jaw droppingly attractive financials, yet is so widely disliked by the investment community. I think looking back in 10 years, people will be wondering what the market was thinking by valuing Meta at its current price; not completely dissimilar to Apple circa 2013. However, it is in our best interests as long-term owners for Meta shares to continue to decline as Meta has the cash flow to buy back shares at what appears to be far below intrinsic value…just not our shares.
|
Source: Company filings, Factset, Saga Partners Note: 2022E values are Factset consensus expectations, market cap and share price are as of 6/30/22.
|
Carvana (CVNA)
The Portfolio first bought Carvana in Q3’19. I wrote about the Carvana investment thesis last quarter so I will try to keep my comments brief, although it has been the largest stock price decline and biggest impact on our results year-to-date so it deserves some further discussion.
Looking out into the future it seems inevitable that more used cars will be bought and sold online. If we break down the ~40 million used cars that are sold each year, it seems probable that ~5-10 million of that total will be bought/sold online. In fact, one could argue a higher share given how much better the entire customer value proposition is in terms of selection, lower online retail cost structure at scale, and overall buying/selling convenience and experience. However, that would require addressing older and higher mileage cars and more off-lease vehicles.
E-commerce and much of the internet-related services have a winner-take-most type dynamic. Having the greatest selection and infrastructure provides a better customer value proposition, which drives more demand, enabling greater selection and infrastructure investment. There is typically little room for a number two player within the same vertical offering a similar service, especially if the leader has a strong head start.
In the used car market, selection is not the only major problem to be solved for customers. If it were, CarGurus would take the cake. Buying and selling used cars is full of customer pain points. Solving them takes the ability to seamlessly integrate a wide selection of vehicles that customers can trust are the actual quality that they expected at purchase, convenient and consistent delivery, streamlining financing of a high-priced item, all in a self-service intuitive consumer interface.
Carvana is building what is truly an impressive and difficult-to-provide integrated customer value proposition. However, this means little if Carvana is not able to reach scale because of the massive capital requirements needed to build this infrastructure as well as endure operating losses until reaching scale.
Its service requires building inspection & reconditioning centers (IRCs), inventory levels, its transportation network, technology in car buying/pricing, the user interface, and advertising which all require a ton of upfront capital. The difficulty with a company like Carvana is that it essentially needs to be a nationwide business from day one. To be successful, its service needs to be available everywhere and therefore has to scale fast.
In the last letter, I discussed how retailing has evolved over time into ever higher operating leverage business model which requires greater initial capital investment. At scale it can provide greater inventory turns at lower gross profit margins therefore attractive returns on invested capital. Walmart required more upfront capital than a mom & pop store but was still able to realize attractive store economics relatively quickly. Amazon required much greater upfront investment to provide its service across the country.
Even CarMax, which is widely considered to have attractive economics for its industry, had a somewhat disruptive and more capital-intensive model compared to traditional used car dealers. When it was trying to scale its service and systems in the 1990’s, it incurred seven years of initial losses before reaching profitability, financed by its parent company Circuit City.
Up through 2021, Carvana was blitzscaling as it grew unit volumes and the needed infrastructure as fast as possible. Customer demand for Carvana’s service was not the issue, it was having enough supply to be able to serve growing demand. Management prepared and hired for anticipated demand about six months in advance which worked well until Q1’22 when industry-wide used car volumes began to decline.
When combined with winter storms, a resurge of COVID leading to high workforce call-off rates, and a rising rate environment squeezing the spread on their financing gross margins, Carvana experienced unexpected losses.
On top of the Q1’22 losses Carvana acquired ADESA in May, further leveraging its balance sheet by raising $3.3 billion of debt. The acquisition price appears high if compared to the $100 million it brings in expected EBITDA. However, the cost savings to Carvana by having the ADESA locations, particularly throughout the West Coast and Midwest, is material. For example, California currently makes up around 10% of the used car sales within Carvana’s existing markets but the closest inspection and recondition center (IRC) is in Phoenix.
The closest IRC to Washington or Oregon is Salt Lake City. Delivering a car from Phoenix to a market in California could be up to a 1,500-mile round trip depending on the market. Delivery costs and transport times can be substantial. IRCs that are within 200 miles of customers save ~$750 per unit vs. the average transaction.
For markets like California or Washington where customers can be much further from an IRC, savings are even greater. ADESA provides numerous locations throughout the western U.S. that provide Carvana the network density to immediately simplify last-mile delivery and eventually fill out its IRC network much faster than previously possible.
If there truly is a winner take most dynamic to online used car retail and this is a very large market to address, then acquiring ADESA’s attractively located properties today makes a lot of strategic sense for long-term success. Carvana’s total operating losses do not provide a clear picture of the growing value of the company and its true earnings power. What is far more insightful are the unit economics and whether there is a strong customer value proposition with earlier cohorts providing early indications of reaching positive EBITDA margins.
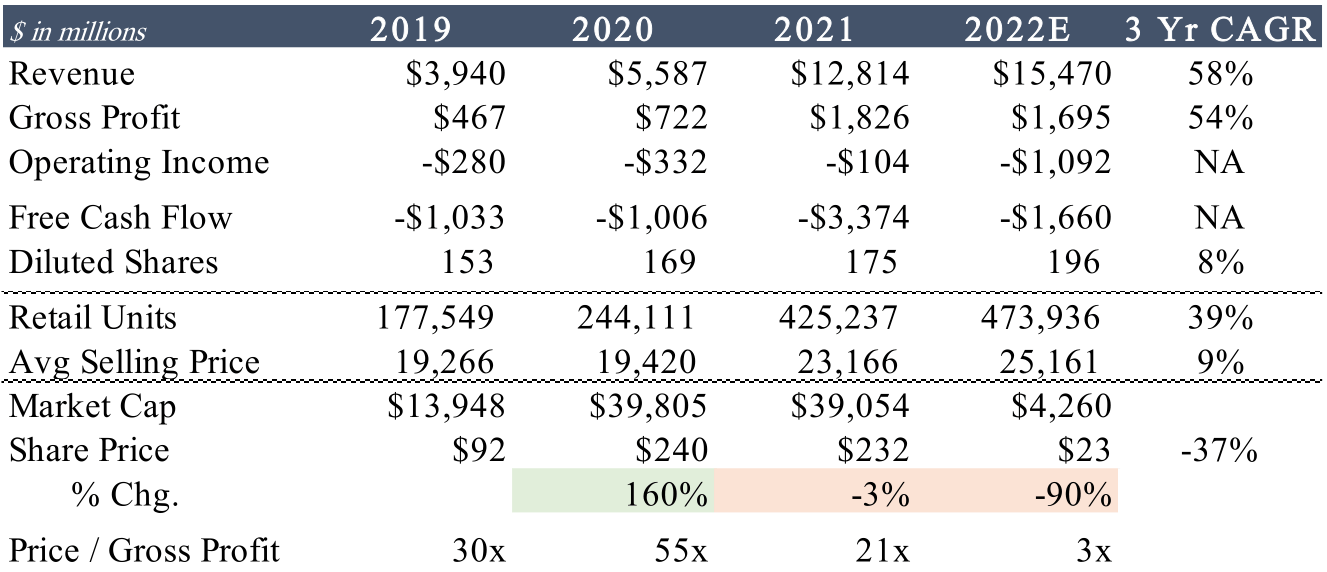
Of course, Carvana must get to scale to succeed and therefore requires capital to bridge the time until cash flow from operations is more than sufficient to support the company. After raising $3.3 billion in debt and $1.25 billion in equity in Q2’22, Carvana has $1 billion in cash and $4.7 billion in liquidity. Even during a prolonged macro weakness in used car sales, Carvana faces little solvency risk with enough liquidity to maintain operations for at least 2-3 years without needing to raise further capital.
We are not investing in Carvana today and expecting it to pay us dividends within the next year. We are investing in Carvana today because we want to own a piece of a company that is highly likely to be the dominant online used car retailer far into the future. If that scenario unfolds over the next decade or two, the dividends that Carvana will be able to pay out to shareholders will be multiples of its current market cap.
|
Source: Company filings, Factset, Saga Partners Note: 2022E values are Factset consensus expectations, market cap and share price are as of 6/30/22. |
The Portfolio first bought Roku in Q3’20. It was a company we followed closely given our investment in The Trade Desk and its importance in connected television (CTV). Roku continued to impressively grow its CTV market share and it took some extra work to understand the underlying dynamics causing Roku’s success. I think there is some misunderstanding surrounding the connected television landscape. Since I haven’t written extensively on the topic in past letters, I thought it would be helpful to provide a little more background on the underlying dynamics of the space below.
Connected Television
The Internet has impacted media across different mediums. Newspapers, magazines, and music content have transitioned to digital with consumers able to access any content they want when they want it. Television has been slower to make the transition to internet distribution compared to other media but remains one of the preferred ways to consume content with the average American watching more than four hours of television a day.
The transition to the internet took long for several reasons. Households had to adopt high-speed broadband internet access which is required to stream TV. Older televisions could not connect to the internet and the average TV is replaced every seven to eight years. Therefore, consumers needed to either purchase a device/dongle to connect their TV or wait for the slower replacement cycle when they purchased a new smart TV.
Finally, the legacy cable networks that aggregated quality programming were slow to shift content online because it conflicted with the cable operators that distributed the content to households. Cable operators (Comcast, Charter) pay the cable networks (Fox, CNN, TNT, ESPN, MSNBC) for content to sell cable subscriptions to households. If the cable networks made their content available over the internet, cable companies could lose subscribers and therefore would hurt their revenue streams.
Advertisers were also hesitant to move to a new unproven medium, therefore offering little economic incentive to move content to streaming, at least initially.
Fast forward to today and CTV adoption has accelerated as most households have high speed internet, nearly all TVs are smart TVs, and premium content has transitioned to streaming with the last holdouts (live sports and news) finally moving to streaming.
Much of the focus on CTV has been on the streaming wars – the content battle between services like Netflix, Disney+, Hulu (owned by Disney), HBO Max, Paramount+, etc. While an increasing amount of capital is being invested in generating content to win subscribers, the real battle is over the TV operating system (TV OS). The TV OS will own the direct-to-customer relationship, data, and be best positioned to capture value from the TV value chain. One user interface for all content. The question is how will the TV operating system play out?
Netflix was the first mover to stream content over the internet by launching its service in 2007. At the time, the only way to stream TV was over a personal computer, game console, or DVD player. Netflix was working on a set-top box technology that could connect TVs to the internet.
However, management believed it would create a conflict of interest with other hardware providers that they wanted to support their streaming service. Netflix decided to focus on providing its content to all available players as opposed to owning a player that aggregates all the content. They spun out the technology in 2008, which then became Roku. Netflix would be available on Roku, letting Netflix offer its service on other connected devices while Roku could stream content from other providers on its device.
Following Netflix’s initial success, other streamers like Amazon Prime, Apple TV+, and Disney+ entered the market. The streamers (like the legacy cable network channels) became content aggregators for viewers. As a growing number of streaming services have become available over the last 15 years, it has provided the opportunity for devices to manage the different streaming apps.
Customers bought streaming players/devices to connect their TV to streaming. Roku, Amazon’s Fire Stick, and to a lesser extent, Google’s Chromecast, were initially successful at selling streaming players with simple and user-friendly interfaces that navigated an increasing number of streaming apps.
Television Operating System (TV OS)
While streaming devices initially enabled TVs to connect to the internet and stream apps, TVs now come with a built-in operating system. The TV has become a computer that runs third-party software. In computing ecosystems, there must be a central core around which the software and hardware are built upon called the operating system. It is like the conductor of an orchestra of software that runs computing devices such as PCs, smartphones, and increasingly, connected TVs. The OS sets and enforces standards, acting as the controller of ecosystems.
The natural economics of operating systems move towards concentration because of its two-sided network effect where third-party software application developers want to reach the most consumers, and consumers want the system with the most/best applications.
Connected television is following the path of Aggregation Theory which states that when it comes to digital goods distributed over the Internet (CTV content), whoever aggregates the direct relationship to consumers is positioned to generate the best returns in the value chain. Initially, aggregators must win customers by offering the best user experience by eliminating frictions and often initially subsidizing customer adoption. As the aggregator grows its customer base, digital supply wants access to those customers.
As more supply is available, it offers customers more value and creates a self-reinforcing two-sided network effect. Platforms that can best source, filter, and provide the best user experience can gain a foothold and build a dominant position in the value chain.
The best positioned companies are the ones that can control the TV and entire user experience by aggregating the aggregators. Search, discovery, and even filtering content is increasingly important to viewers. A major pain point is surfacing content for each user to watch without them having to endlessly scroll through numerous apps and channels. The best way to accomplish this is by licensing the OS to all the TV OEMs. As in following Google’s mobile playbook with Android mobile as opposed to Apple’s integrated iOS strategy.
TV OEMs must decide if they want to develop their own OS internally or license from a third-party provider. Early versions of TV OEMs that developed their own OS had poor user experiences, therefore viewers often purchased a streaming device. When it comes to purchasing TVs, hardware increasingly become “good enough” while the software/user experience is the problem to solve. Screen technology has become more commoditized with similar quality across OEM brands, therefore price has become very important when choosing between two similar quality TV brands.
If the TV OEM’s OS is not good enough, consumers have the ability to pick the TV based on screen size/quality and then switch to the TV OS of their choice by purchasing inexpensive dongles which provides the TV OS’ that have early leads with a big advantage. The question is if customers care about the TV OS they use? Can the largest TV OEMs like Samsung and LG establish a large enough userbase to justify the costs to invest in their own OS?
As it stands today, there are six main TV OS players: Roku, Google TV, Amazon’s Fire TV, Samsung’s Tizen, LG’s webOS, and Vizio’s SmartCast. It is possible for all six to exist in end state and benefit from the long secular tailwind of CTV, but it is more likely that the TV OS will continue to consolidate and likely have an end state with maybe 2-3 major players. It is likely that the winning TV OS’ will have to license their software so that it available on any TV OEM hardware since consumers likely own multiple TV brands within one house and will prefer a single user experience.
It is possible for a TV OEM like Samsung to establish a large enough footprint to remain feasible, like how Apple did with the iPhone’s iOS. However, TV hardware is less differentiated among OEMs than the iPhone’s initial offering and therefore unlikely that a TV OS that is not licensed and available across numerous TV OEMs will be successful. Smaller to mid-sized OEMs that have attempted to build in-house OS’ have continued to lose share to OEMs that license their OS
Roku began licensing their OS in 2013 to smaller Chinese OEMs like TCL and Hisense who quickly gained share in the U.S. market with their low-price points and Roku’s user friendly interface. from a third party (Roku, Google TV, or Amazon Fire TV). Amazon has had less success licensing its Fire OS.
One potential reason is there are about four major retailers that sell the majority of TVs in the US (Walmart, Best Buy, Costco, and Target) and they view Amazon as their arch enemy. Therefore, TV OEMs have been hesitant to license Amazon’s Fire OS which may explain Amazon attempting to build its own branded Omni TV. Google, which has had less success in its streaming devices but more success licensing its Android TV OS, recently rebranded to Google TV.
However, there are a lot of inefficiencies in a value chain that has multiple operating systems. It takes significant resources to develop the software, support the third-party content supplier’s software development, and sell the ad inventory to advertisers.
The longer seven-year average life cycle of the TV can work in Roku’s favor as it already established a strong lead. It is common for households to have multiple TVs from different OEM brands. Having a single OS throughout the house provides a better user experience so when you stop watching a show on the TV in the living room, you can pick up where you left off on your bedroom TV.
The Streaming Content
Some believe that the top streaming apps will scale and spend so much on content that they will push out smaller media companies with inferior content spending. If viewers consolidate in a small number of large streaming apps, this decreases the amount of value that Roku could capture as a distributor of content. I think over the long-term, streaming services will have a more difficult position than the TV operating system. The streamers must win consumers every single month by continually investing in new content. The TV operating systems like Roku only have to win the consumer once.
Netflix and Disney are unlikely to be able to create their own connected devices or license operating systems and therefore will become increasingly reliant on the consolidating distributors of their content. Historically, Netflix benefitted from controlling content supply and having the direct-to-consumer (DTC) relationship. Going forward Netflix will increasingly lose the DTC relationship to whoever controls the television, and more specifically the OS on the television.
While the large streamers will likely play a big part of future TV viewing, no single streamer will be able to monopolize the industry. Sports and news alone will be offered over multiple streamers. If no single stream can monopolize TV, then there will need to be an aggregator to help bundle it. As consumers are maxed out on the amount they pay in subscription, free advertising-based content will become increasingly important to monetize content.
Advertising depends on maximizing reach and therefore the scale of the TV OS becomes that much more important to monetize content. Content supply, advertising dollars, and viewers will continue to migrate to the largest platforms that have the greatest reach and data.
There have also been questions surrounding Roku’s original content efforts as they build out The Roku Channel (TRC). There is a misconception that they are trying to compete directly with the likes of Netflix and Disney+ in the intense streaming wars. Roku’s motivation is to win control over the TV viewing experience. TRC provides the ability to incorporate all free content on one user interface. Paramount+, Disney+, and CBS All-access content can sit side by side as opposed to hidden behind apps that viewers must click through.
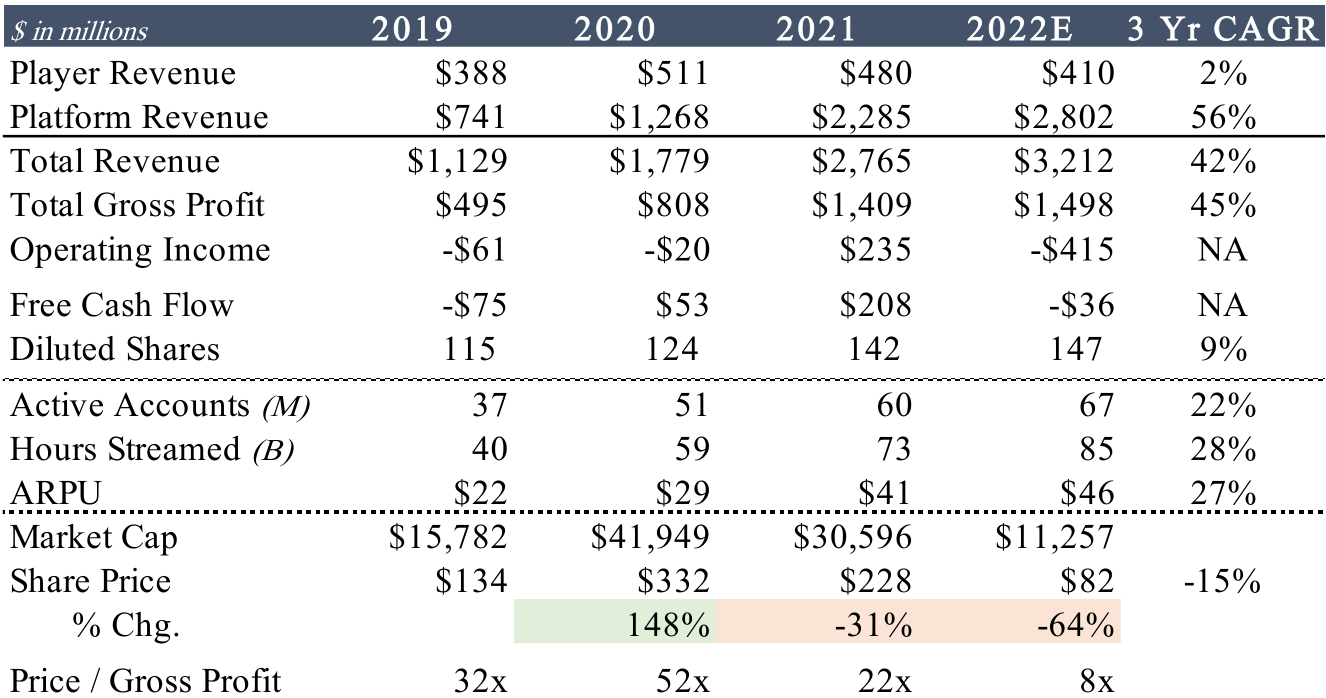
Investing in Roku Original content is to improve the content quality available on the app, thus drawing more viewers to TRC, providing third-party content suppliers’ incentive to plug into TRC without needing to invest in their own app or build their own audience. TRC now has over 200 licensed content partners and is growing at double the rate of the rest of Roku’s platform
Conclusion
It is inevitable that the future of TV will be CTV. Advertising dollars will move from linear TV to CTV. Total ad spend in the US is expected to be over $80 billion in 2022, with linear making up nearly $70 billion of it. It seems highly likely that TV operating systems will continue to consolidate with just a few remaining at end state.
All of CTV ad spend will have to go over the remaining TV OS’ and the OS’ will earn their take rate. Given their current reach, the most advantaged players to be those end-state winners are Google TV, Roku, and potentially Amazon Fire TV if they find a way to more successfully license their OS or sell enough Amazon-built TVs to establish a large enough userbase.
The TV OS’ with the largest user base also provides it with more bargaining power over content suppliers, providing it either with a higher take rate of ad inventory or subscription revenue share. They will have the widest reach, better user data, content discovery, and therefore, targeted ads. They will be able to earn higher CPMs on ad inventory and therefore show fewer commercials per hour, providing a better viewing experience for ad supported content.
In their most recent results, Roku reported softer advertising dollars as nearly half of advertisers paused ad campaigns in response to macro uncertainty. While advertising will come and go, the key is that Roku can continue to gather eyeballs and then the rest will work itself out in the long run. In my opinion, the market is underappreciating the power of Roku’s competitive advantage in the TV ecosystem and ability to scale far into the future.
|
Source: Company filings, Factset, Saga Partners Note: 2022E values are Factset consensus expectations, market cap and share price are as of 6/30/22.
|
Redfin (RDFN)
The Portfolio first bought Redfin in Q2’21. Redfin’s competitive advantage stems from its ability to integrate the demand aggregated from their web portal with full-time salaried agents. Because Redfin agents do not have to prospect for demand, they are more productive than traditional agents, providing Redfin with a lower cost per transaction compared to traditional real estate brokerages.
The two other major real estate web portals, Zillow and Realtor.com, have different business models where third-party agents advertise on their website. The web portals do not help agents become more productive but simply generate leads and therefore are part of the advertising costs of the traditional real estate value chain.
With barely a year of ownership, we have not really had enough time to evaluate longer-term trends since first buying Redfin, but in our first year, results have come in below what I would expect long-term trends to be. Since COVID, the housing market has been all over the place. It essentially froze during Q2’20, rebounded in H2’20 through 2021, and has since declined in 2022. Home prices have skyrocketed after COVID as housing inventory couldn’t keep up with demand and reached unsustainable levels as measured by historic values to household income levels.
As mortgage rates have increased, home prices have barely dropped, causing home affordability and demand to drop. The overall housing market has continued to struggle in the first half of the year. Existing home sales continue to fall, with July declining 19% year-over-year. As a result, Redfin’s real estate transactions fell 4% year-over-year in Q2’22, the first decline (with the exception of Q2’20) since being a public company.
Despite the difficult operating environment, Redfin has taken major steps toward reaching profitability. Historically, Redfin has charged lower commissions than traditional brokerages with a 1% listing fee for sellers and rebate given back to buyers after the home sale. However, buyers have proven to be less price sensitive to brokerage commissions since the buyer’s commission is baked into the seller’s contract and therefore not paid directly to agents.
Redfin ran a pilot in 2019 that eliminated the buyer’s rebate in several markets and continued to gain market share. The pilot was expanded in July and if it continues to prove successful, Redfin will eliminate the buyer’s refund entirely in January 2023 which will deliver a 500-basis point of improvement to full year gross profit margins.
RentPath (recently rebranded to Rent) continues to be the largest contributor to operating losses. Given the losses at Rent, it could make one question why Redfin acquired it for $608 million in April 2021 (note Redfin’s market cap was $880 million at the end of last quarter). Costar initially tried to acquire RentPath out of bankruptcy but was blocked on antitrust issues, providing Redfin the opportunity. RentPath reportedly had $50 million in EBITDA in 2019 before COVID (12x Redfin’s acquisition price). Since then, prior mismanagement and COVID have hurt operations, resulting in a ~$70 million operating loss run rate.
From a strategic perspective, having rental listings part of redfin.comis essential to having a “one-stop-shop” real estate firm. There is no easy way to scale rental listings since there isn’t something like the Multiple Listing Service (MLS) in residential homes. Therefore, Redfin would have to add each rental property one-by-one, which would be nearly impossible when there are already large rental sites available; Costar owning the largest one.
I suspect that RentPath has low hanging fruit to improve operations and move towards profitability. Redfin will benefit from integrating rentals on its website, helping Internet real estate search rankings, driving more traffic to its website, and leading to closing more brokerage transactions.
Overall, while Redfin’s recent operating results have been worse than expected, nothing has changed about the attractiveness of its business model or competitive advantage. I believe current weakness is more of a reflection of the difficult macro environment as opposed to weakness in the business model and Redfin is executing well despite the backdrop. I would expect overall home prices to decline to more normalized levels relative to household income which will bring the housing market closer to equilibrium.
A more balanced market should encourage more real estate transactions overall, which would benefit Redfin. I believe current financials do not properly reflect Redfin’s advantageously positioned business model and future prospects.

|
Source: Company filings, Factset, Saga Partners Note: 2022E values are Factset consensus expectations, market cap and share price are as of 6/30/22.
|
Sold GoodRx (GDRX)
The Portfolio first bought GoodRx at the end of 2020. I discussed the initial thesis in the H1’21 Investor Letter explaining how GoodRx is a prescription marketplace. GoodRx aggregates all available prescription prices across pharmacy benefit managers (PBMs). PBMs are the companies that negotiate prescription pricing with pharmacies on behalf of their insured customers. Historically, uninsured patients had to pay excessively high retail cash prices for prescriptions as a consequence of the contracts between pharmacies and PBMs.
Through a discount card provider like GoodRx, consumers could get a coupon to access the much lower PBM prices. PBMs benefitted from discount cards generating incremental demand and earning the administration fees paid by pharmacies. PBMs then shared part of their administration fee with GoodRx.
As the prescription discount card space developed, GoodRx established itself as the dominant company with the second largest company (SingleCare) being about quarter of its size. Part of GoodRx’s success was their patent that enables only them to contract with multiple PBMs on a single interface. This meant that it was likely that the lowest prescription prices for people not using insurance were likely to be found on GoodRx, attracting more customers to GoodRx’s platform, which further incentivized PBMs to offer even lower prices on GoodRx to win that demand.
One of the major risks was with the pharmacy point of sale. Pharmacies have been in an increasingly difficult position with little control over the prescription prices they can charge their customers. PBMs control insured demand and therefore have strong bargaining power when negotiating prescription prices with pharmacies. Pharmacies often have breakeven, if not negative, gross profits on the majority of insured customer prescriptions but historically made high gross profits on uninsured customers who paid the high cash prices. Discount cards like GoodRx now take away those profits.
Prices are the result of negotiations between PBMs and pharmacies, but as GoodRx increasingly aggregates more PBMs, GoodRx directs all demand to the lowest priced PBM which drives prescription prices lower, further squeezing pharmacies. Knowing the difficult position pharmacies were in, I expected that as their PBM contracts are renewed every two to three years on average, pharmacies would push back on PBMs and negotiate sustainable prices.
However, an unexpected scenario occurred during Q2’22 that structurally changed GoodRx’s competitive advantage in my opinion. Kroger was losing too much money on each GoodRx prescription and rather than wait to renegotiate their PBM contracts over the next few years, they decided to stop accepting GoodRx coupons at the counter. It was our understanding that pharmacies must uphold their PBM contracts or else risk losing their entire insured population demand.
However, pharmacies appear to have the ability to simply stop accepting GoodRx, creating a price floor dependent on what a pharmacy is willing to accept. This was a structural change to the business model that was not previously anticipated and resulted in us selling our shares.
Kroger has since started accepting GoodRx coupons again but with renegotiated prescription prices that are much higher than they were previously. This new information on the industry structure potentially places a floor on prescription prices and limits GoodRx’s dominant market position. GoodRx will likely continue doing well due to its dominant market position, brand, and cash generative ability, but I misjudged the strength of its competitive position based on its relative position with pharmacies.
Taking away lessons from the GoodRx experience, I think it is essential to invest in business models that create value for all stakeholders, rather than rely on regulation and contracts to keep them in-line. Healthcare is a huge industry and is plagued with misaligned incentives and inefficiencies. I believed that GoodRx was well-positioned to create change because it created a solution that benefited PBMs and end-consumers that needed help the most, but I underestimated the impact this would have on pharmacies and their ability to respond.
While the Portfolio sold shares far below our average purchase price, resulting in the largest loss experienced in the Portfolio since inception, the only silver lining is that it occurred during a broader market sell-off that provided the opportunity to reallocate the Portfolio to other investments (Carvana, Redfin, and LGI Homes) that are selling at what I believe to be extremely attractive prices.
Editor’s Note: The summary bullets for this article were chosen by Seeking Alpha editors.
Be the first to comment