

Diy13
The prospects for stocks and bonds in 2023 are not great. Consequently, we are over-weighting safe haven investments like precious metals, high-yielding stocks, and money markets. We expect stocks to register earnings declines as the economy slows. How deep the economic slowdown is will depend on the Fed and geopolitical risks like China invading Taiwan. Bonds will likely struggle if inflation is stubborn; but bonds could see a rally if there is a deep recession and or inflation drops meaningfully. The rise in inflation since 2020, as measured by the CPI, has been nearly 8% and should not quickly revert to 2%.
The Federal Reserve’s tightening, which began in March, was implemented after the CPI rose over 7%, and today the Fed Funds rate is still lagging and is below the current inflation rate. Bonds are unlikely to outperform meaningfully unless inflation turns down or there is a severe recession. If the US economy has a meaningful recession the stock market could decline further by 20% or more.
The chart below shows the Federal Reserve could easily raise the Federal Funds rate to 6% simply to exceed the PCE (the preferred inflation indicator used by the Federal Reserve). Furthermore, when compared to other tightening cycles, Fed Funds could easily soar well past 4% and into the 6-8% range depending on how inflation data comes in over the next 12 months.
CPI during Biden (CNN)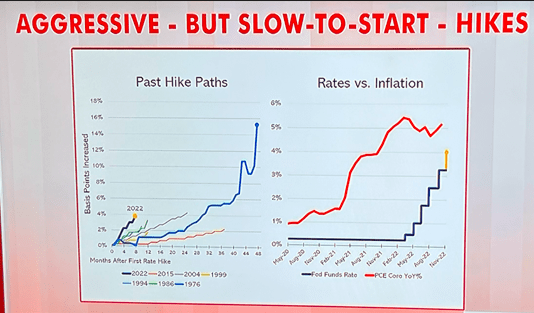
Due to intractable energy prices, supply chain problems, and strong consumer spending buoyed by COVID stimulus payments and durable employment, we do not believe the CPI will revert quickly to 4% as many strategists forecast. Consequently, we are over-weighting precious metals, high-yield stocks, and above-average money market balances, and reducing stock and bond allocations.
Below is a chart showing the rapid rise in the CPI index since January 2021. With tenacious supply chain issues and energy supply shortages, we do not foresee a rapid retracement in inflation.
The CPI since 2020 (U.S. Bureau of Labor Statistics and Fox News)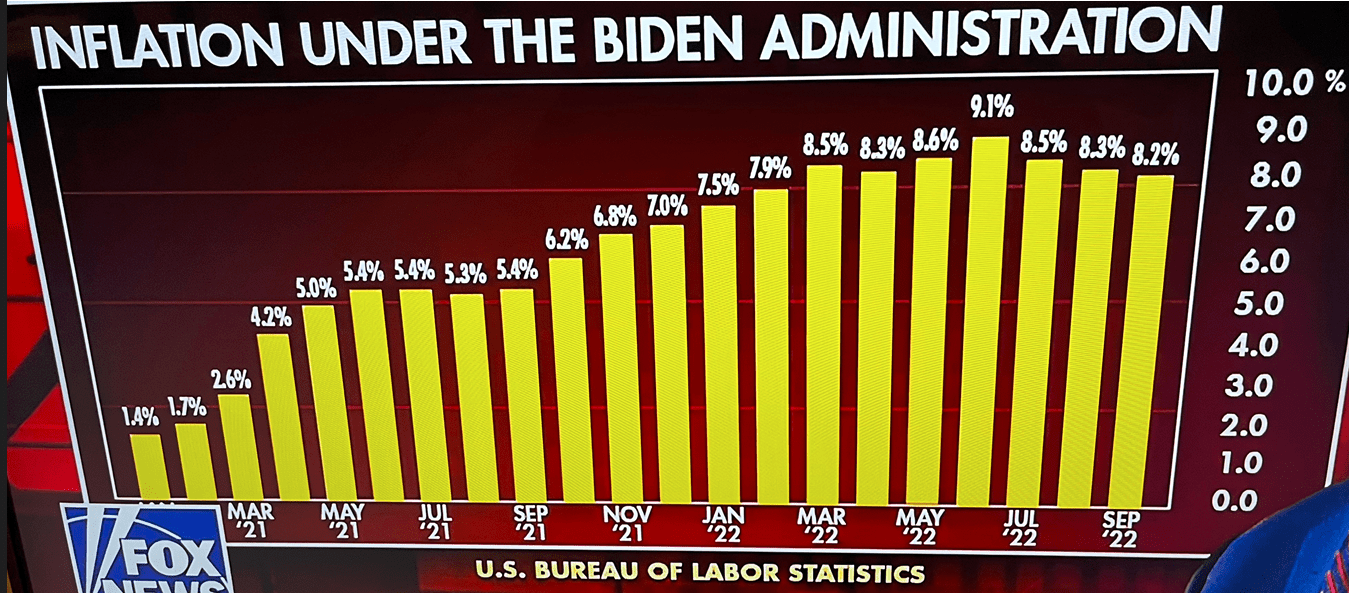
With the Federal Reserve indicating that it will moderate its rapid 75 basis point per meeting tightening pace, the US dollar has weakened 3% in trade-weighted terms this past month, the steepest monthly drop since early 2020. Historically, a weak dollar environment should benefit gold, precious metals, emerging markets, and international investments.
The S&P 500 has proven surprisingly resilient considering the Federal Reserve’s aggressive tightening this year. Currently, the S&P 500 is trading at 17.24 times 2023 earnings of $223.4/share and 18.5 times 2022 S&P 500 earnings of $217.68. With a restrictive Federal Reserve and a probable recession, the S&P 500 is not a compelling investment opportunity, and why we are cautious on 2023 equity return prospects.
What is the Market Downside?
Warren Buffett likes the Wilshire 5000 versus the GDP ratio to give a circumspect valuation of stock prices. The chart below suggests that stocks are overvalued by 28% above the long-term trend of Buffett’s so-called favorite ratio. While there are certainly attractively priced stocks, we believe that we are in a secular decline, and stocks broadly speaking could experience a persistent decline over the coming years similar to the post-bubble mean reversions of 1966-1982 aka “the 1970s” and the 1999-2008 period.
The Buffett Indicator (currentmarketvaluation.com)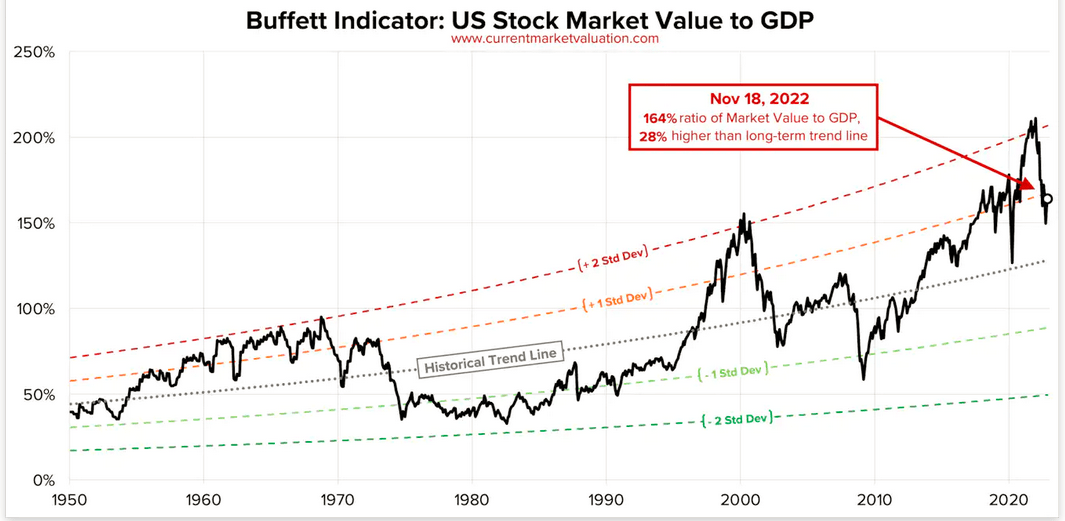
Having enjoyed exceptional technology returns in the 1990s, I have indelible memories of mean reverting and frustrating post-bubble market performance. By focusing on commodity outperformance, sector and asset class rotation in post-bubble periods can dramatically change investment performance. The chart below clearly delineates cycles of inflationary and deflationary markets. Today, with inflation on full display, we are advocating portfolio construction that emphasizes outperforming strategies during inflationary periods.
Inflationary and deflationary cycles (www.longtermtrends.net)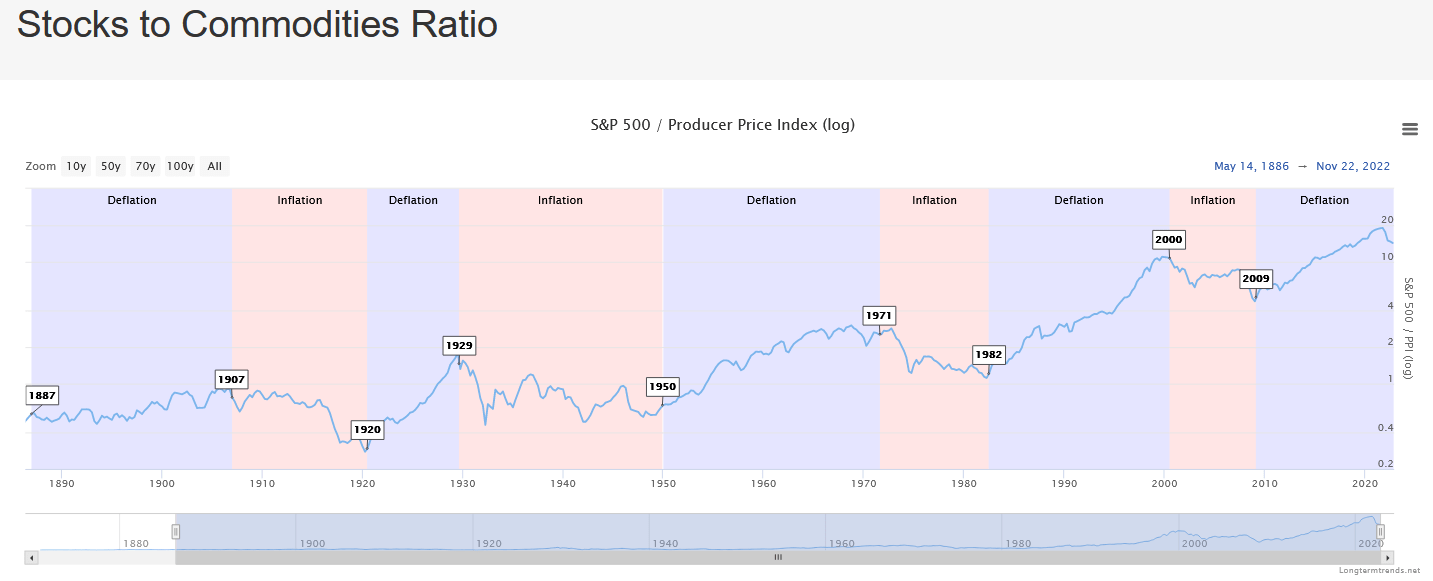
The chart below of the CRB/S&P 500 ratio shows the clear outperformance of the CRB to the S&P 500 during inflationary periods. Commodity outperformance of the CRB to the S&P 500 performance is clearly reflected in a rising ratio in the 1999-2008 period, when oil, gold, emerging markets, small-cap, value stocks, and international markets outperformed the S&P 500.
Consistent with the resurgence in inflation since 2020, we have seen oil prices and commodity prices rise sharply. Furthermore, this year’s poor equity market performance mirrors the disappointing performance of the S&P 500 from 1999 to 2008. The CRB S&P 500 ratio below rose from 0.10 to 0.72, a move which implies commodity outperformance on the scale of 700% over 10 years.
The CRB/S&P 500 ratio showing inflationary periods (IGA research, trendsurfer.com)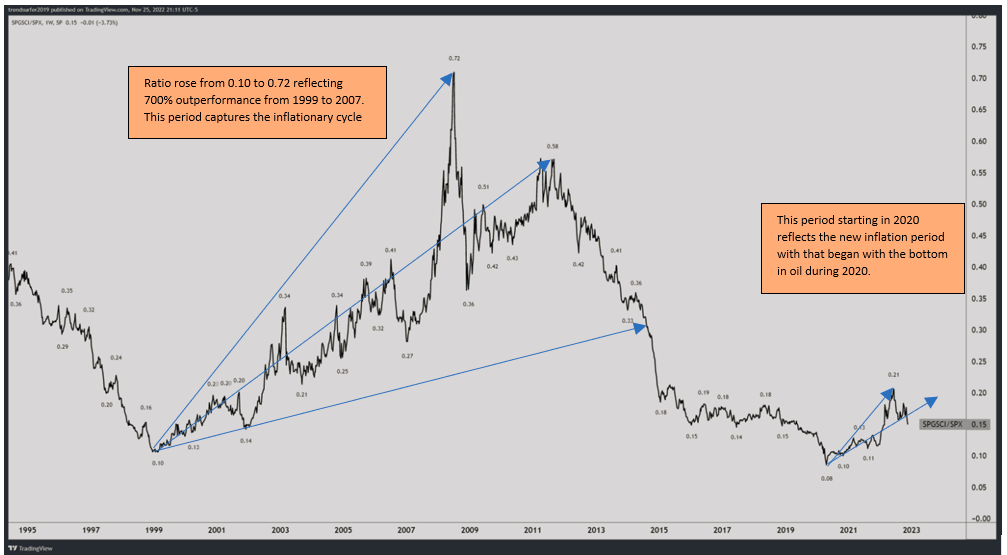
The Case for Gold
Historically gold is a store of value and currency. Gold is fungible and has an excellent reputation for retaining real value, especially during inflationary periods.
Much like our successful recommendation of gold in September 1999 until August 2020, our current rationale for gold is based on the unattractiveness of the much larger equity and bond markets. Money must flow somewhere, and today’s market provides gold and precious metals as credible alternatives to stock and bond investments. While stocks and bonds do not offer attractive expected returns, gold is a recognized store of value with an excellent inflation hedge reputation. Furthermore, the last eight months of aggressive Fed tightening has strengthened the dollar and weakened gold prices, creating an attractive entry point for gold or precious metal investors.
The chart below of the GLD SPDR Gold Shares shows our 2019-2020 timely recommendation for gold and precious metals and the recent Federal Reserve tightening induced pullback in gold prices. Readers who review both letters will see the impressive performance of those recommendations from the time of writing “In the 11 months since our letters: GLD – the SPDR Gold Trust – rose 35%, GDX – the Van Eck Gold Miners ETF – rose 55%, and SLV – the iShares Silver Trust – rose 55%. (Period from Sept 9th, 2019 to August 7th, 2020.)” I remain similarly confident in the potential upside for gold and precious metals but believe that the next seven years could produce more significant returns on the scale of the CRB/S&P 500 700% outperformance ratio cited previously.
Another reason to be encouraged about gold’s prospects is John Paulson’s interview with David Rubenstein earlier this year. Paulson best known for his 800% returns buying CDOs and CDSs on mortgages before the Great Financial Crisis, told Rubenstein that in the 2008 crisis the Fed Liquidity went to repair bank balance sheets. This Covid Crisis financial injections, alternatively, went into individual’s wallets and this could lead to a durable run in gold.
5-year chart of gold (GLD) (IBKR Trader workstation, IGA research)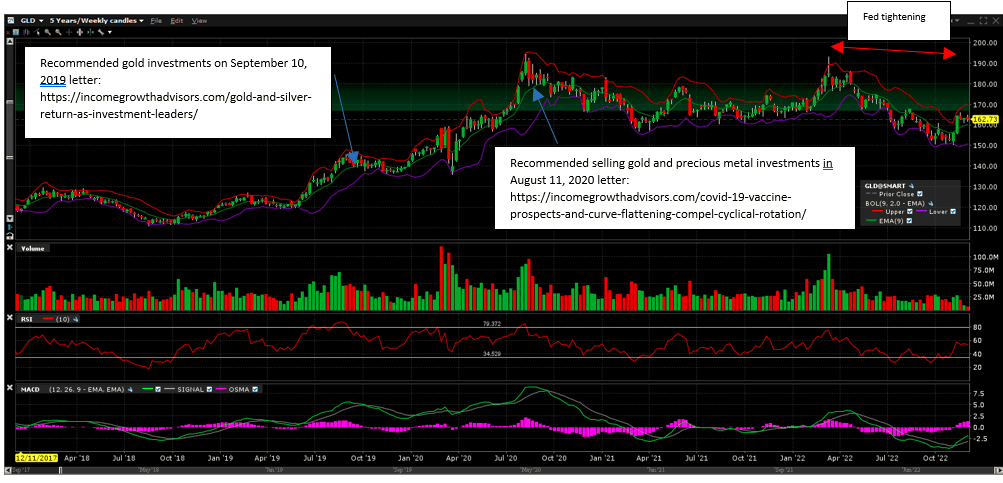
Gold and the Dollar
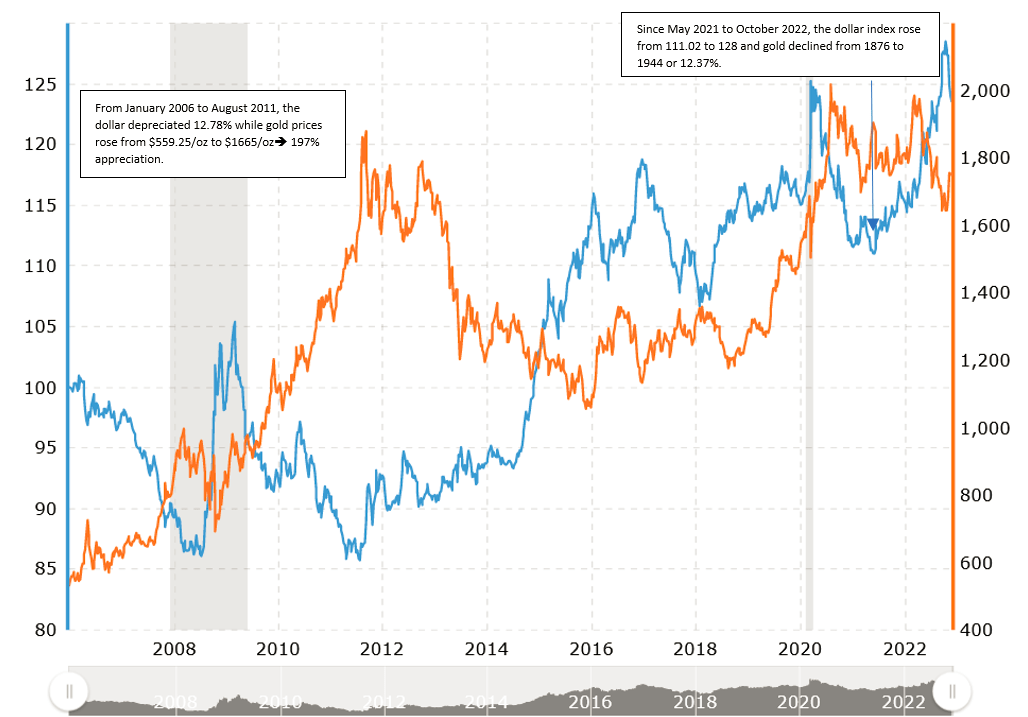
We believe there is an inverse correlation between the dollar and the price of gold. Because the Federal Reserve had ended a period of unusual rapid Fed Fund tightening, we believe we will see the dollar begin to decline as US Treasuries high yields will no longer lead the world in highest risk-adjusted yields.
The box score below reflects recent inverse moves in gold versus the US dollar.
Illustration of gold moves versus dollar moves (www.macrotrends.net) Chart of gold versus the dollar (www.macrotrends.net)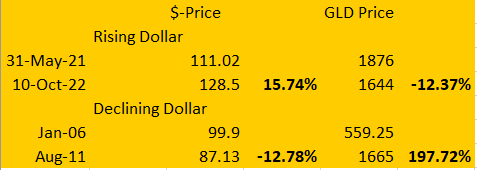
Gold and precious metals can be conveniently invested in through ETFs like GLD – the SPDR Gold Trust, GDX – the Van Eck Gold Miners ETF, and SLV – the iShares Silver Trust.
High Yielding Equities
We seek to find income vehicles which can provide an attractive yield and whose cash flows will benefit from good economic trends.
We remain positive on oil and trust Goldman Sach’s Jeff Currie’s 2023 price target of $110/barrel to be credible. With recent weakness in oil prices, Closed End MLP funds, like Kayne Anderson (KYN) with a 9.0% yield and a 13.5% discount to NAV is an attractive investment in the energy sector.
With our positive disposition toward precious metals and natural resources, we are owners and buyers of GAMCO Global Gold, Natural Resources & Income Trust (GGN). GGN closed at $3.58 with a NAV of $3.82 (a 6.2% discount to NAV) and a dividend yield of 10.6%. Its portfolio management strategy is a covered writing, so we own it for income and appreciation secondarily.
Templeton Emerging Markets Income Fund (TEI) is an old fund run by the Templeton Fund Organization. With the dollar starting to decline, we believe that this fund will provide both an attractive yield and capital appreciation. TEI yields 13.4% based on its closing price of $5.14/share and last monthly distribution of $0.042 per share. TEI’s NAV is 5.45 implying a discount to NAV of 5.6%. The Fund’s dividend policy is to pay out 10% on the fund’s NAV.
We don’t know where interest rates will go, so having a closed end fund with an attractive yield that provides attractive income without the duration risk of a bond makes good sense to use in this uncertain inflation and rate environment.
Money Markets
The world of “TINA” (There Is No Alternative (to equities)) is over. With the Federal Reserve raising interest rates, many bonds and other assets offer attractive alternatives to stocks. After four decades of great returns for equities, we now see equities as somewhat overvalued, and many alternatives to equities having attractive characteristics. Money market yields at Interactive Brokers on balances over $10,000 are 3.33%.
While 3.33% is still modest, the yield does give investors income and liquidity. Given our sense that 2023 could be a very volatile year, having larger than normal balances makes sense as there will likely be a period in the coming year where the stock market is under considerable stress and quality equity investments can be purchased when shareholders are panic selling. To keep a higher-than-normal allocation to cash could provide a great benefit to those waiting for opportunistic equity purchases during a market selloff.
Tax Bounce Opportunities
Tax bounce opportunities occur every year when investors look at their tax liabilities from stock sales and then decide to sell certain stocks simply due to the fact that the holder is under water on the position. Consequently, some stocks are sold off for tax reasons regardless of the economic value of the tax bounce candidate. That means there is a temporary opportunity to buy a stock or security under unusual selling pressure at year end, when the selling is simply tax driven and creating a bounce when that security trades into January and February and the tax selling pressure abates and the stock then again trades on its economic fundamentals. In addition to the high-yielding closed end funds recommended earlier, two tax bounce candidates are worthy of mention.
Tax Bounce Candidates
Tellurian Inc. (TELL) is an LNG producer and distributor that we believe has significant upside if they can finance their $12 billion Driftwood LNG facility. The company is led by a veteran team that is trying to build a large vertically integrated LNG facility, in Louisiana. The company disappointed investors in September when it withdrew from a $1 billion bond with warrants offering. The stock trades around fair value of their upstream assets with little value attributed to its LNG production facility. Driftwood could generate approximately $10 billion/year in cash flow if successfully financed. At a minimum, TELL could see a tax bounce into January from its current share price of $2.67/share. Demand for LNG is likely to accelerate after 2024 according to Oilprice.com. If the company succeeds in securing a large offtake commitment from India, South Korea, or other international buyers, Tellurian could trade to $10/ share in 2023 and up tenfold over the next several years. Alternatively, the company could sell to a large integrated oil company like Shell. The author and his clients own the stock.
TFF Pharmaceuticals (TFFP) is a drug delivery innovator that is trying to commercialize its thin frozen film process which turns medicinal molecules into a powder that can be inhaled. The company appears to have a great product and numerous pharmaceutical partners who, if successful, will be able to utilize its TFF process to deliver vaccines and other complex molecules not easily delivered via traditional means. The product is similar to the varied inhalers used to treat COPD. The company just raised $12 million to fund operations until some promising clinical trial data is released in the first and second quarters of 2023. The stock trades at about two times cash per share, but could burn through their cash over the next four quarters, unless it is able to strike some deals with some pharmaceutical companies including Pfizer which could use their system to deliver vaccines.
Conclusion
There are many things to be concerned about regarding the economy, the markets and geopolitically. The market has endured significant selling pressure but has held up well, in part because the US consumer continues to spend. However, the prospects of recession and historically rich valuations leave the market vulnerable to more downside risk.
For these reasons, we advise a cautious approach to 2023 with above-average allocations to precious metals and cash, and suggest selling long-duration assets such as technology stocks and growth stocks.
The economy appears to be in an inflationary cycle where outperformance could be achieved with a concentration in commodity, energy, international, emerging market, and value stocks which have not seen much interest in recent years. That in our opinion is where value can be found. Investors, unfortunately, will likely suffer recency bias and look for solid returns from the 60% equity and 40% bond allocation strategy, when we think a 25% commodities, 25% cash, 25% stocks, and 25% bonds strategy is more fitting.
Be the first to comment