

herkisi/iStock via Getty Images
After a prolonged drought since it was a task nothing short of challenging to compete with market-cap-driven investment strategies during the tech bull market and especially the ultra-loose monetary policy period, 2022 became a comeback year for a variety of smart-beta vehicles, principally for those that boost a fund’s value exposure while not compromising on quality. And the Invesco S&P 500 Revenue ETF (NYSEARCA:RWL) leveraging a revenue-centered U.S. large-cap equity strategy is a nice example to discuss today.
While investors in the iShares Core S&P 500 ETF (IVV) and similar bellwether equity ETFs had a year to forget, those who opted for the sales-weighted version of the S&P 500 portfolio did not see losses that steep. In fact, RWL beat IVV by more than 12%, finishing ahead of it during ten months and underperforming only in June and July. Does that mean it is worth rotating out of IVV or a similar S&P 500 fund for RWL permanently?
In fairness, 2022 performance was relatively strong, no doubt, but to answer that question, we need to look beyond it, thoroughly reviewing the advantages and vulnerabilities the ETF has at this juncture to arrive at a more balanced and reliable conclusion.
Reasons to consider RWL: better valuation, more immune to higher interest rates
The first benefit of the S&P 500 Revenue-Weighted Index-tracking RWL is its different sector mix, with industries traditionally enjoying lofty sales and earnings multiples underweighted, and those with massive revenues yet softer growth and subsequently lower multiples overweighted. That is to say, for investors who would like to see an IT-lighter mix, with a large share of the net assets parked in old-economy stocks, RWL is an option worthy of deeper research.
Specifically, it cut exposure to tech markedly, allocating about 14.6% less to it than IVV. It should be noted that allocations to real estate and utilities were also reduced, though only slightly, by a few basis points in the case of the latter. The key sector it boosted exposure to is energy, by around 5% to 10.4% in the current version, with Exxon Mobil (XOM), a supermajor with revenues on par with Apple’s (AAPL) thanks to last year’s crude price rally that sent them to a record level, being the top holding from this sector. XOM’s weight in IVV is 4.1x lower than AAPL’s, a barely surprising fact assuming the energy behemoth is trading with 5.8x EV/EBITDA vs. AAPL’s 15.5x, thus having a market cap of $455 billion vs. Apple’s over $2 trillion.
Sector weights in % (Created by the author using data from the funds)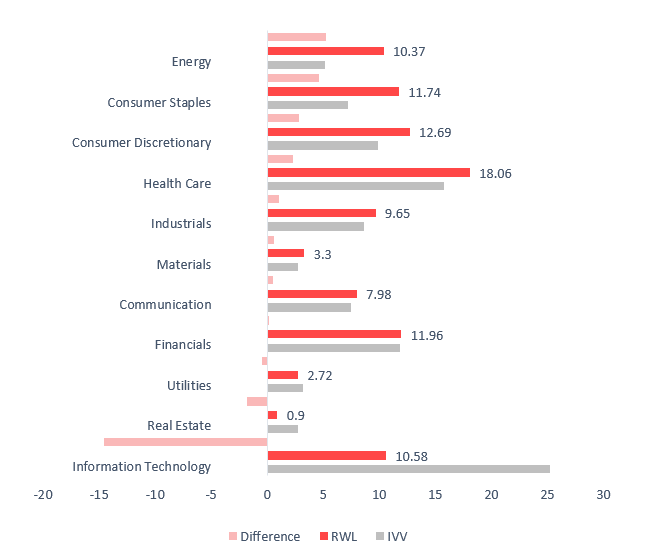
The share of the net assets deployed to consumer staples was also significantly increased, by 4.8%, partly owing to Walmart (WMT), a heavyweight retail and wholesale player, a fund’s largest position with 3.87% weight and total revenues of $600.1 billion, the largest result globally, almost $100 billion higher than total revenues delivered by Amazon (AMZN) in the last twelve months that secured it second place in this equity basket.
Besides, the fact that RWL has healthcare as a top sector instead of IT is barely surprising, assuming the sum of revenues of all healthcare players currently in the S&P 500 is $2.89 trillion vs. IT’s $1.71 trillion as per my calculations.
What does the above mean for the size and value factor exposure? In essence, size edges lower across the board, while value enjoys a slight boost, which is another advantage.
Specifically, the weighted-average market capitalization of RWL is much smaller than IVV’s, $247 billion vs. about $404 billion. Please note that WMT, despite its total sales being the largest in the world, is trading with a fairly modest Price/Sales of 0.67x and Enterprise Value/Sales of 0.77x. RWL’s weighted-average earnings yield is, in contrast, much higher, ~6.1% vs. IVV’s ~4.9%, as per my analysis.
RWL’s natural proclivity for companies valued if not attractively but at least not horribly overpriced is also reflected in the fact that over 17% of its holdings have a B- Quant Valuation grade or higher, which is better compared to IVV’s 9.4%. Each sector represented has a few stocks that demonstrate an attractive Valuation rating, with communication and consumer discretionary contributing most to the figure above, around 2% each.
Even though the Invesco fund has ~7% exposure to loss-making companies compared to IVV’s 3.8%, quality is rock-solid as 95.8% is allocated to stocks with at least B- Quant Profitability grade; IVV has a result just a few bps higher.
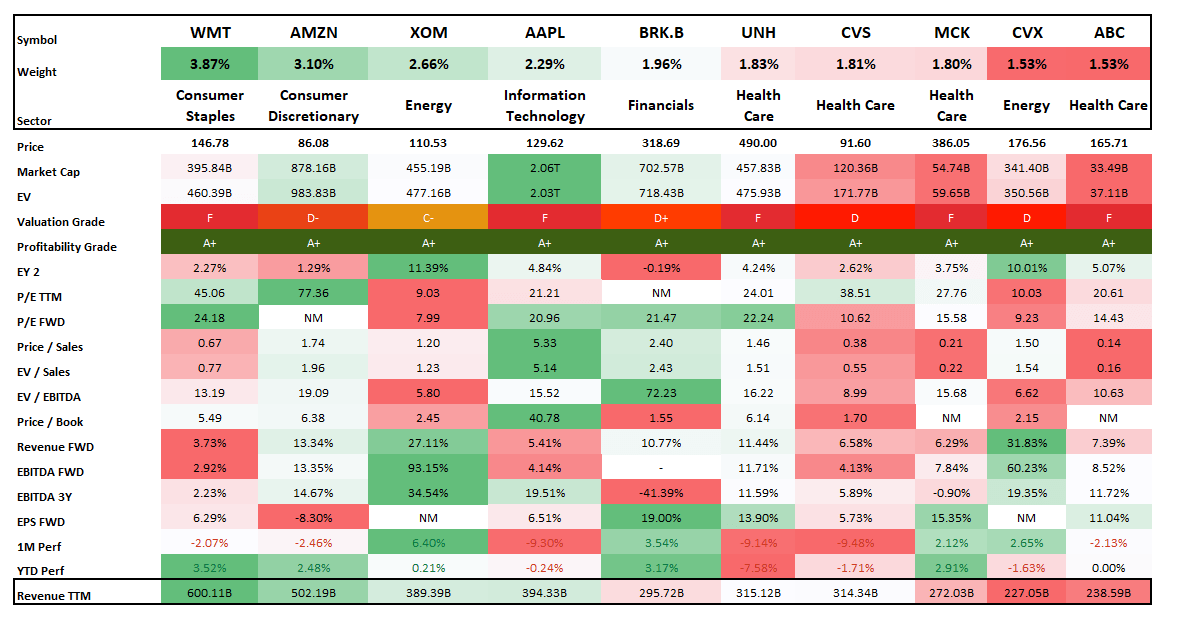
To contextualize what has been just discussed, the comparison of the essential growth, value, and quality characteristics of the key ten holdings of IVV and RWL is presented below.
IVV key 10 holdings (Created by the author using data from Seeking Alpha and the fund) RWL key 10 holdings (Created by the author using data from Seeking Alpha and the fund)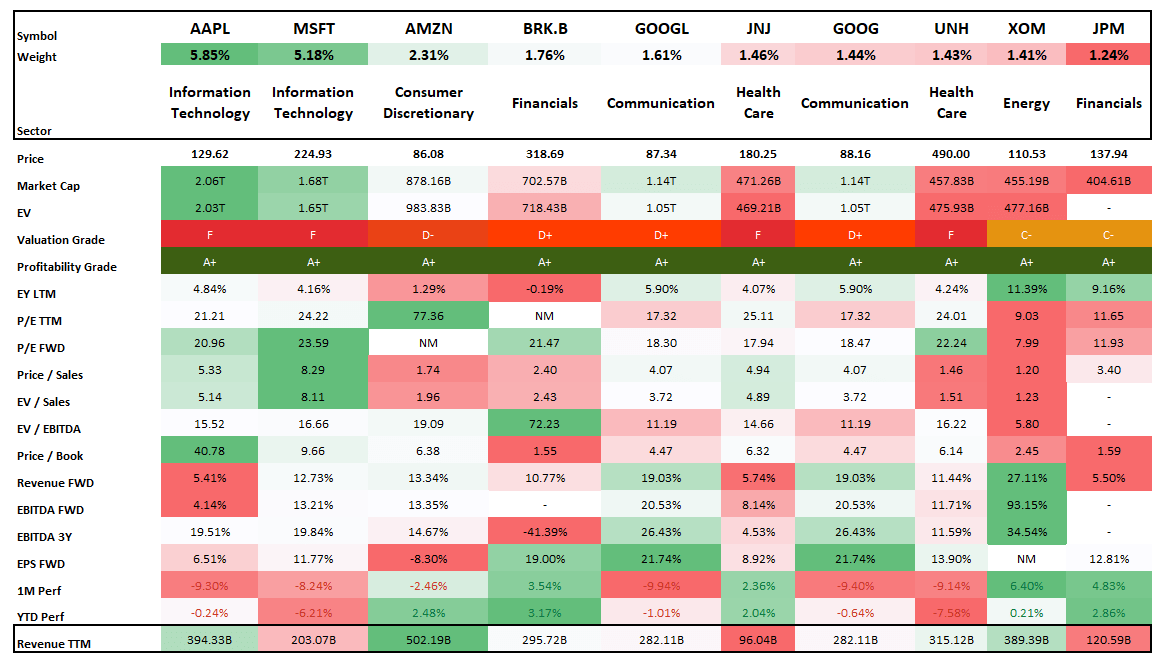
Another advantage of RWL is its solid performance compared to its market-cap-weighted peer. The period I selected for analysis is June 2019 – December 2022 owing to the fact that MassMutual asset management affiliate OppenheimerFunds was acquired by Invesco (IVZ) in May 2019, and the Oppenheimer S&P 500 Revenue ETF was subsequently reorganized.
| Portfolio | RWL | IVV |
| Initial Balance | $10,000 | $10,000 |
| Final Balance | $15,797 | $14,800 |
| CAGR | 13.61% | 11.56% |
| Stdev | 20.22% | 19.73% |
| Best Year | 29.82% | 28.76% |
| Worst Year | -6.02% | -18.16% |
| Max. Drawdown | -24.12% | -23.93% |
| Sharpe Ratio | 0.68 | 0.6 |
| Sortino Ratio | 1.09 | 0.92 |
| Market Correlation | 0.96 | 1 |
Created by the author using data from Portfolio Visualizer
The table below vividly illustrates why RWL’s CAGR was much higher:
Created by the author using data from Portfolio Visualizer
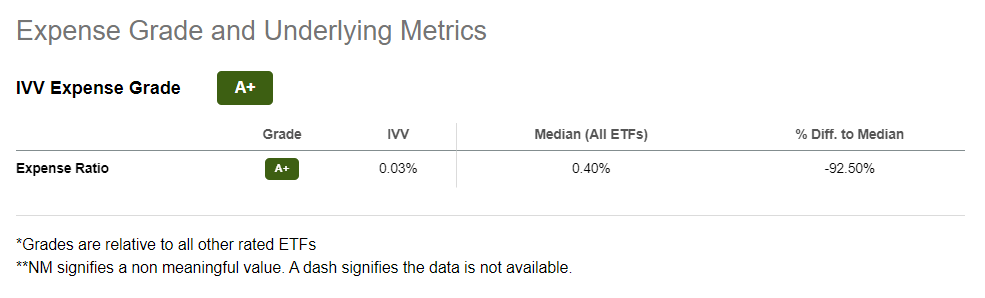
Since RWL is naturally less expensive than IVV, its better performance last year is not a surprise, at all. Also, in 2021, during the vaccines-induced capital rotation from pandemic winners principally from the tech and growth cohort to beaten-down cyclicals, it also trounced the S&P 500 fund by about 1%. Meanwhile, its larger exposure to old-economy stock was expectedly more of a drag in 2020.
A few reasons for skepticism
The first downside I spotted upon deeper inspection is higher volatility, though only modestly higher. As illustrated by the table above, the standard deviation RWL delivered during the period discussed was almost 50 bps higher. On the positive side, risk-adjusted returns appeared to be fairly strong.
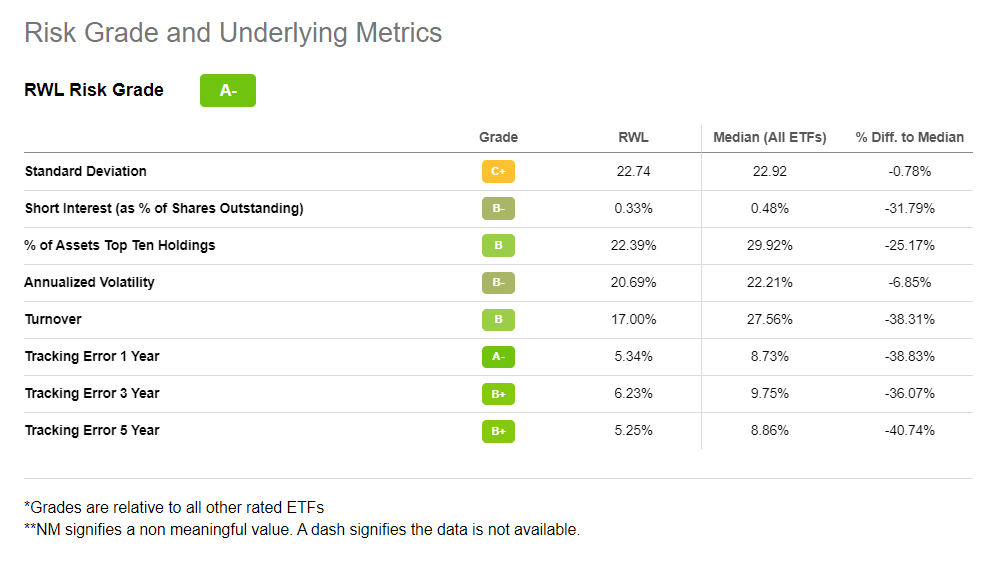
Still, in terms of risk measured as a composite of tracking errors, volatility, etc., there are reasons to favor IVV over RWL.
Seeking Alpha Seeking Alpha
The second vulnerability is much higher turnover and meaningfully higher expenses, which are obviously interconnected.
Seeking Alpha Seeking Alpha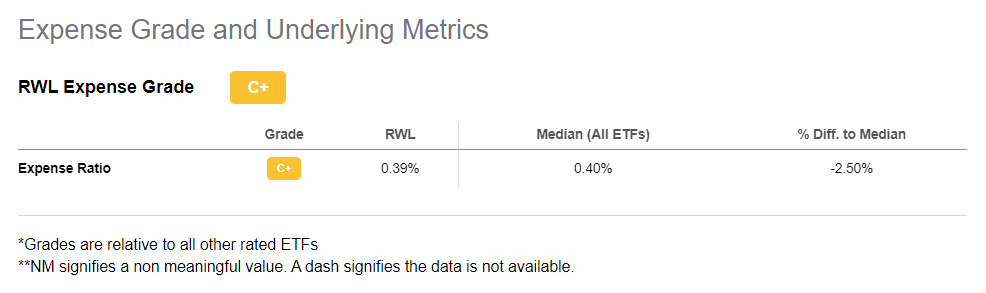
Final thoughts
RWL’s unconventional revenue-driven weighting schema could produce decent results in certain market environments like the one we were watching last year. In fact, revenue weighting does not solve the S&P 500’s perennial valuation problem yet it makes it less acute, without reducing exposure to quality and growth to intolerably low levels.
Be that as it may, RWL’s proclivity for better-valued stocks is a double-edged sword. Value-heavier portfolios are certainly not all-weather outperformers, and for longer periods, RWL is not necessarily the best pick. In the lower GDP, and lower interest rates (designed to bolster the sputtering economy) scenario, which is supportive of growth stocks’ gradual recovery, there is a risk RWL underperforms IVV, with meaningfully higher fees also being a drag. Considering the balance of advantages and weaknesses, the Hold rating looks appropriate.
Be the first to comment