

Vladimir Mironov/iStock via Getty Images
On the stock market, restaurants are a dime a dozen. But some of the most interesting opportunities can actually be found in this space, particularly with some of the smaller firms that are not as well known. One intriguing prospect that seems to offer some upside potential is Ruth’s Hospitality Group (NASDAQ:RUTH), a developer and operator of fine dining restaurants under the Ruth’s Chris Steak House brand name. Although the company was negatively impacted by the COVID-19 pandemic, it has started showing signs of recovery. Revenue continues to climb this year, though profitability is taking a slight step back. Having said that, shares are attractively priced at the moment, both on an absolute basis and relative to other firms. So for these reasons, I would rate the enterprise a soft ‘buy’ right now.
Taste-testing Ruth’s Hospitality Group
As I mentioned already, Ruth’s Hospitality Group focuses on developing and operating fine dining restaurants. Management says that it is one of the largest upscale steakhouse companies on the planet, with its selection including premium offerings like USDA Prime and Choice grade steaks, New Orleans-style barbecued shrimp, mushrooms stuffed with crabmeat, spicy shrimp, chilled seafood tower and sizzling crab cakes, and a variety of salads. The company also sells bottles of wine ranging from as cheap as $46 to over $1,000 apiece. Other alcoholic beverages like beers and cocktails are also on the menu. When I say that the company is focused on the premium market, I mean it. Its dinner entrees are usually priced between $35 and $99, with dinner being their main area of focus. Lunch options tend to be a bit cheaper, ranging between $14 and $29. Put that lower price does not change the fact that the average guest check in 2021 came out to $89, with food sales representing 81% of that check size.
Author – SEC EDGAR Data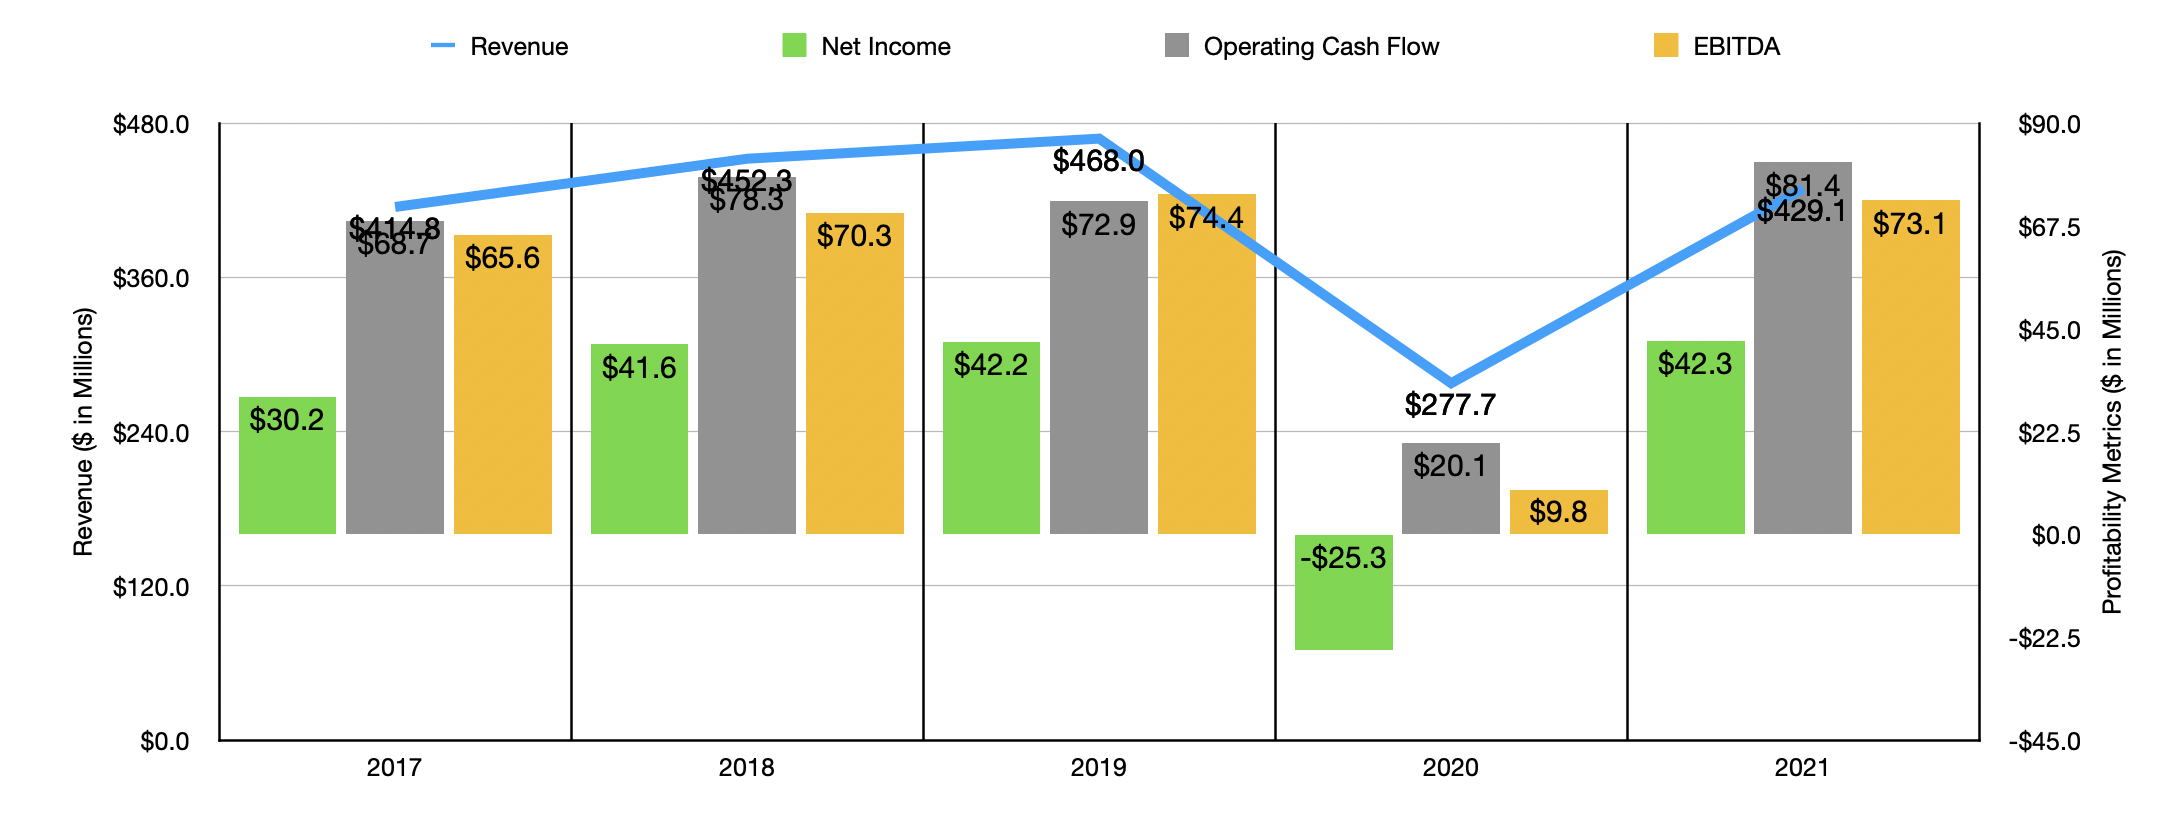
Prior to the COVID-19 pandemic, Ruth’s Hospitality Group had done well to steadily grow its top and bottom lines. Revenue, for instance, rose from $414.8 million in 2017 to $468 million in 2019. This growth was driven by a combination of increased location count and rising comparable store sales. The number of locations grew from 155 to 159 during this timeframe, with substantially all of that increase coming from the firm’s company-owned locations. Aggregate comparable store sales, meanwhile, grew by 3.3% over that window of time. But then, in 2020, sales plummeted to just $277.7 million. This came as the number of locations the company had plummeted by 10 and as comparable store sales dropped by 40.2%. Fortunately, the company experienced a solid partial rebound in 2021, with revenue bouncing back up to $429.1 million. This increase came as the firm added one additional store to its portfolio. But the big driver was a 58.6% rise in comparable store sales.
Author – SEC EDGAR Data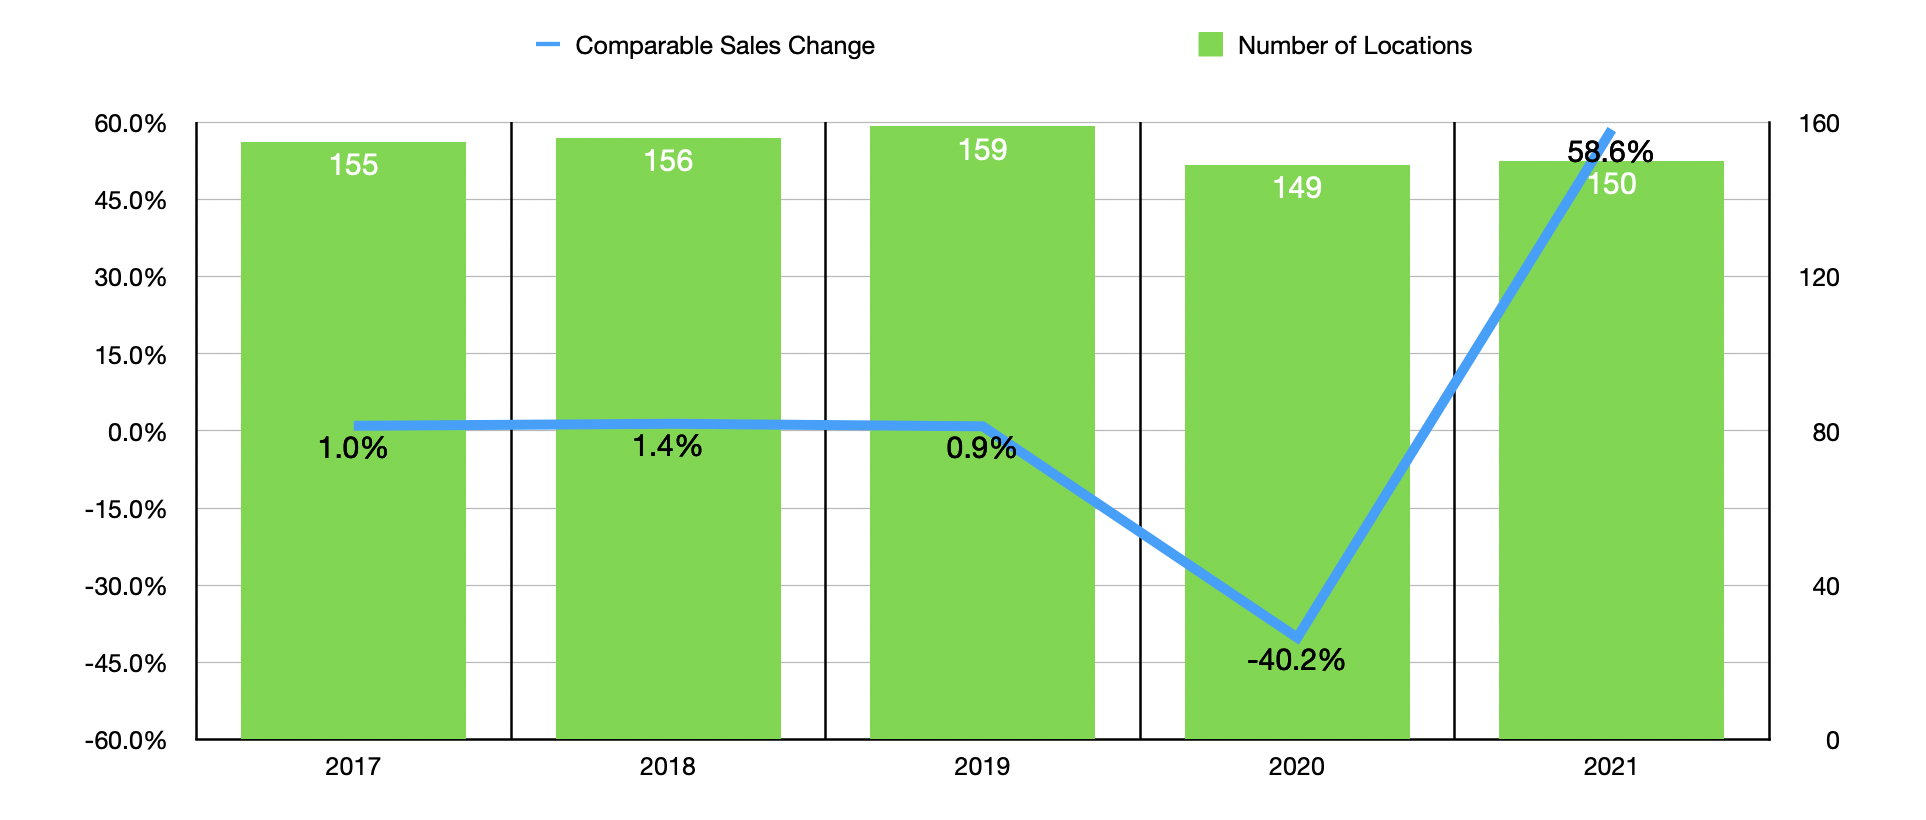
Profitability for the company has followed a similar trajectory. Net income rose from $30.2 million in 2017 to $42.2 million in 2019. The firm generated a loss of $25.3 million in 2020 before posting an all-time high profit of $42.3 million last year. Operating cash flow rose between 2017 and 2019, climbing modestly from $68.7 million to $72.9 million. In 2020, cash flow plummeted to $20.1 million before recovering nicely to $81.4 million last year. A similar trajectory can be seen when looking at EBITDA. It ultimately rose from $65.6 million to $74.4 million in the three years ending in 2019. In 2020, it was positive to the tune of just $9.8 million, while in 2021 it totaled $73.1 million.
Author – SEC EDGAR Data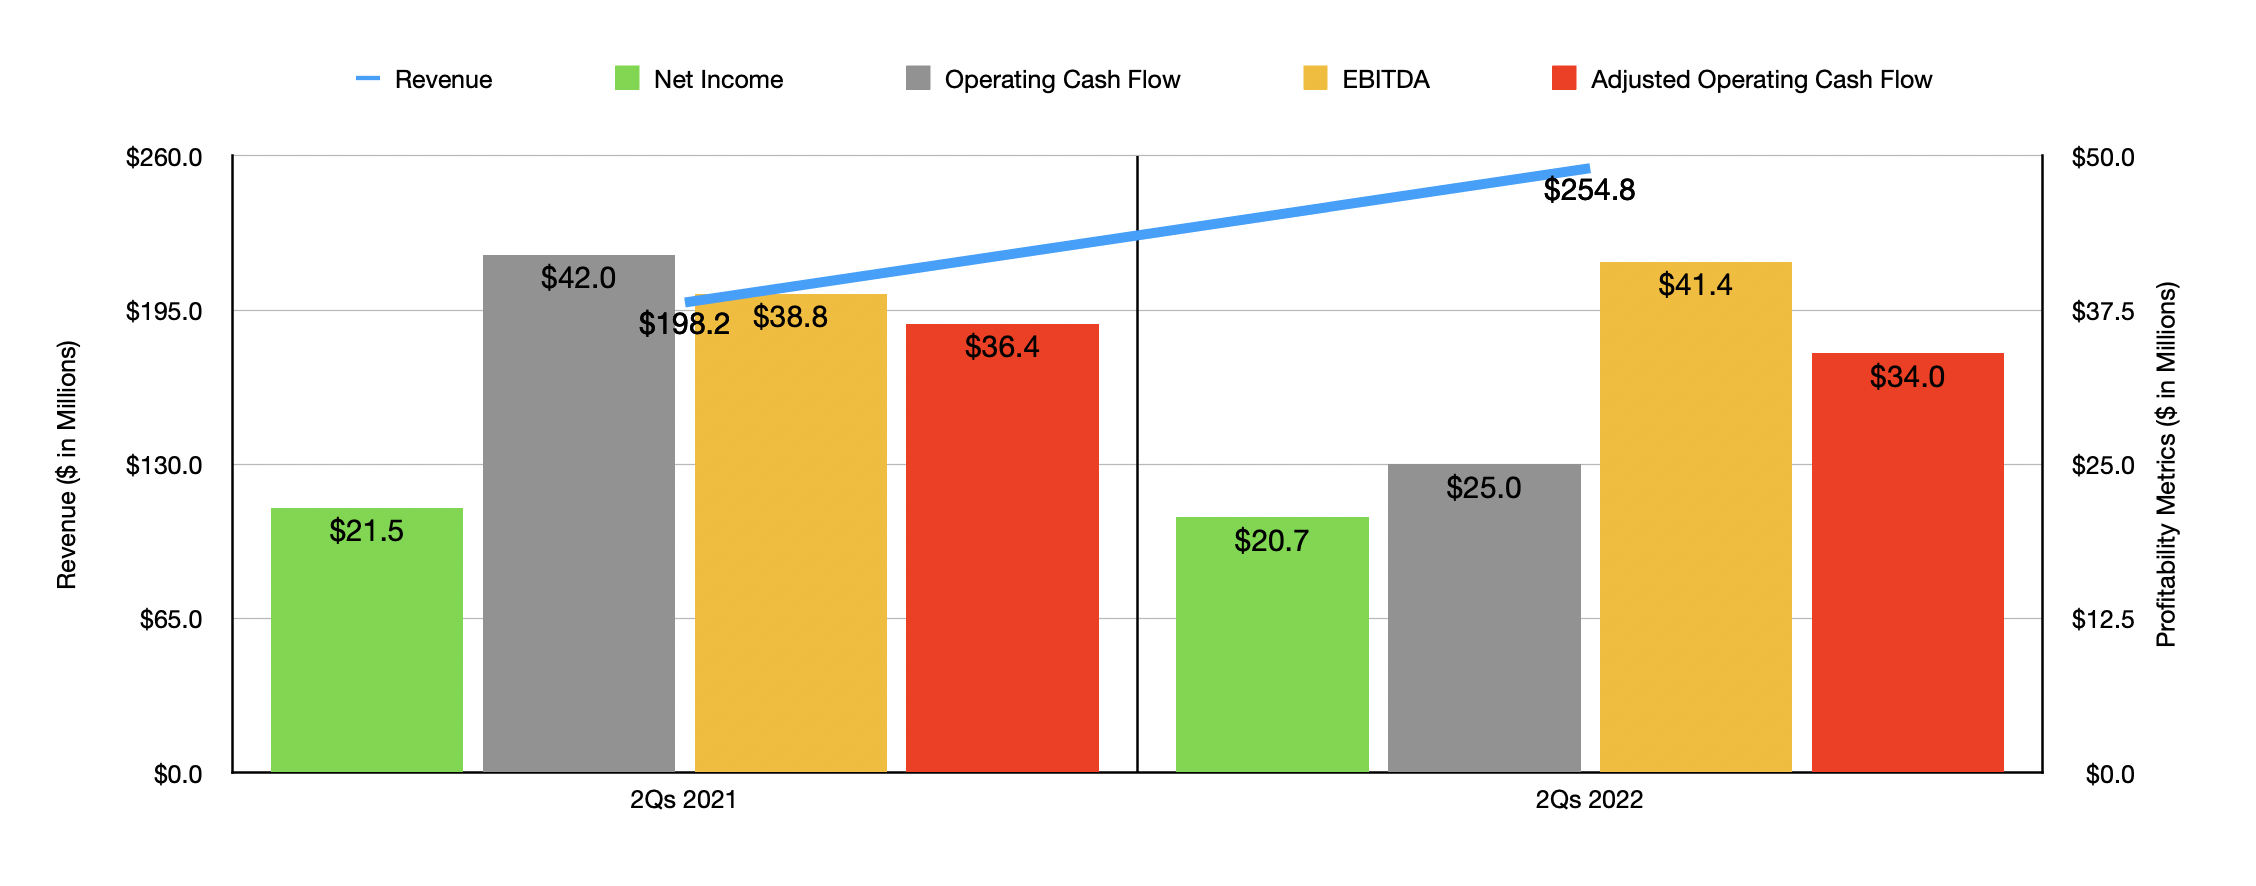
Top line growth for the company has continued into the 2022 fiscal year. For the first half of the year, sales came in strong at $254.8 million. That represents a nice increase over the $198.2 million generated just one year earlier. The company managed to add one additional location to its portfolio, taking the number of restaurants up to 151. 74 of these are ultimately company-owned, while 74 are franchised. The final three, meanwhile, are owned by the business by managed by third parties under contracts. The big driver of this year-over-year increase in sales, then, would have been comparable store sales improving.
Even though revenue for the company increased nicely so far this year, profitability has struggled slightly. Net income came in the first half of the year at $20.7 million. That’s down modesty from the $21.5 million experienced one year earlier. Operating cash flow plunged from $42 million to $25 million. Though if we adjust for changes in working capital, the decline would have been smaller from $36.4 million to $34 million. And finally, we arrive at EBITDA. This was the only metric on the bottom line to improve year over year, rising from $38.8 million to $41.4 million. Given supply chain issues, and rising costs, both items that management has expressed concern over, it’s not a surprise to see profitability struggle. In fact, the fact that profitability has held up as well as it has is indicative of the benefits of operating in the premium market.
Author – SEC EDGAR Data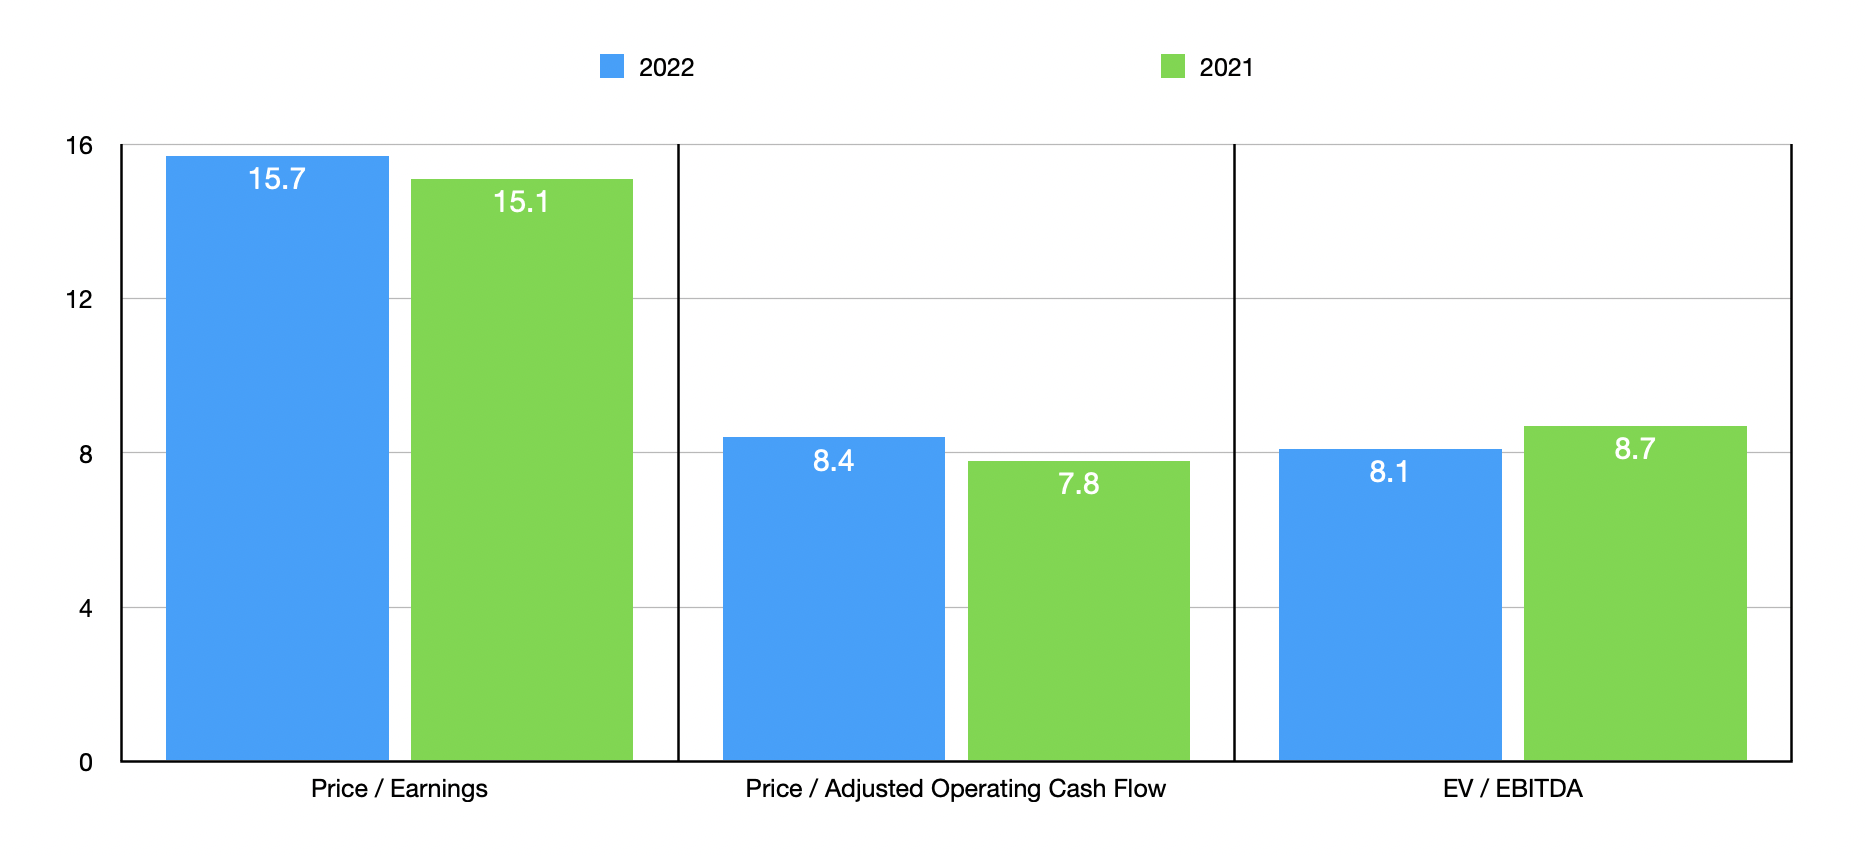
Management has not really offered any guidance when it comes to the 2022 fiscal year. But if we annualize results experienced so far, we should anticipate net income of $40.7 million, adjusted operating cash flow of $76 million, and EBITDA of roughly $78 million. Using these figures, we can see that shares of the company are attractively priced. The forward price to earnings multiple of the business is 15.7. That’s only slightly higher than the 15.1 reading we get using last year’s results. The price to adjusted operating cash flow multiples should be 8.4. That’s up from the 7.8 reading that we get using figures from 2021. Meanwhile, the EV to EBITDA multiple should drop from 8.7 using last year’s results to 8.1 using forward estimates. As part of my analysis, I also compared the company to five similar firms. On a price-to-earnings basis, the 3 firms with positive results saw their multiples range between 9.4 and 18.8. In this case, only one of the three businesses were cheaper than Ruth’s Hospitality Group. Using the price to operating cash flow approach, the range was from 9.5 to 41.9, while using the EV to EBITDA approach, the range was between 11.4 and 116.4. In both of these cases, our prospect was the cheapest of the group.
| Company | Price / Earnings | Price / Operating Cash Flow | EV / EBITDA |
| Ruth’s Hospitality Group | 15.7 | 8.4 | 8.1 |
| BJ’s Restaurants (BJRI) | N/A | 11.0 | 16.8 |
| Denny’s (DENN) | 9.4 | 10.0 | 11.9 |
| Kura Sushi USA (KRUS) | N/A | 41.9 | 116.4 |
| Chuy’s Holdings (CHUY) | 19.4 | 10.7 | 11.4 |
| El Pollo Loco Holdings (LOCO) | 18.8 | 9.5 | 11.7 |
Takeaway
At this point in time, Ruth’s Hospitality Group seems to be doing fairly well for itself, especially considering the difficulties the current market poses. Long term, the company will likely continue growing on both the top and bottom lines, though we could see some volatility near term for the aforementioned reasons. It helps that shares of the business look attractively priced and are cheap relative to similar firms. In all, this has led me to rate the business a soft ‘buy’ at this time.
Be the first to comment