

Leestat/iStock via Getty Images
The investment thesis
The Ukraine Russian situation keeps creating substantial uncertainties in the global energy market. Russia provides nearly 40 percent of the European Union’s natural gas and more than 25 percent of its crude oil. Since the situation broke out, the price of oil has rocketed to above $130 for the first time since 2008. Natural gas prices have recently touched the $7.5 level, too, again for the first time since 2008.
Most analyses (including our own) on big oil companies tend to focus on their oil business – and for good reasons. As you will see, for major energy players such as Exxon Mobil (NYSE:XOM) and Chevron (NYSE:CVX), oil indeed represents both a larger asset and also a large income stream than natural gas (“NG”).
As such, the thesis of this article is to focus on the often-neglected NG aspects. In particular,
- The role of natural gas should not be ignored. On the contrary, both XOM and CVX have sizable exposure to natural gas both as an asset and also an income stream. Under the current conditions, you will see that natural gas alone contributes a large margin and a sizable upward potential for the stock prices.
- Natural gas prices can be more volatile than oil prices, further magnifying the upside potential. As you can see from the chart below, historically natural gas prices have been more volatile than oil prices. And both natural gas and oil prices have rallied by more than 400% from their bottom levels in the past few years. The ongoing conflict between Russia and Ukraine has been driving major European countries such as Germany away from Russian natural gas. They are planning to import liquefied natural gas from elsewhere such as the United States, and both XOM and CVX are major natural gas producers.
- Finally, natural gas prices and oil prices are not always correlated (they are correlated the majority of the time). A notable example involves 2018 and 2019. As you can see from the following chart, during that time, natural gas prices rallied as high as 64% while oil prices declined by as much as 39%. The lack of correlation (or even negative correlation) provides a valuable diversification to the income streams of both stocks.
Author and Yahoo Finance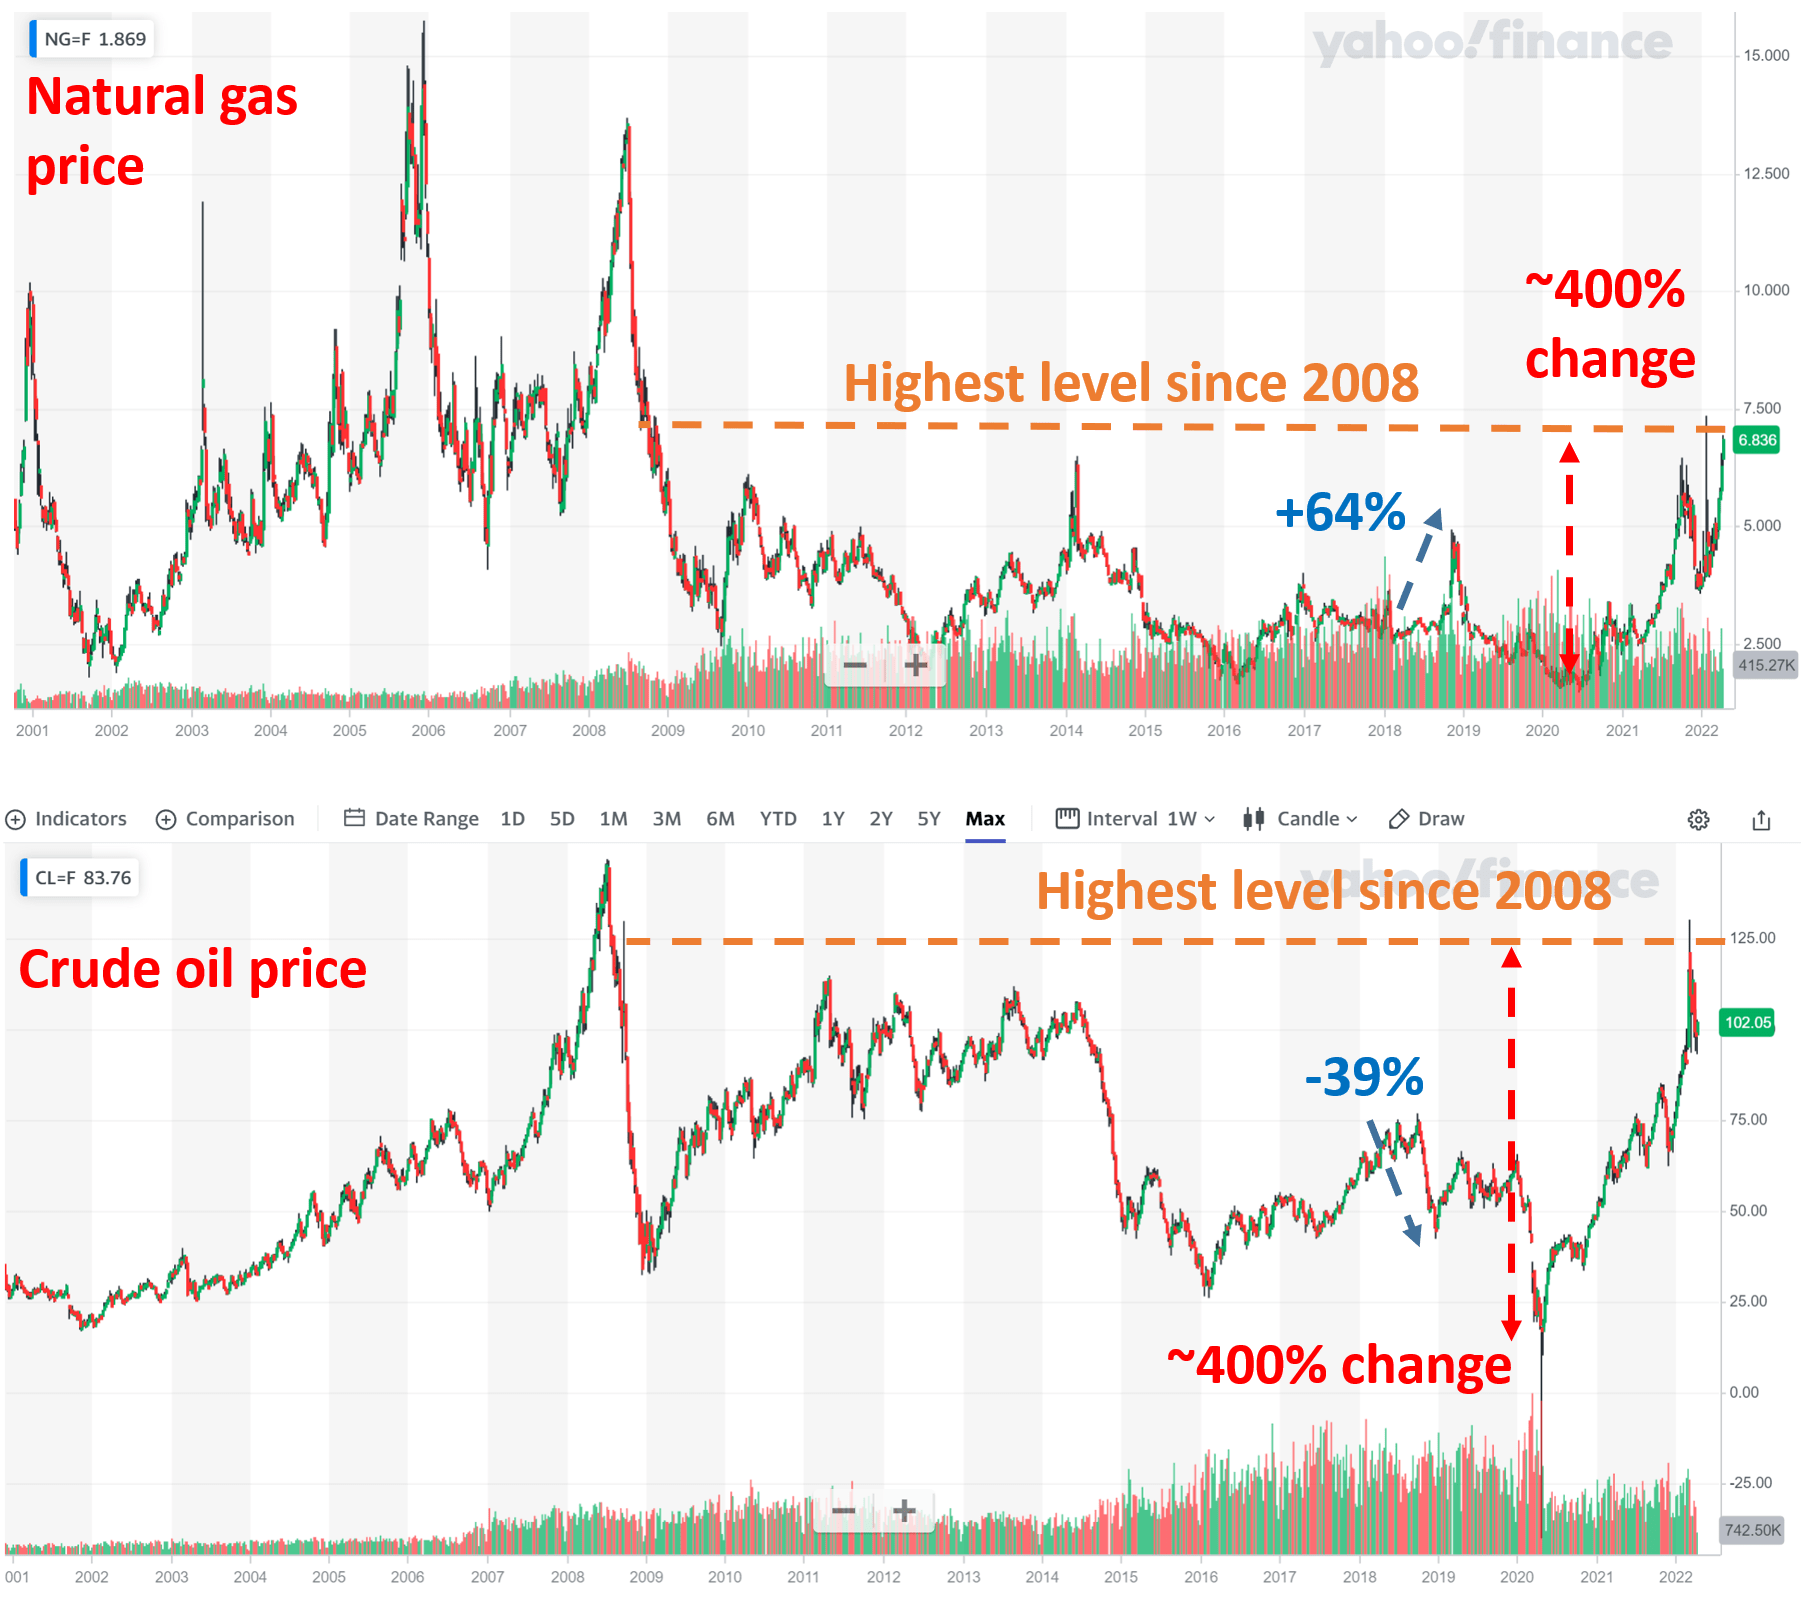
XOM and CVX: the current worth of their oil and gas reserves
Now, let’s evaluate the role of natural gas for XOM and CVX. Both businesses are quite complicated and have many intricacies. XOM’s business alone could take up the space of a few books. Here, to simplify the thesis and to make the argument on the drastically conservative side, I will assume that everything XOM and CVX currently have are worthless except their proven oil and natural gas reserve.
It is a dramatic simplification. But it helps to see the essence of the thesis and leaves us a really wide margin of safety. In reality, they both have a sizable downstream segment that contributes to a substantial fraction of their income, and their ongoing exploration will surely discover new reserves. They also have new initiatives in the new energy space. Under this dramatic simplification, the table below shows how things stand with XOM and CVX at this moment.
First, let’s address the often-talked about oil. XOM currently has a proven oil reserve of 9.88 billion barrels and CVX 6.1 billion barrels. With a 10-year average oil price of $100 per barrel, the proven oil reserve itself is worth $593 billion for XOM and $372B for CVX, assuming a breakeven oil price of $40 per barrel.
Here I have to clarify that analysis of the so-called breakeven price is more an art than a science. A lot of it depends on how you define the concept itself. Let me just quote a few numbers to illustrate the degree of ambiguity. XOM’s extensive operations in the Permian Basin feature the lowest production cost of only around $15/barrel. And its production cost in Guyana is about $25/barrel. XOM’s CEO Woods commented that the overall oil production cost is about $35 per barrel. So, here I will use $40 to be on the more conservative side.
All told, the proven oil reserve would be worth $144 per share for XOM and $196 per share for CVX.
Now, let’s address their less-often discussed business of natural gas. Both businesses also have proven natural gas reserves. The discussion of natural gas is a bit more involved than the more frequently discussed oil business. A full discussion merits a separate article by itself. So here I will just directly get to the end results:
- XOM has a proven reserve of natural gas of about $5.32 billion in oil-equivalent barrels. The proven natural gas reserve is worth about $38 per share assuming a 10-year average gas price of $5/MBTu. And CVX has a proven reserve of natural gas of about $5.0 billion in oil-equivalent barrels. Its proven natural gas reserve is worth about $17 per share again assuming a 10-year average gas price of $5/MBTu.
- In the above estimate, I assumed a breakeven gas production price of $2.8/MBTu. Just like the breakeven oil price, it is not an exact science. McKinsey reports that North America can produce enough gas to meet more than 25 years of demand below $2.80/MBTU.
So in the end, you can see that the worth of their current natural gas reserves is indeed much smaller than the worth of their oil reserves. However, they are still sizable and not negligible at all.
And finally, you can see that only the current worth of their proven oil and gas reserve is already substantially above their current stock prices. This leaves a margin of safety of more than 20% for CVX and more than 40% for XOM.
Source: author.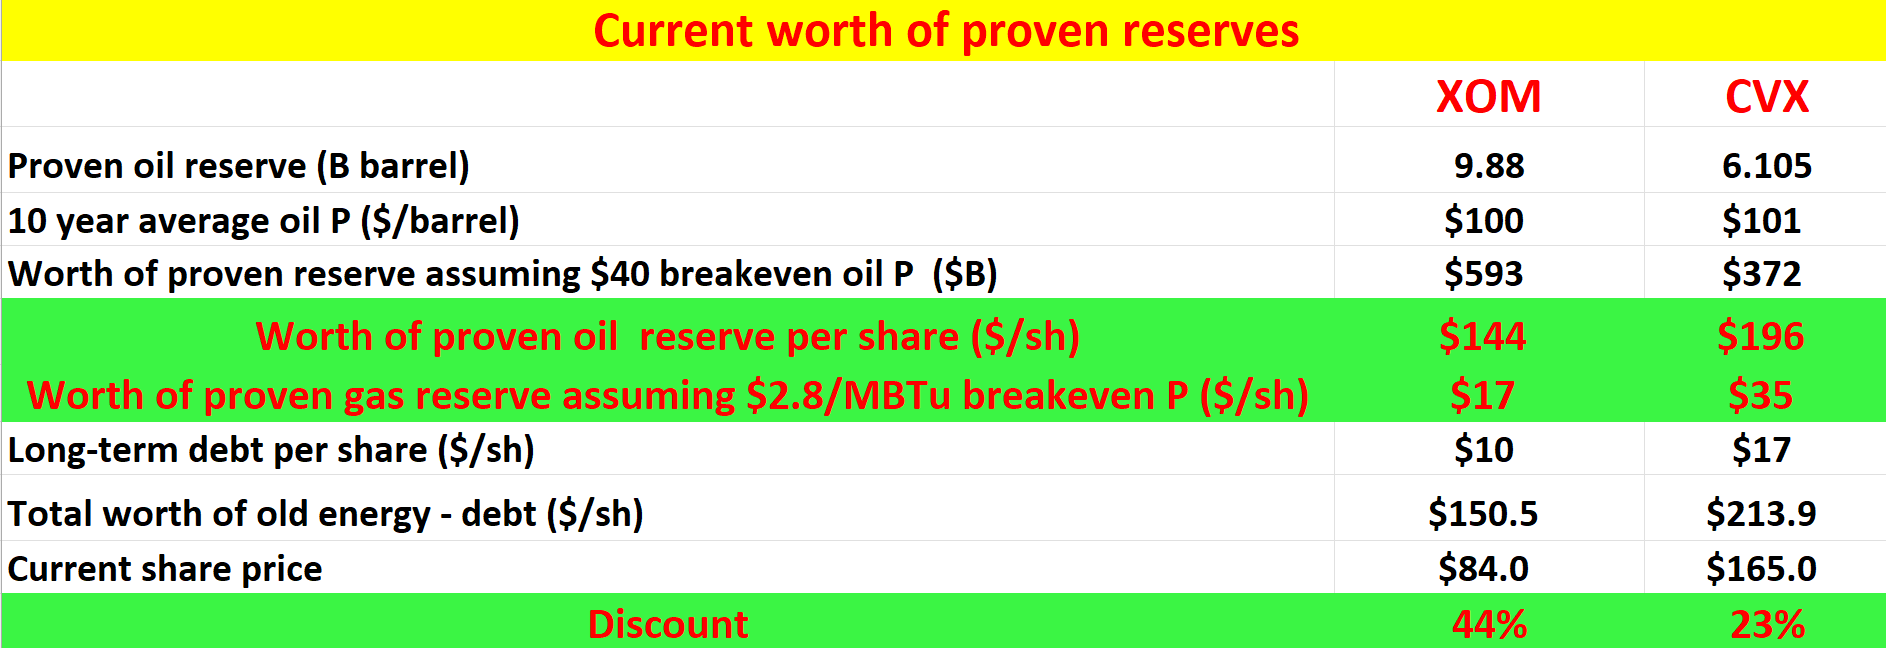
XOM and CVX: the income from natural gas
The following chart elaborates on the impact of NG prices on XOM. In the first chart, you can see XOM’s operating income has been positively, and strongly positively, correlated with natural gas prices. The correlation coefficient has been as high as 0.9 most of the time (1 would be a perfect correlation). The picture is very similar for CVX.
Seeking Alpha and YCharts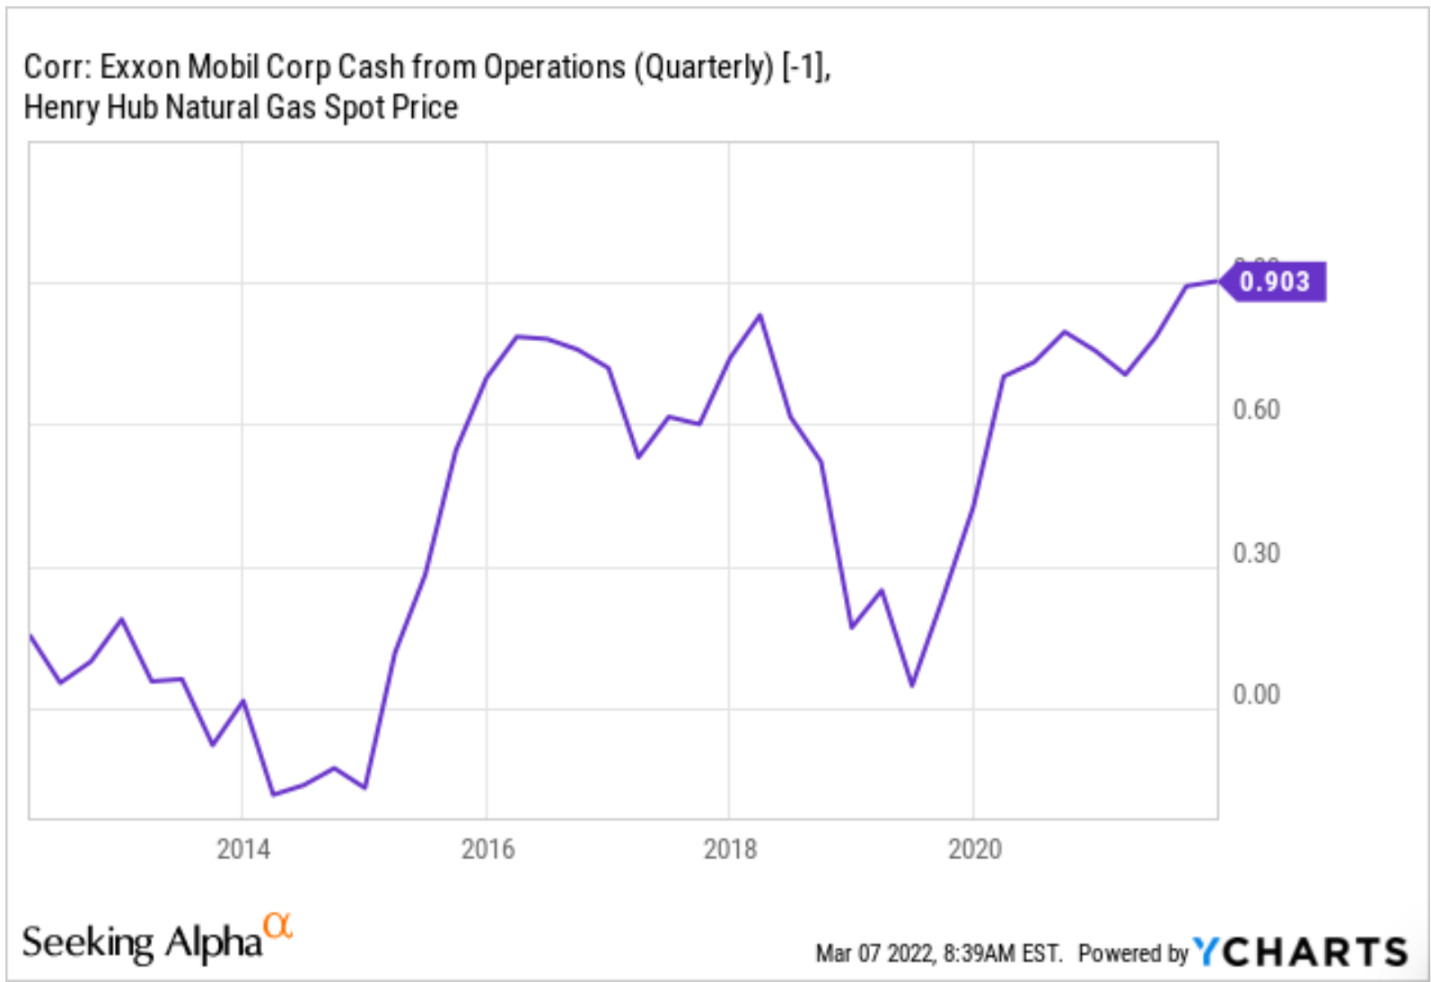
The reason for such a strong correlation is that natural gas contributes a significant part of the revenue – and also profit – to both XOM and CVX’s overall business. You may see this in the second chart below. The discussion of natural gas is a bit more involved than the more frequently discussed oil business (another reason why NG is less often discussed). The considerations that went into the analysis here are:
- XOM natural gas production output amounted to approximately 8.5 billion cubic feet per day in recent years. And CVX’s natural gas production output was approximately 7.3 billion cubic feet per day in recent years. Their natural gas production has been either declining or staying flat in recent years. For XOM, 8.5 billion cubic feet per day was the lowest figure in the seven-year period since 2014. I expected this trend of decline to reverse now for the catalysts mentioned above.
- You may find all these numbers confusing (reserves in oil equivalent, production in cubic feet, and price quote in BTU). Indeed, they are. Juggling among the different units alone is not easy even for trained professionals in the business. Here is a bit of quick math to help. The Energy Information Administration measures the U.S. annual average heat content of natural gas at 1,037 British Thermal Units (“BTU”) per cubic foot (“CF”). And 1 million cubic feet of natural gas is equal to 172 oil-equivalent barrels.
- With the above math, at an NG price of $5/MBTU, natural gas contributes about $16B per year to the sales of XOM and about $13.8 for CVX. To put things under perspective, the NG sales are about 20% of the oil sales for them. So again, not a dominant segment but not negligible either.
- Again, assuming a $2.80/MBTU breakeven price for NG, XOM can earn an additional $0.08 per share of profit for every $0.1 increase in NG prices, and CVX can earn an additional $0.15 per share.
With the above, we can assess the impact of NG prices on their prices in the next section.
Author and Seeking Alpha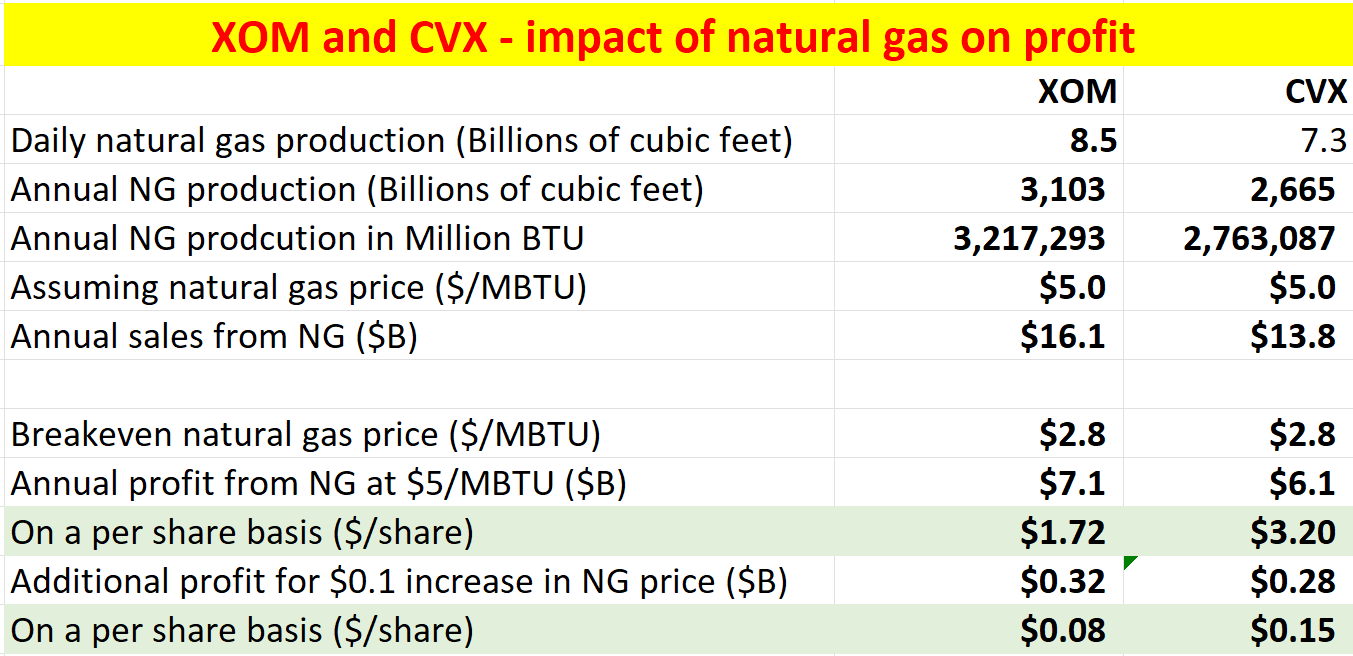
XOM and CVX: impact of NG prices on stock prices
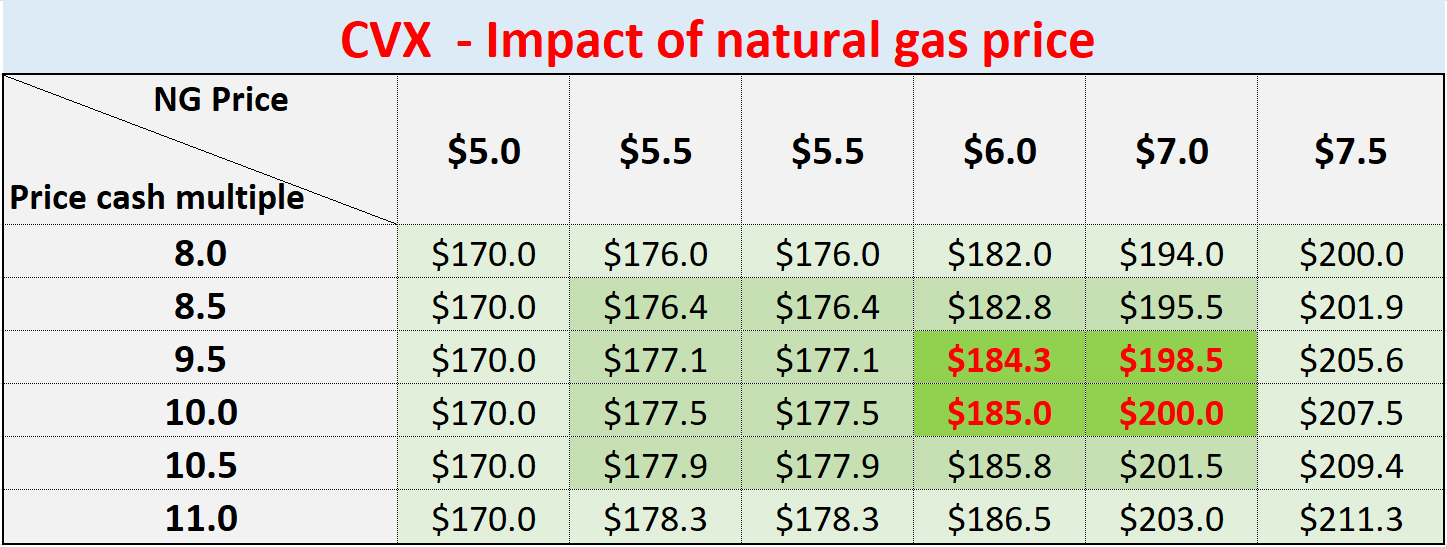
Based on the impact of EPS analyzed above, the next two charts show the impact of NG prices on XOM and CVX stocks prices under different valuation multiples. The color in the background shows the possibility of each combination. The darker the background color, the more probable the scenario is expected to materialize. And the numbers highlighted in red are the most likely scenario given the business fundamentals and catalysts I see now. In particular,
- For XOM, with a combination of a $6 to $7 NG price and an average valuation of 9.5x to 10x cash flow, a target price around $100 can be supported.
- For CVX, with a combination of a $6 to $7 NG price and an average valuation of 9.5x to 10x cash flow, a target price of around $200 can be supported.
Author Author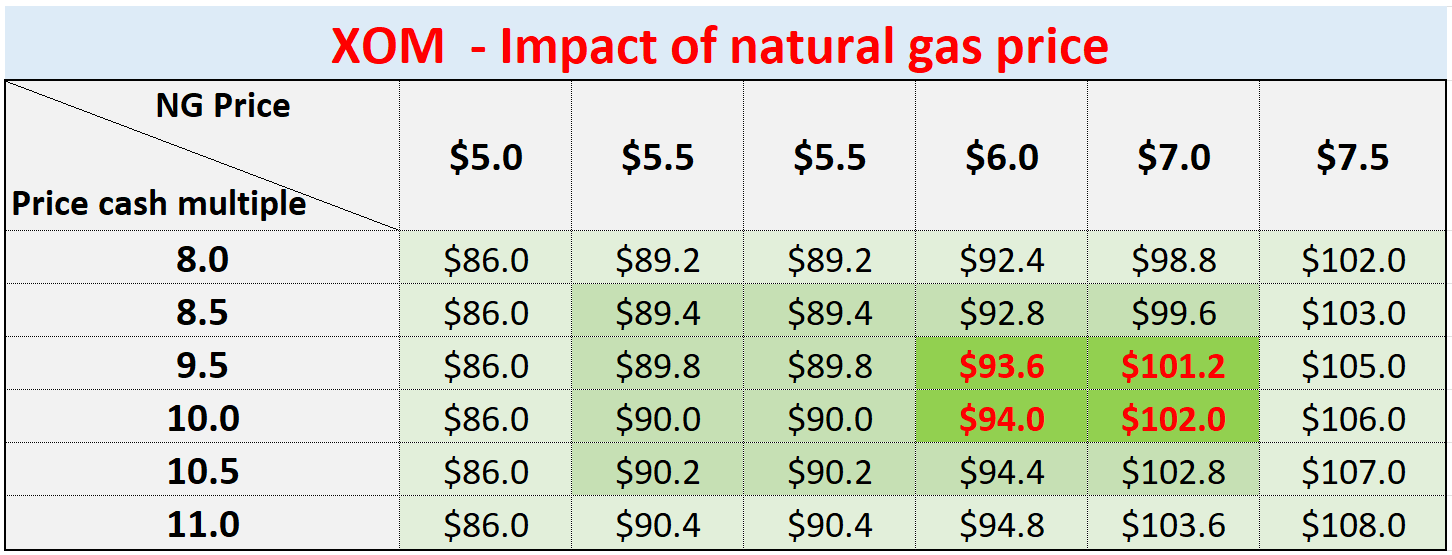
Margin of safety and risks
To summarize, if my above analyses are inaccurate, I believe the inaccuracies are on the conservative side for the reasons mentioned above. To summarize, the asset analysis only considered their current oil and gas reserves and ignores all their other assets. And the income analyses only considered the impact of NG prices changes and ignored all other profit drivers such as their chemicals and oil sales.
But remember that investments in XOM and CVX do involve their own risks, both in the short term and long term.
- The Ukraine/Russian conflict is a big near-term uncertainty. The duration and eventual outcomes of the conflict (as with any geopolitical conflict) are totally uncertain. It could generate substantial impacts on both the global overall financial markets and the energy stocks in unpredictable ways.
- Furthermore, the pace and degree of the post-COVID economy recovery are also uncertain. Although the vaccination is progressing extensively and the economy is re-opening at a steady pace. However, the pandemic is far from over yet, and uncertainties like the delta and omicron variants still exist. These uncertainties could impact the demand-supply dynamics.
- Oil and gas prices also face political risks. As a recent example, President Joe Biden said he will release roughly 1 million barrels of oil a day from the Strategic Petroleum Reserve to fight the surging fuel prices. Another recent example is the Windfall Tax proposed by Congress on big oil companies. Such actions and policies (if they materialize) could impact oil prices and therefore CVX and XOM stock prices.
Conclusion and final thoughts
Most analyses on big oils do not emphasize their natural gas businesses. As such, the thesis of this article focuses on this often-neglected aspect. The key takeaways are:
- The role of natural gas should not be ignored. On the contrary, both XOM and CVX have sizable exposure to natural gas both as an asset and also an income stream. The role of natural gas is indeed smaller than oil but is not negligible at all.
- From an asset valuation perspective, just the current worth of their proven oil and gas reserve is already substantially above their current stock prices, leaving a margin of safety of more than 20% for CVX and more than 40% for XOM.
- From an income perspective, assuming a $6 to $7 NG price and an average valuation of 9.5x to 10x cash flow, this can support a target price of around $100 for XOM and around $200 for CVX.
- Finally, natural gas prices and oil prices are not always correlated and can even move in completely opposite directions (such as during 2018 and 2019). Such lack of correlation (or even negative correlation) at times can provide valuable diversification to the income streams of both stocks.
Be the first to comment