

imaginima
A guest post by Ovi
Below are a number of Crude oil plus Condensate (C + C ) production charts for Non-OPEC countries created from data provided by the EIA’s International Energy Statistics and updated to April 2022. This is the latest and most detailed world oil production information available. Information from other sources such as OPEC, the STEO and country specific sites such as Russia, Brazil, Norway and China is used to provide a short-term outlook for future output and direction for a few countries and the world.
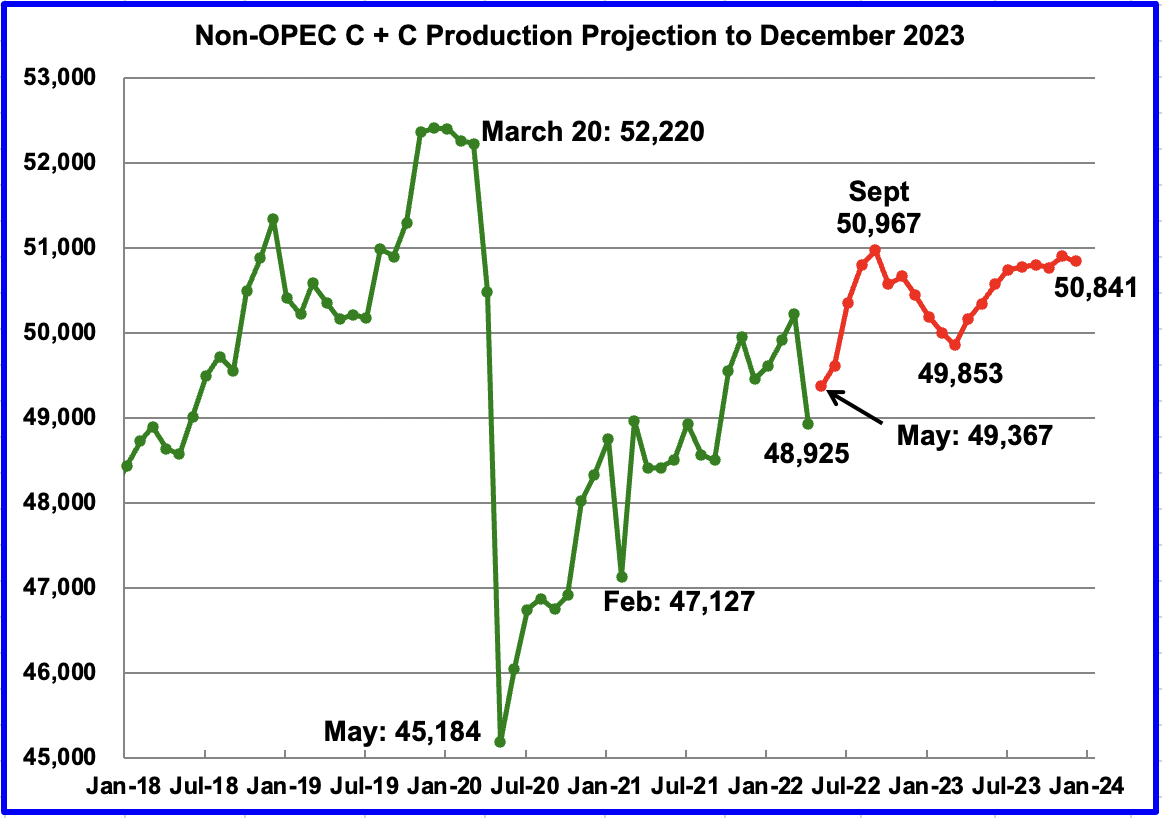
April Non-OPEC production decreased by 1,294 kb/d to 48,925 kb/d. Of the 1,294 kb/d decrease, the biggest decreases came from Russia, 965 kb/d, Kazakhstan, 175 kb/d, Canada, 95 kb/d and Norway, 78 kb/d. There were no significant offsetting increases. The April 2022 output of 48,925 kb/d is 3,295 kb/d lower than the March pre-covid rate of 52,220 kb/d.
Using data from the August 2022 STEO, a projection for Non-OPEC oil output was made for the time period May 2022 to December 2023. (Red graph). Output is expected to reach 50,841 kb/d in December 2023. This forecast is 456 kb/d lower than predicted in July. The production rise to 50,967 kb/d by September 2022 is due to projected increases by OPEC+ and the U.S. Note that the September 2021 high is the high for 2022 and 2023.
Oil Production Ranked by Country
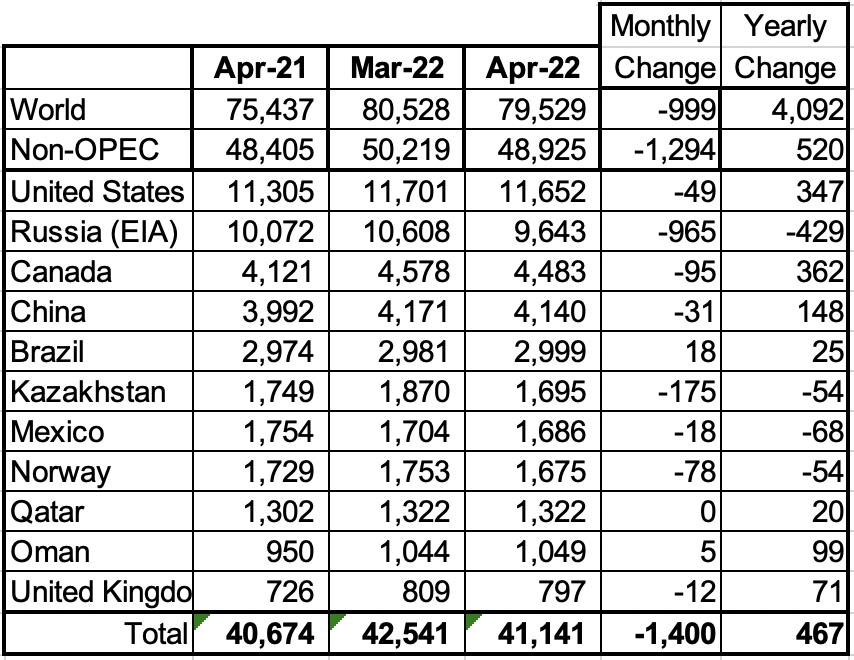
Above are listed the world’s 11 largest Non-OPEC producers. The original criteria for inclusion in the table was that all of the countries produced more than 1,000 kb/d. The UK has been below 1,000 kb/d since January 2021.
In April 2022, these 11 countries produced 84.1% of the Non-OPEC oil. On a YoY basis, Non-OPEC production increased by 520 kb/d. World YoY April output increased by 4,092 kb/d.
Production by Country
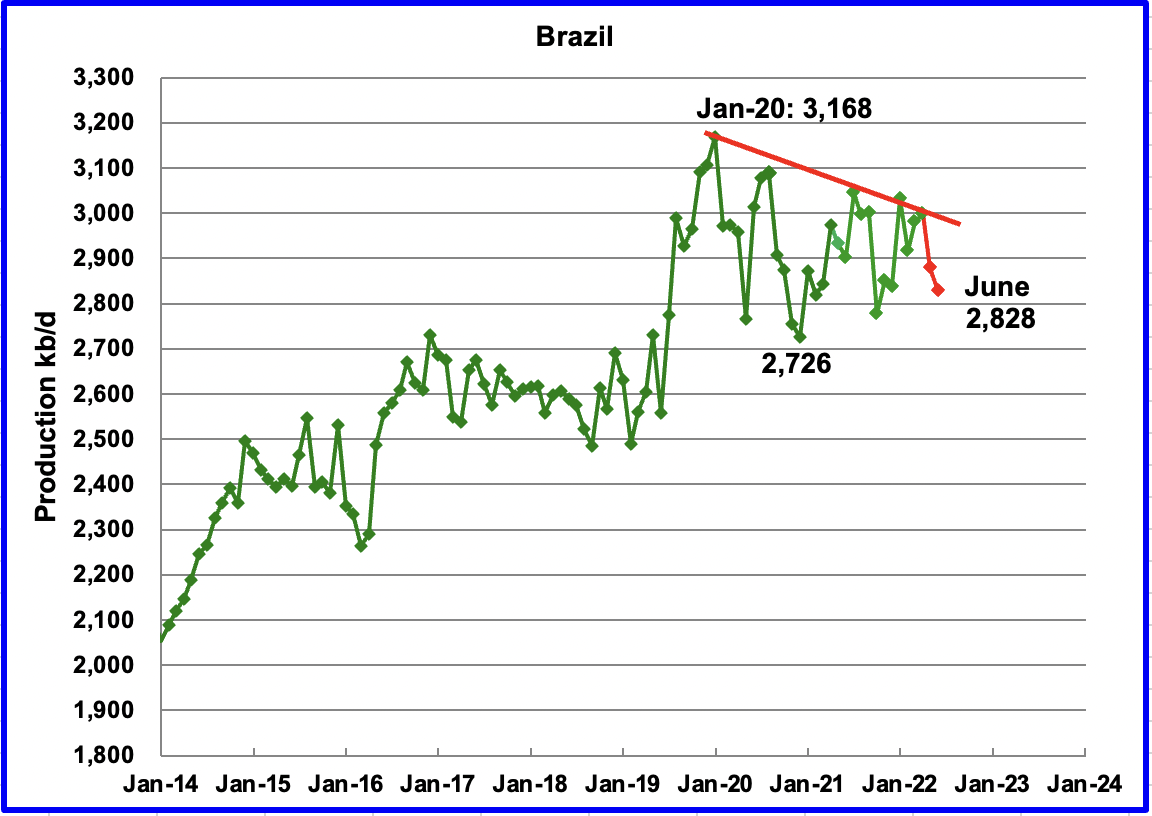
The EIA reported Brazil’s April production increased by 18 kb/d to 2,999 kb/d.
Brazil’s National Petroleum Association (BNPA) reported that May’s output drop was 120 kb/d. The drop was mainly due to interruptions in offshore maintenance at the Tupi field, according to OPEC.
On July 20, 2022, the BNPA reported that June production dropped again. No information on the June drop to 2,828 kb/d is available. However, a new field came online on May 1, 2022 and it is surprising that no production increase was reported for June.
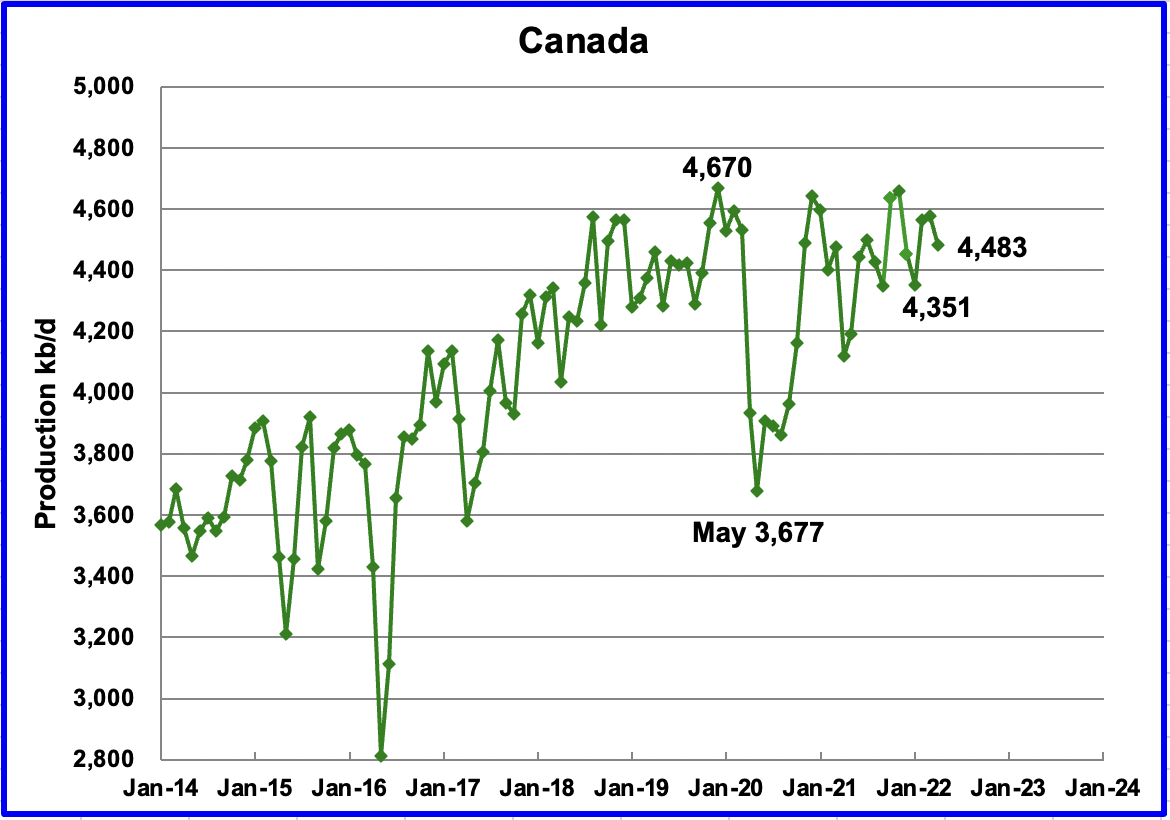
According to the EIA, Canada’s March output decreased by 95 kb/d to 4,483 kb/d. Preliminary data from the Canadian Energy Regulator indicates that synthetic crude production was down by 100 kb/d in April.
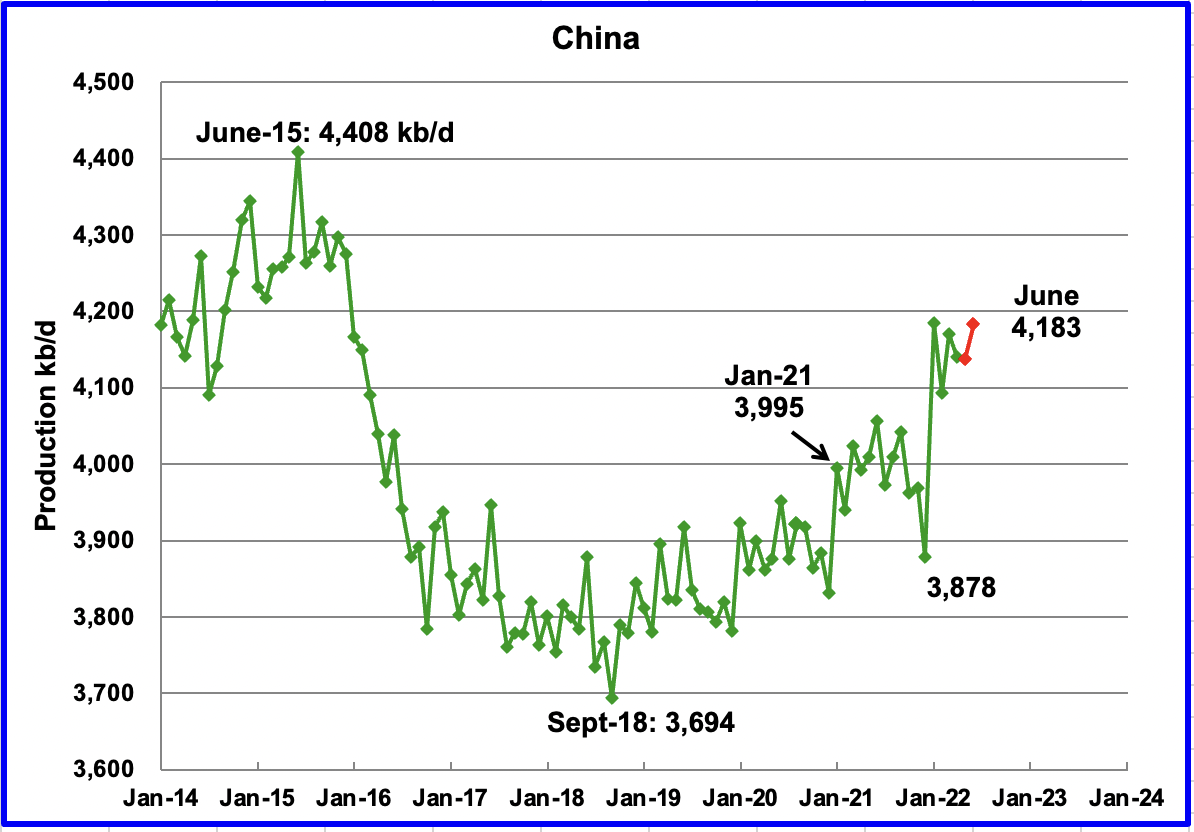
The EIA reported China’s output decreased by 31 kb/d to 4,140 kb/d in April. China reported that its output dropped in May and then increased in June by 46 kb/d to 4,183 kb/d. (Red markers).
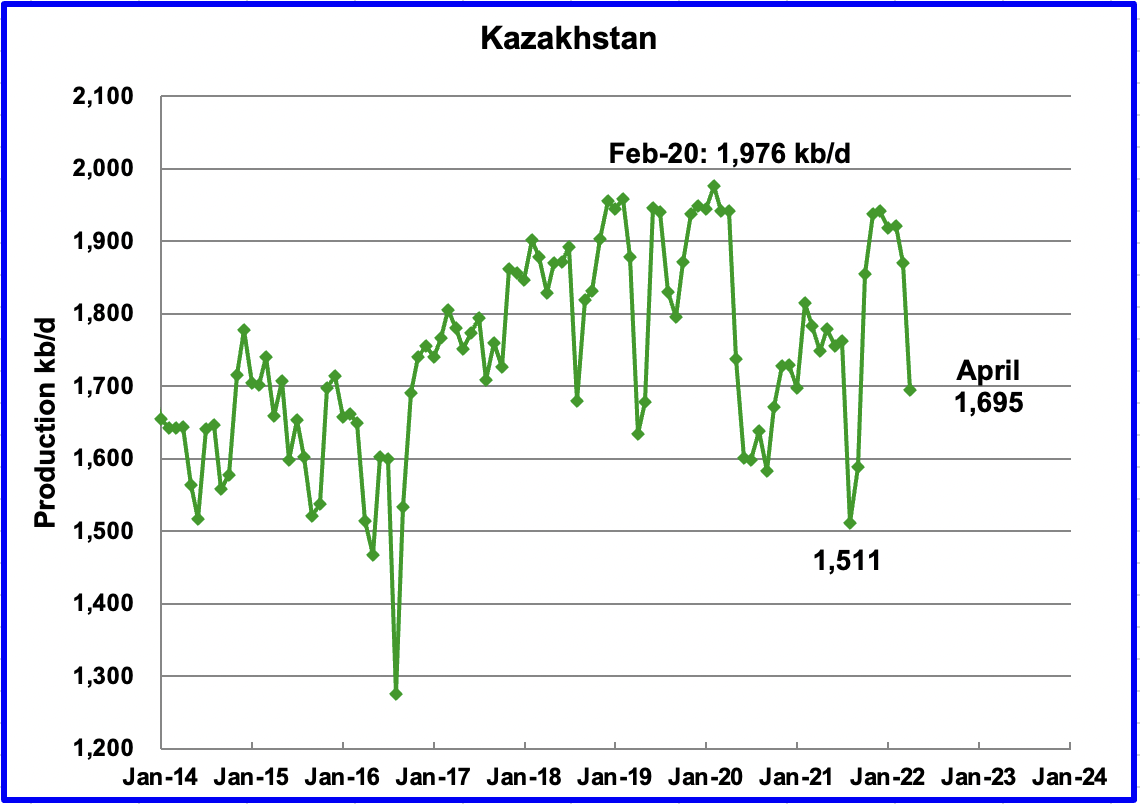
Kazakhstan’s output decreased by 175 kb/d in April to 1,695 kb/d. April output was projected to drop due to required repairs at a damaged loading terminal in a Black Sea port in Russia, according to this source. The projected drop was 320 kb/d but actually came in less at 175 kb/d.
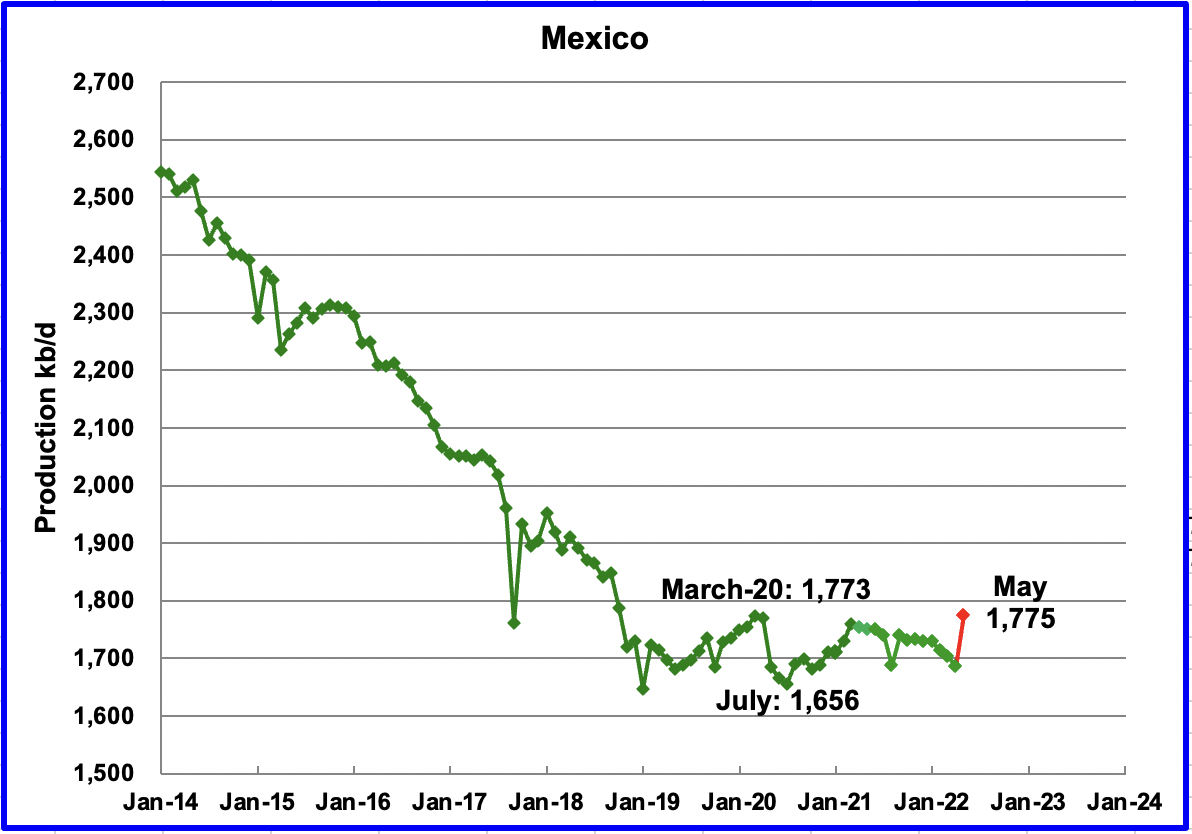
Mexico’s production as reported by the EIA for April dropped by 18 kb/d to 1,686 kb/d.
Data from Pemex showed that May’s output was 1,775 kb/d. However, the EIA reduces Mexico’s official oil production by close to 70 kb/d each month due to a different definition for crude plus condensate.
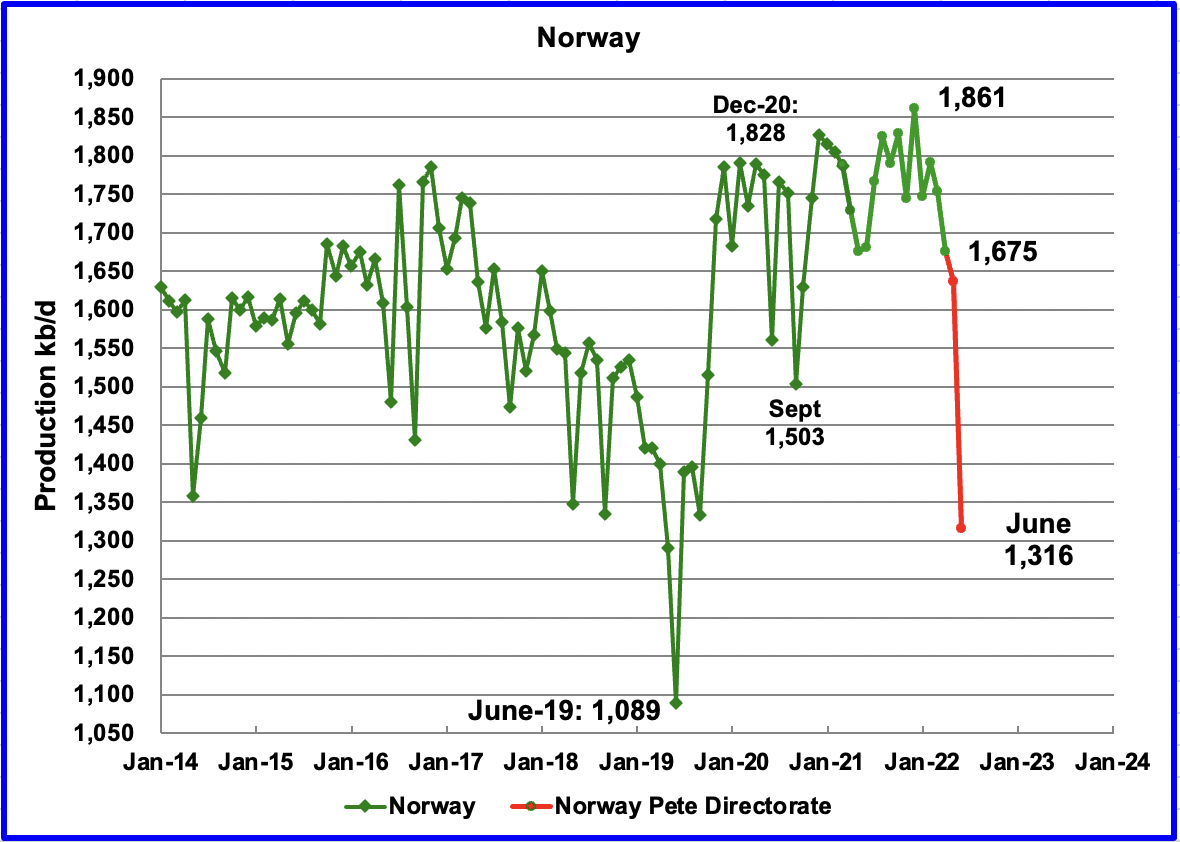
The EIA reported that Norway’s April’s production decreased by 78 kb/d to 1,675 kb/d.
The Norway Petroleum Directorate (NPD) reported that production decreased from April to June to 1,316 kb/d. (Red markers.). According to the NPD: “: Oil production in June is 0.2 percent lower than the NPD’s forecast and 4.2 percent lower than the forecast so far this year.
According to OPEC, the continuing drop was due to summer maintenance in offshore platforms and some operators prioritizing gas production.
Growth is expected in late 2022 when the second phase of the Johan Sverdrup field development starts production.
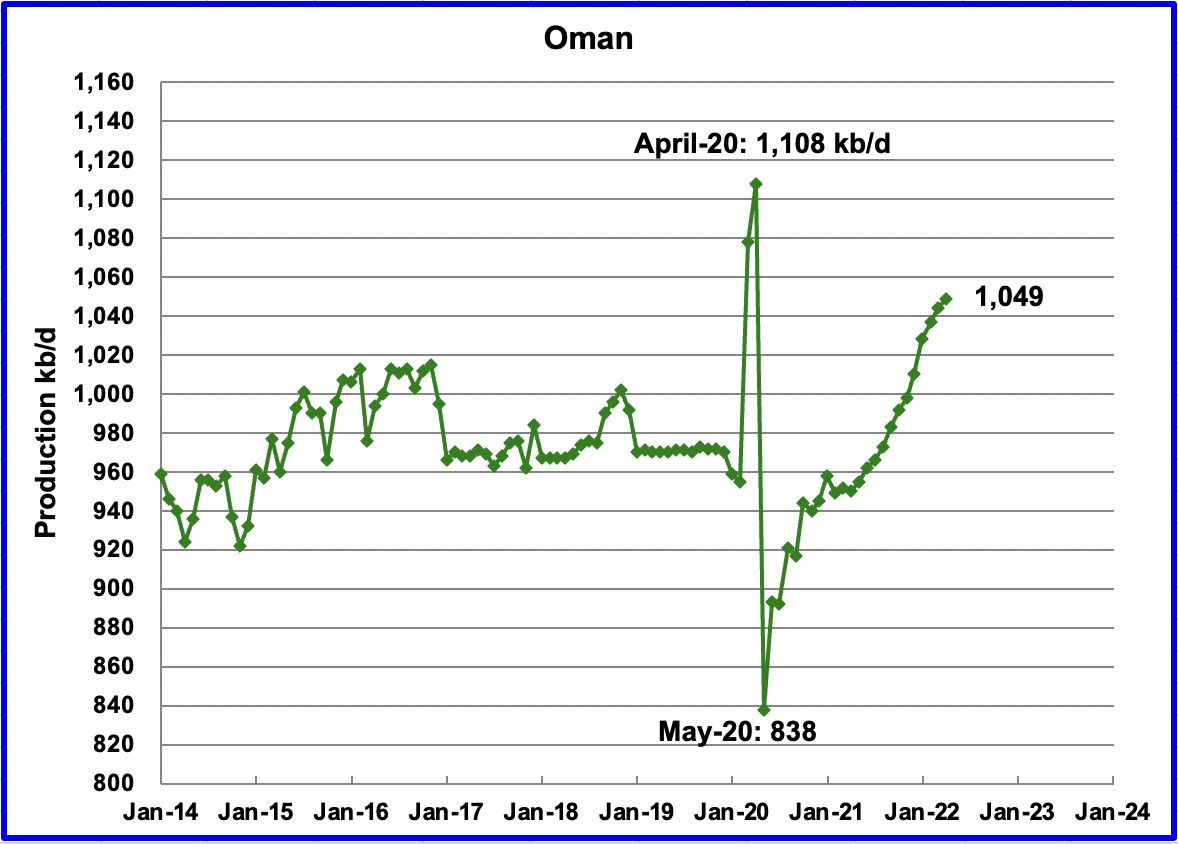
Oman’s April production increased by 5 kb/d to 1,049 kb/d.
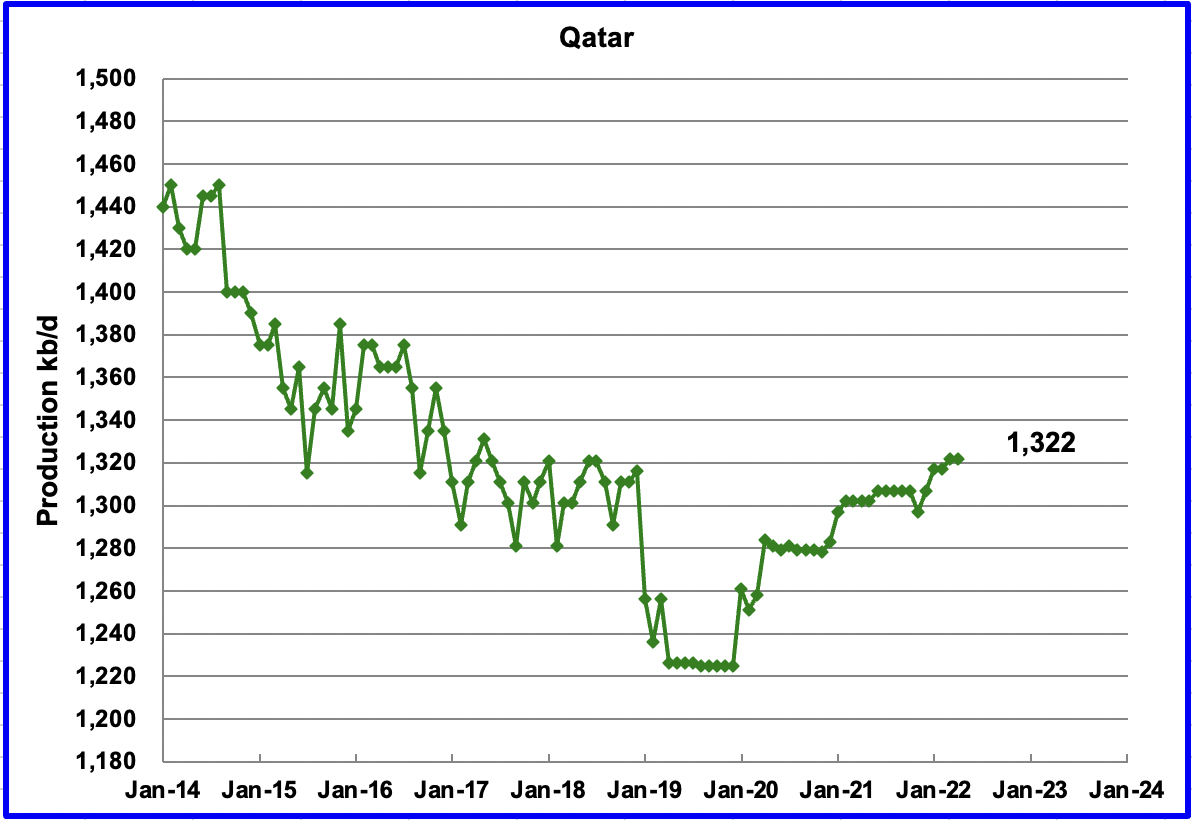
April’s output was unchanged at 1,322 kb/d.
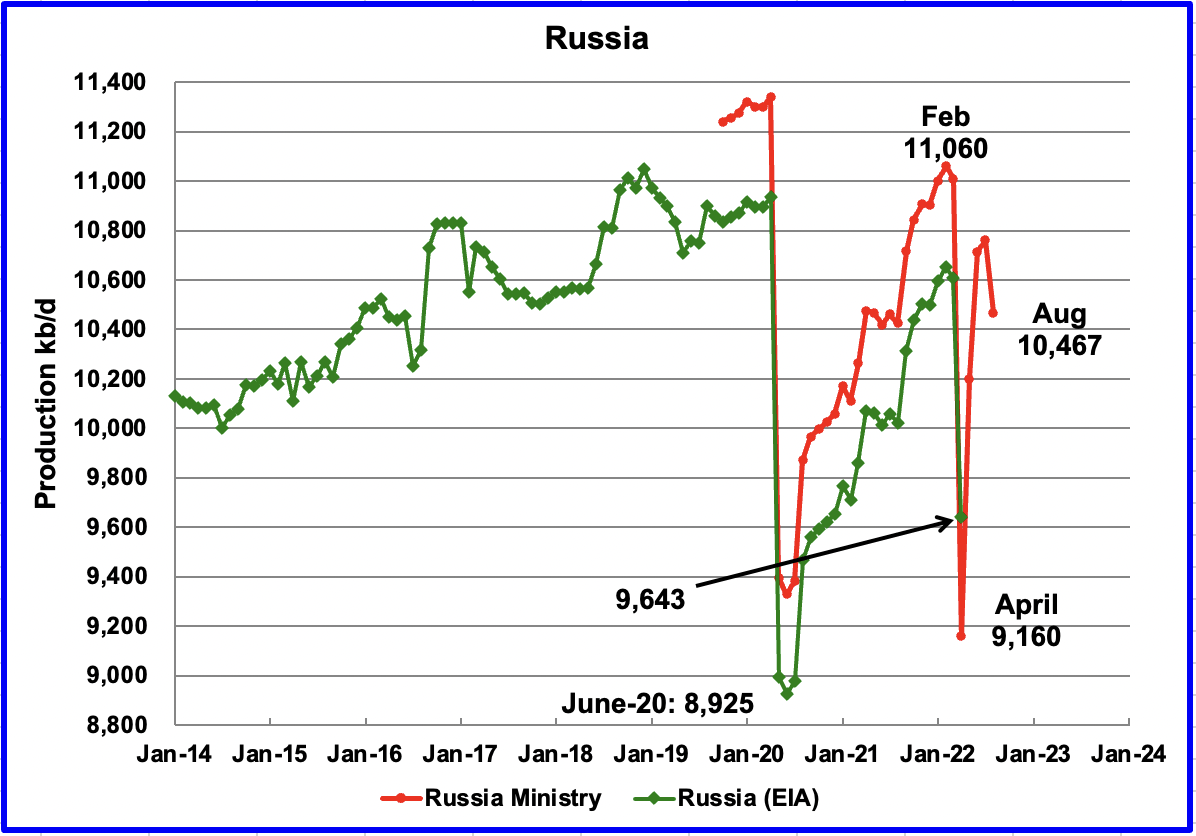
The EIA reported that Russian output decreased by 965 kb/d in April to 9,643 kb/d. According to this source, August’s (first week estimate) production decreased by close to 300 kb/d to 10,467 kb/d. (Note the 1.428 million tonnes per day reported in the article was converted to kb/d using 7.33 barrels/tonne)
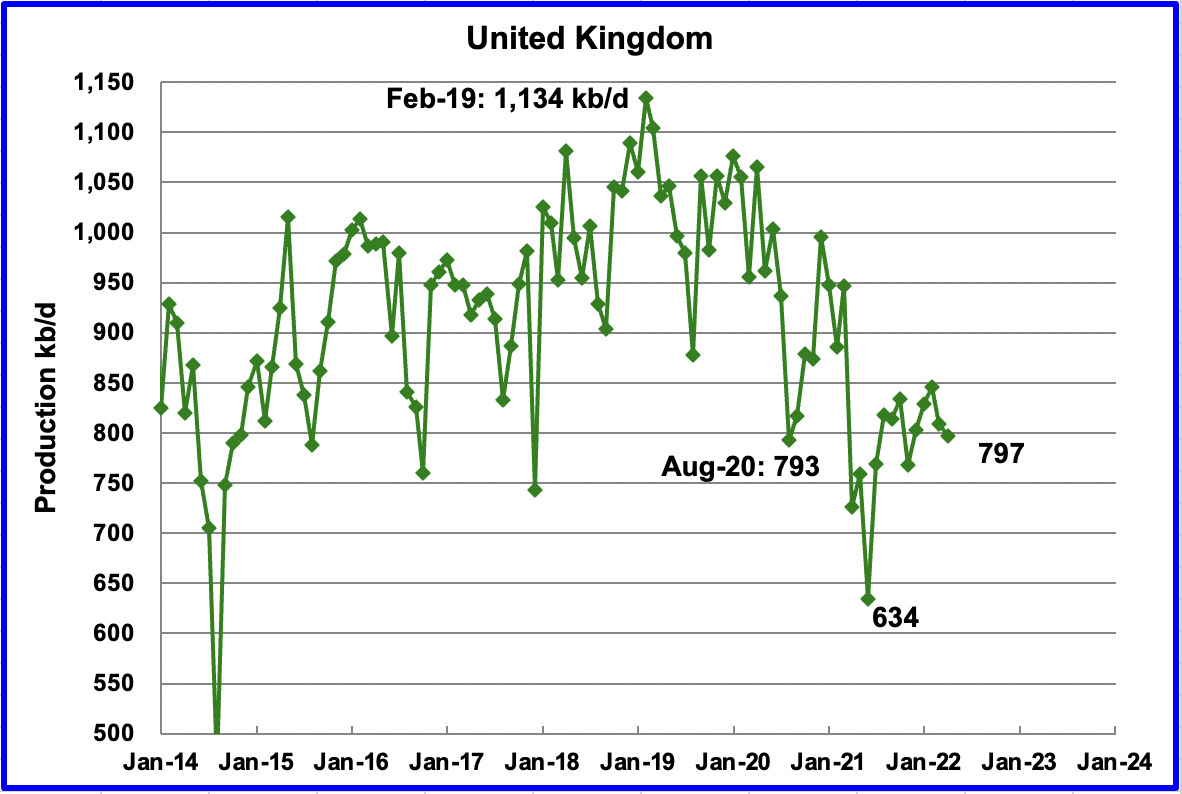
UK’s production decreased by 12 kb/d in April to 797 kb/d. The chart indicates UK oil production entered a steep decline phase starting in February 2019. On a YoY basis, production is up 71 kb/d.
June output is expected to be essentially unchanged according to OPEC.
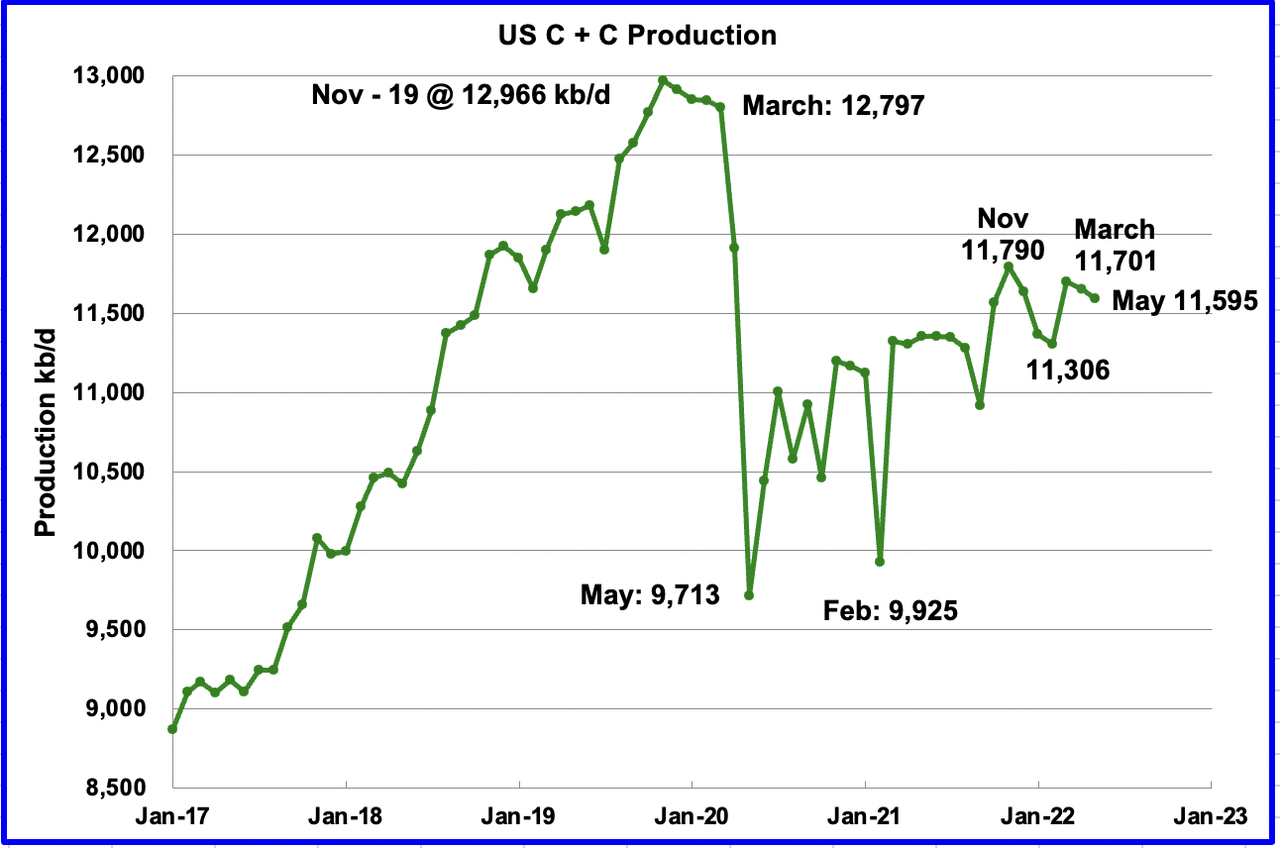
U.S. May production decreased by 57 kb/d to 11,595 kb/d due to weather.
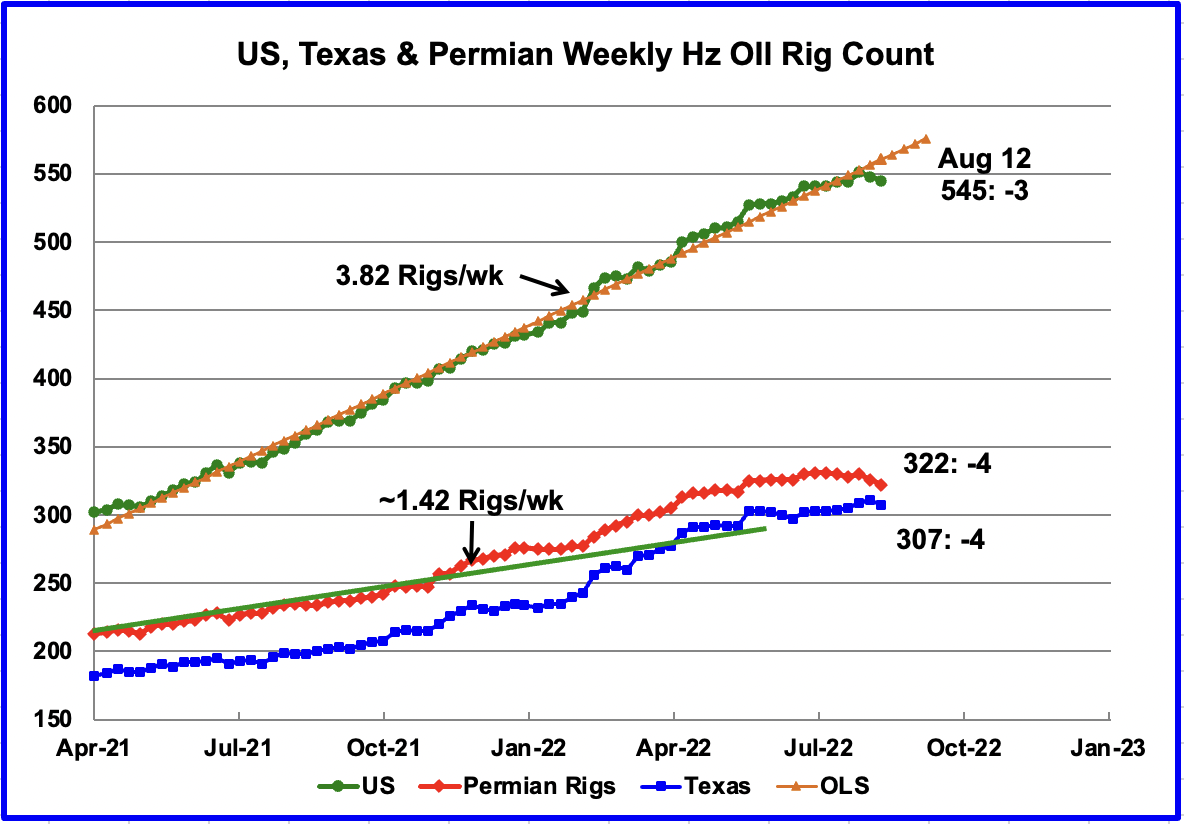
While there was a small drop, 6, in the US rig count over the last two weeks, the bigger story is occurring in the Permian (Texas and New Mexico). The number of hz oil rigs in the Permian has been essentially unchanged since mid May when 320 were operating.
Rig Count for August 12
US Tot: Down 3 for the wk. Down 6 from the high of 551 two wks ago.
Permian: Down 4 for the wk. Down 8 from the high of 330 two wks ago.
Texas: Down 4 for the wk from 311 last wk.
New Mexico: Down 1 for the wk. Down 10 from 6 wks ago.
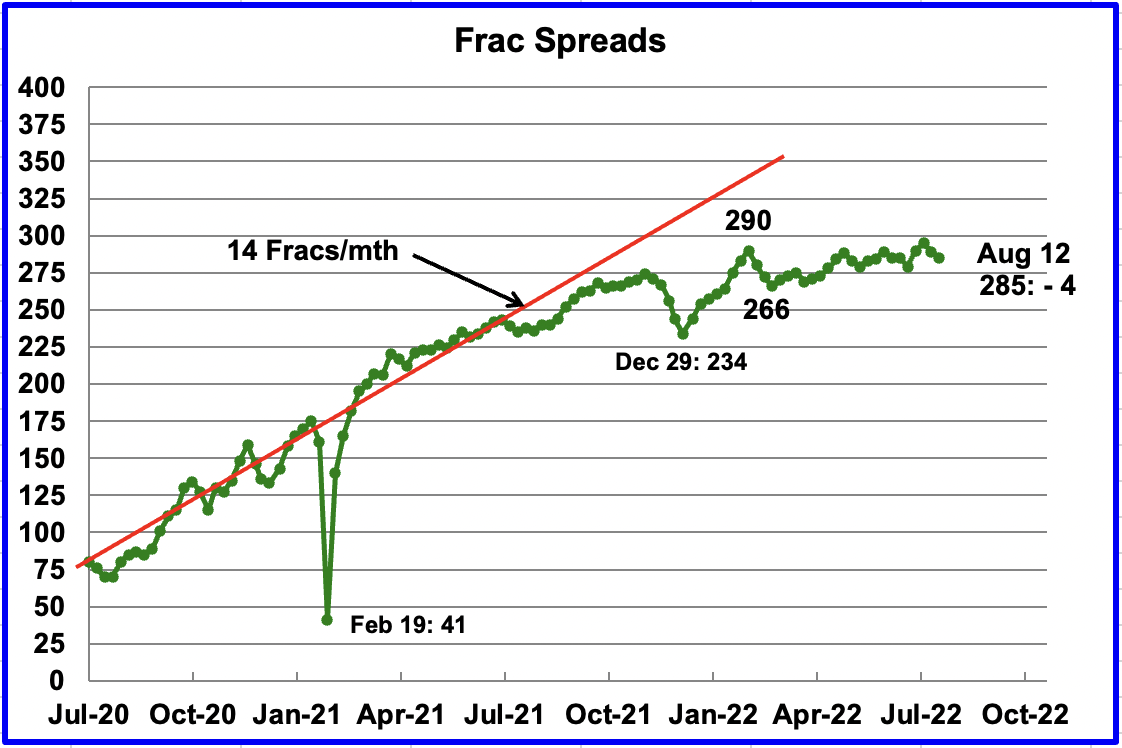
For the past 6 months, the growth in frac spreads has not been keeping up with the growth in rigs. In the week ending August 12, 4 Frac Spreads were deactivated for a total of 285. The 285 are 5 fewer than the 290 operating in the week of February 25 and 10 more than were operational in November 2021.
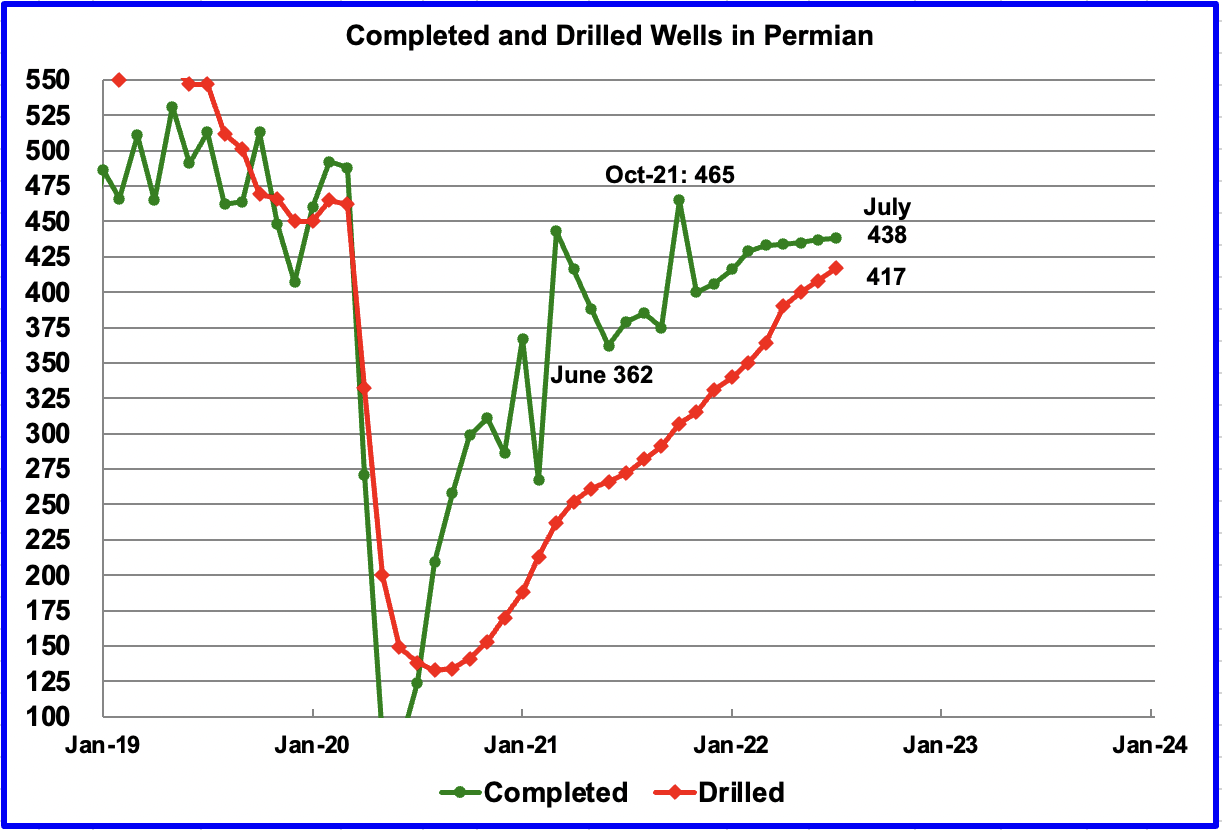
The impact of the slowing growth in Frac Spreads since last November can be seen in this chart. From November 2021 to July 2022, the monthly completion rate of DUCs/wells has slowed relative to the rate in 2021. More wells were completed in October 2021 than in July 2022, 465 vs 438. Over the last five months, monthly completions have been essentially flat at 435 per month.
Drilling continues to increase to replace the additional DUCs that were completed. The gap between drilled and completed wells in the Permian has reached a new current low of 21 DUCs.
Considering how completions in the Permian have slowed since February and the little change in Frac spreads since November, one needs to consider the following question: Have the rig and frac crews arrived at a comfortable equilibrium for a slow and steady pace for drilling and completions? Costs and a shortage of parts and equipment may be forcing a new reality, along with the renewed push to return more capital to investors.
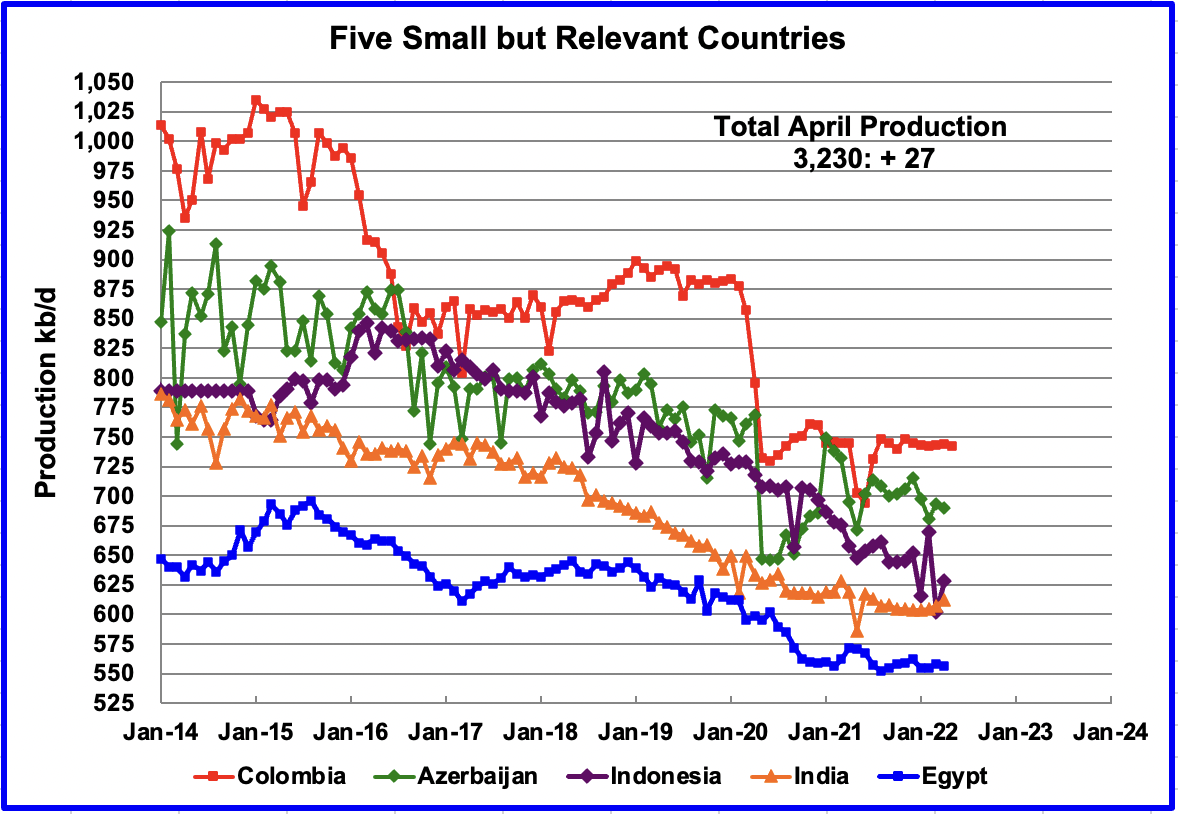
These five countries complete the list of Non-OPEC countries with annual production between 500 kb/d and 1,000 kb/d. Their combined March production was 3,230 kb/d, up 27 kb/d from March’s 3,203 kb/d.
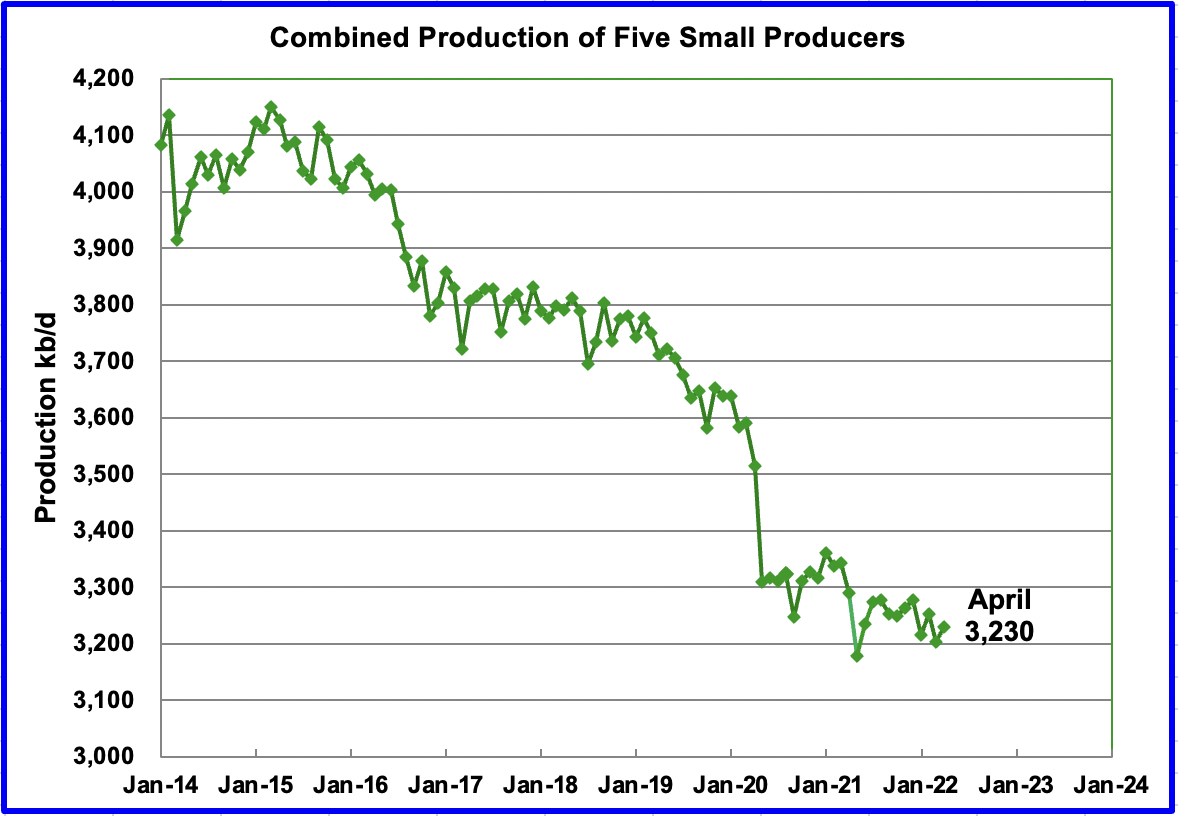
The overall output from the above five countries has been in a slow steady decline since 2015 and the decline continues.
World Oil Production
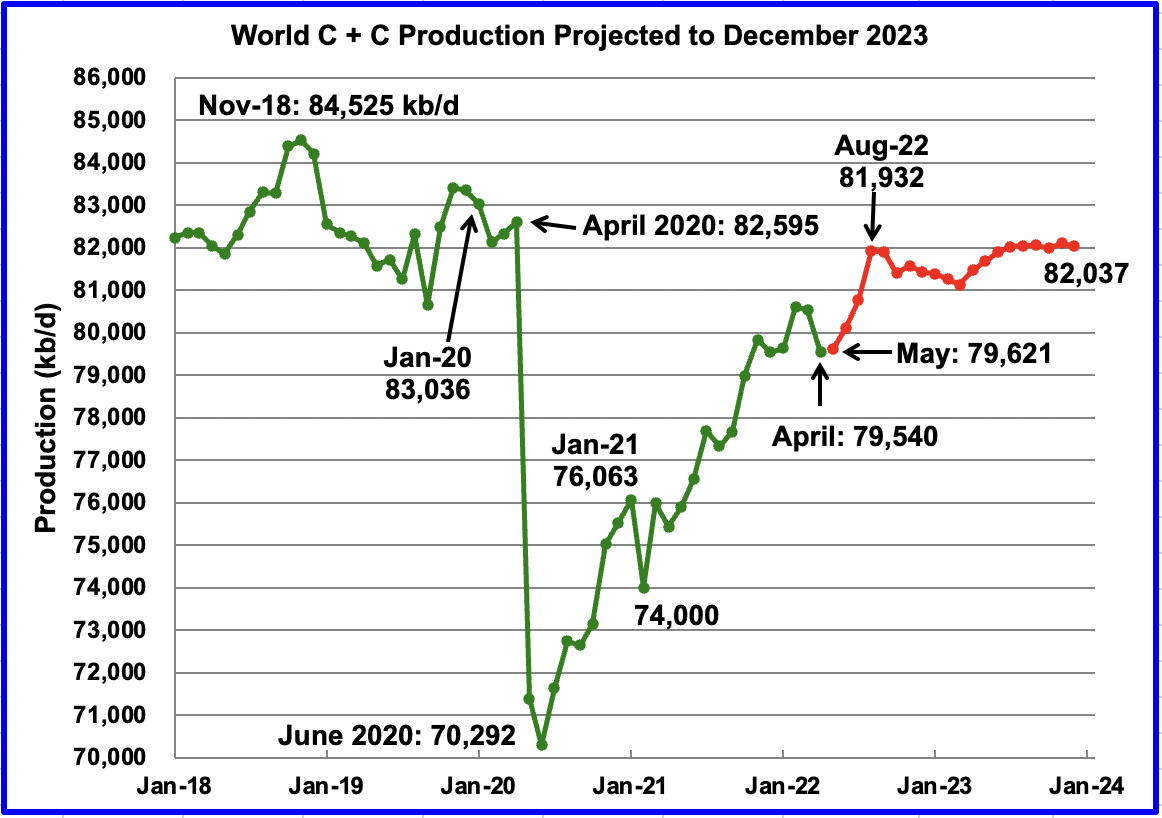
April’s world oil production decreased by 999 kb/d to 79,540 kb/d according to the EIA (Green graph).
The biggest decliner was Russia at 965 kb/d. The biggest offsetting increases came from Saudi Arabia at 300 kb/d and Iraq at 100 kb/d.
This chart also projects world C + C production out to December 2023. It uses the August 2022 STEO report along with the International Energy Statistics to make the projection. (Red markers).
It projects that world crude production in December 2023 will be 82,037 kb/d, 398 kb/d lower than projected in the July report. The rise of close to 2,300 kb/d from May to September seems aggressive but is associated with projected US and OPEC+ production increases. After August 2022, World production is essentially flat at 82,000 kb/d out to December 2023.
Considering the upcoming production losses shown above in Brazil, Kazakhstan and Norway, the smooth production increase from April to September appears to be optimistic.
Decline Rate
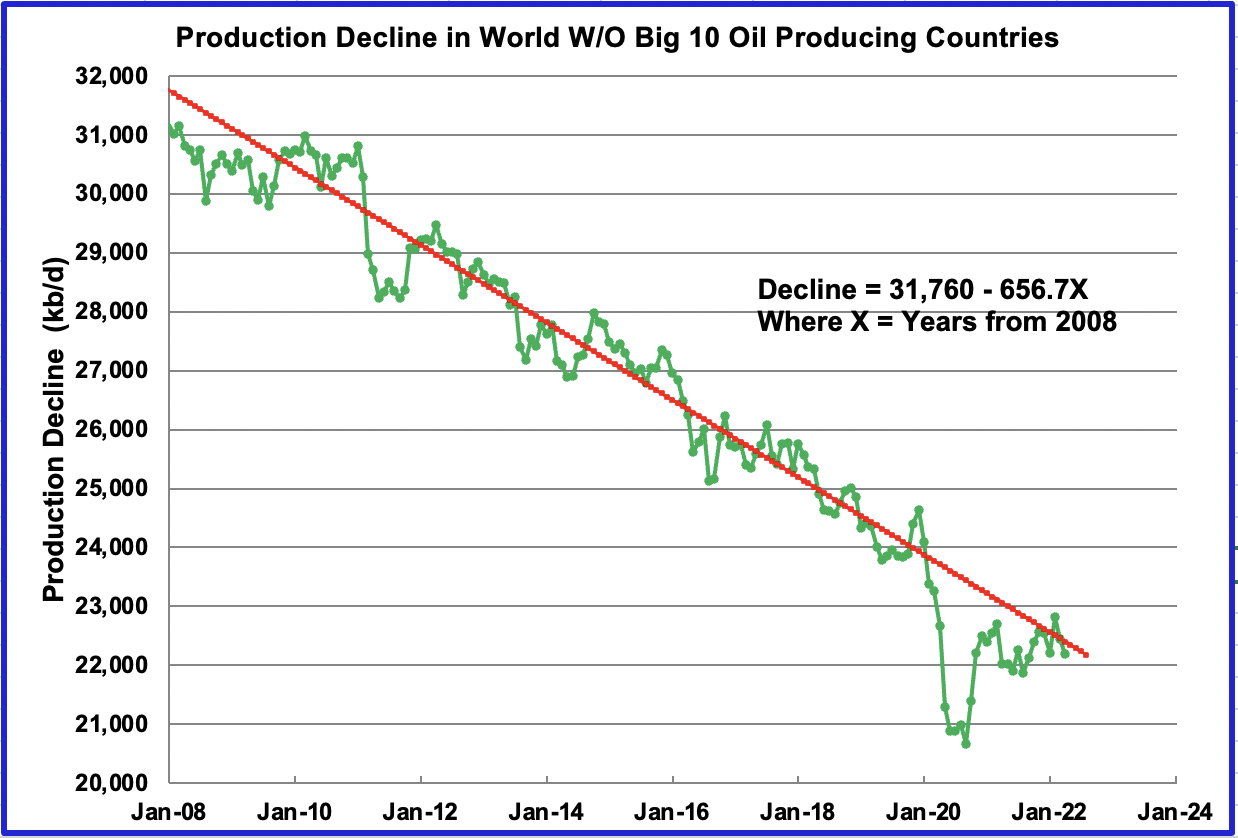
This chart shows the decline rate of World oil production, not including the World’s big 10 oil producers. The OLS line covers December 2009 to April 2022. The analysis does not include the data points during the big covid drop but does add in the latest 3 months since production in most of these countries has returned to normal. The decline rate continues to be close to 650 kb/d/yr and has remained unchanged for the last 12 years.
1) Short-Term Energy Outlook
The August STEO provides projections for the next 20 months, starting with June 2022 to December 2023, for U.S. C + C and All Liquids for other countries.
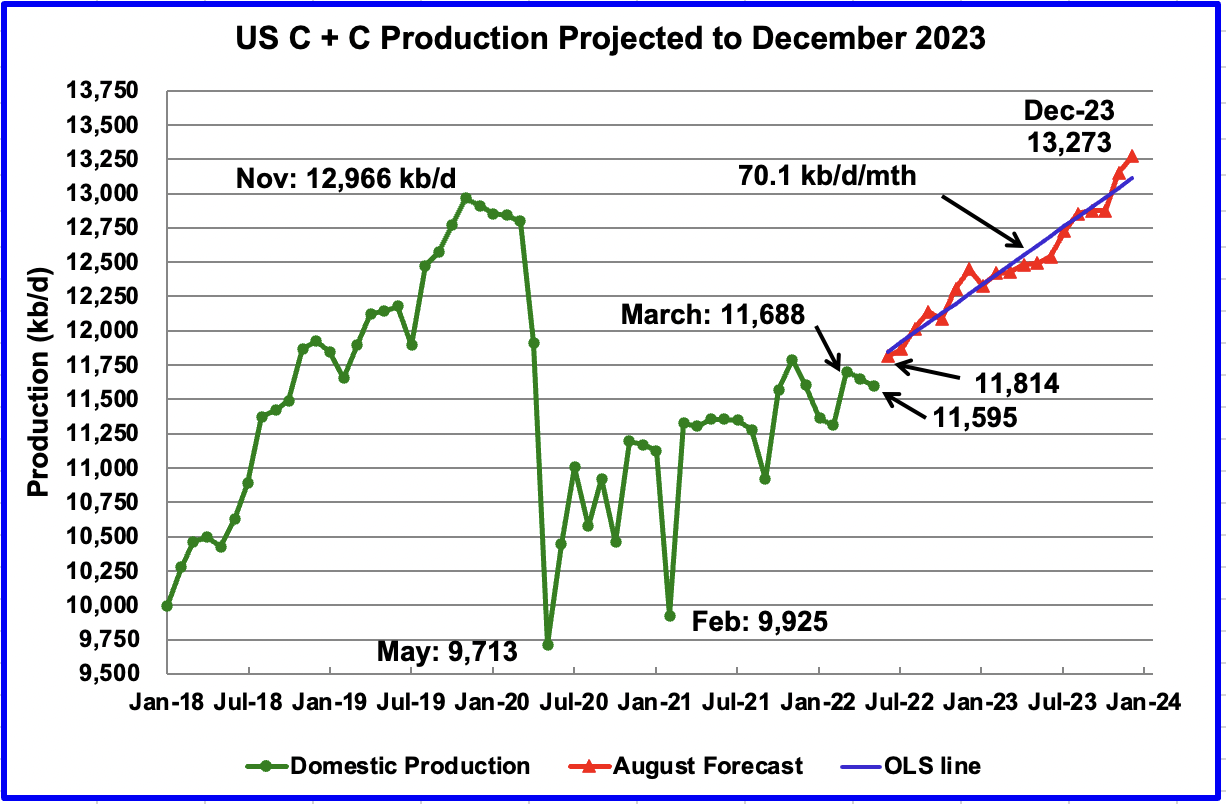
The August 2022 STEO revised down its projected US oil output from June 2022 to December 2023. In December 2023 output is expected to reach 13,273 kb/d, 64 kb/d lower than reported in the July report.
June production is projected to be 11,814 kb/d, an increase of 219 kb/d over May. However, it should be noted that the average of the June weekly EIA production numbers is 12,033 kb/d, 219 kb/d higher. Clearly, this indicates that the STEO has their own independent sources. It will be interesting to see which organization gets closer to the actual June output numbers.
Using only the projected data from June 2022 to December 2023 to fit an OLS line, the STEO is forecasting production will increase at an average rate of 70.1 kb/d/mth. If the December 2023 output is achieved, it will be 307 kb/d higher than the November 2019 record. The monthly rate of 70.1 kb/d translates into a yearly increase of 841 kb/d.
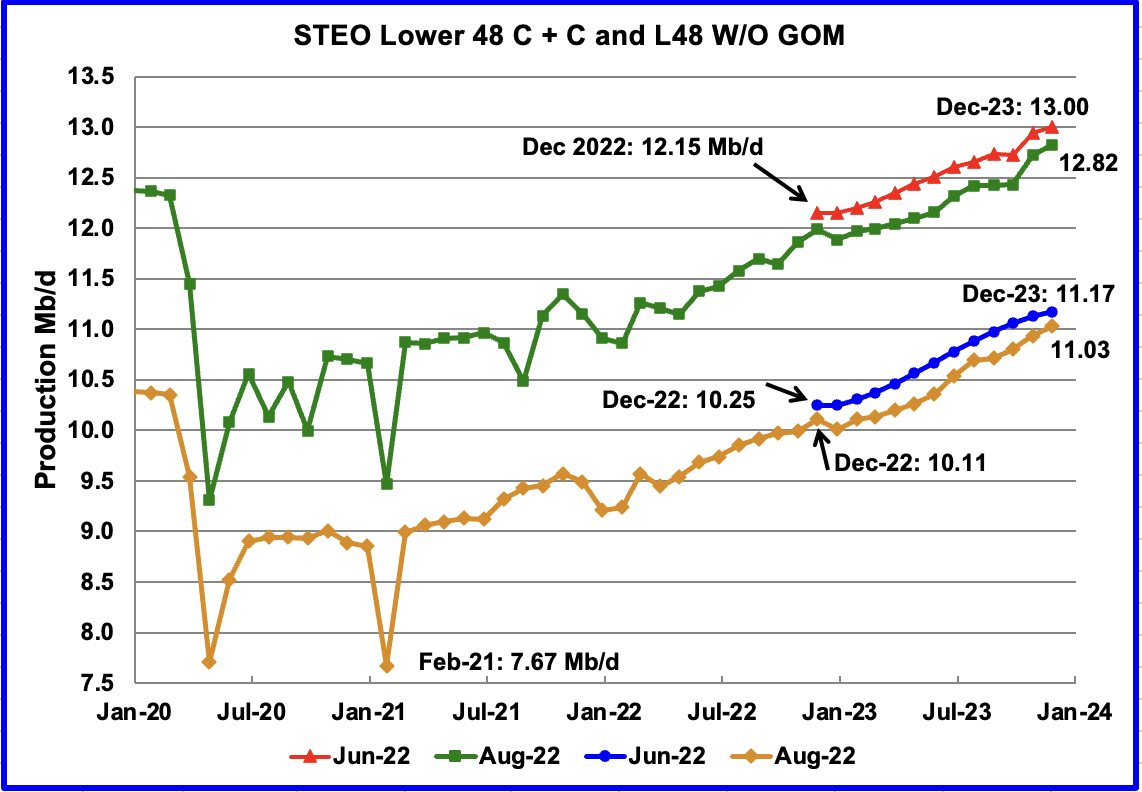
This chart compares the STEO forecast for the L48 from the June report with the current August report to better illustrate how the output forecast for August 2022 changed. For the Lower 48, the December 2023 output has been revised down by 180 kb/d to 12.82 Mb/d.
The August output projection for the Onshore L48 states has also been revised down from the June forecast. For December 2023, output was lowered by 140 kb/d to 11.03 Mb/d.
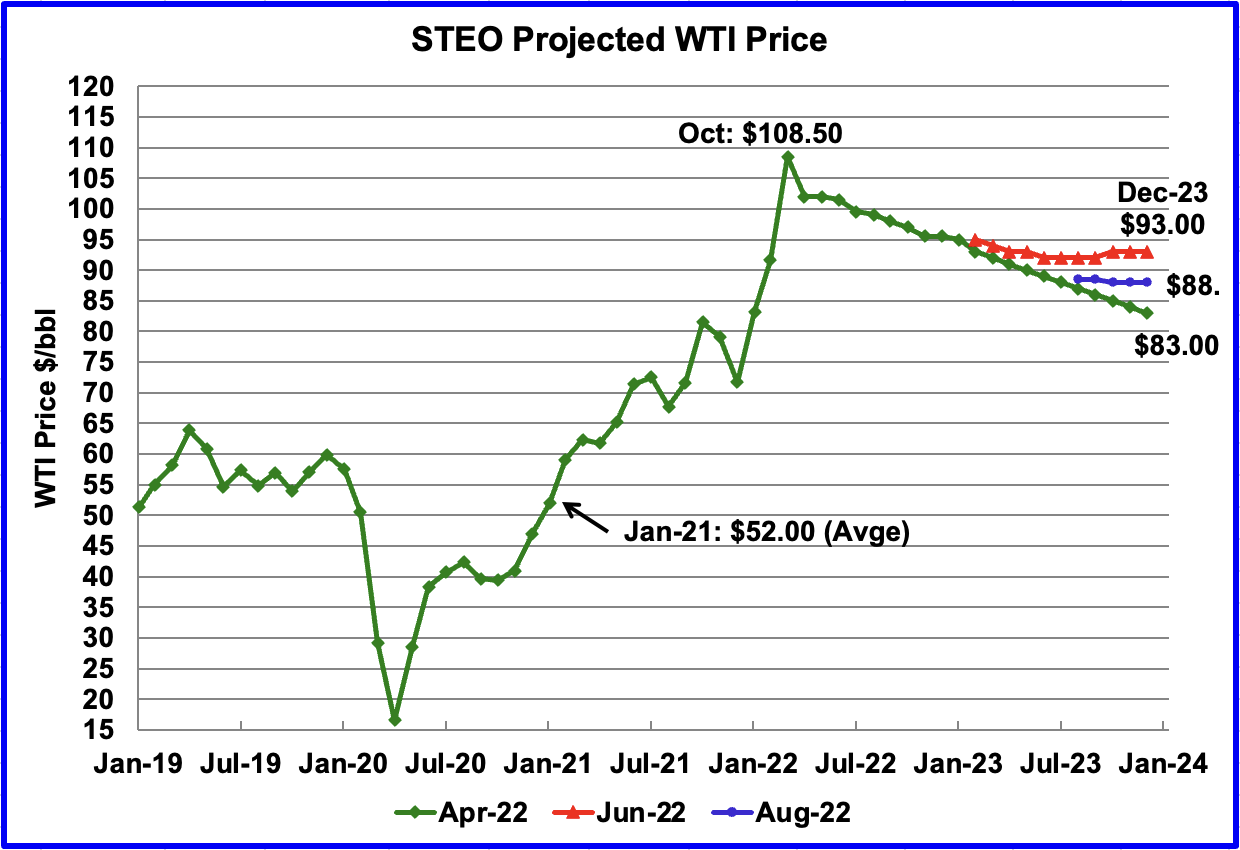
The August 2022 STEO oil price forecast continues to show a steady decline from the EIA’s March peak of $108.50/bbl to $88/bbl in December 2023, blue markers. Essentially, the EIA is continuing to forecast that the only direction for the price of WTI going forward is down to the $90/b range. However, what is different with their latest forecast is that the price of oil stabilizes in the $90/b area during the latter half of 2023.
The August forecast has been added to the chart to show how the STEO WTI forecasts from April to June have converged on a year end 2023 WTI price in the $90/b range.
The September WTI contract settled at $86.53 on August 16, $11.47/b lower than the EIA’s forecast average price of $98.00/b for the September contract.
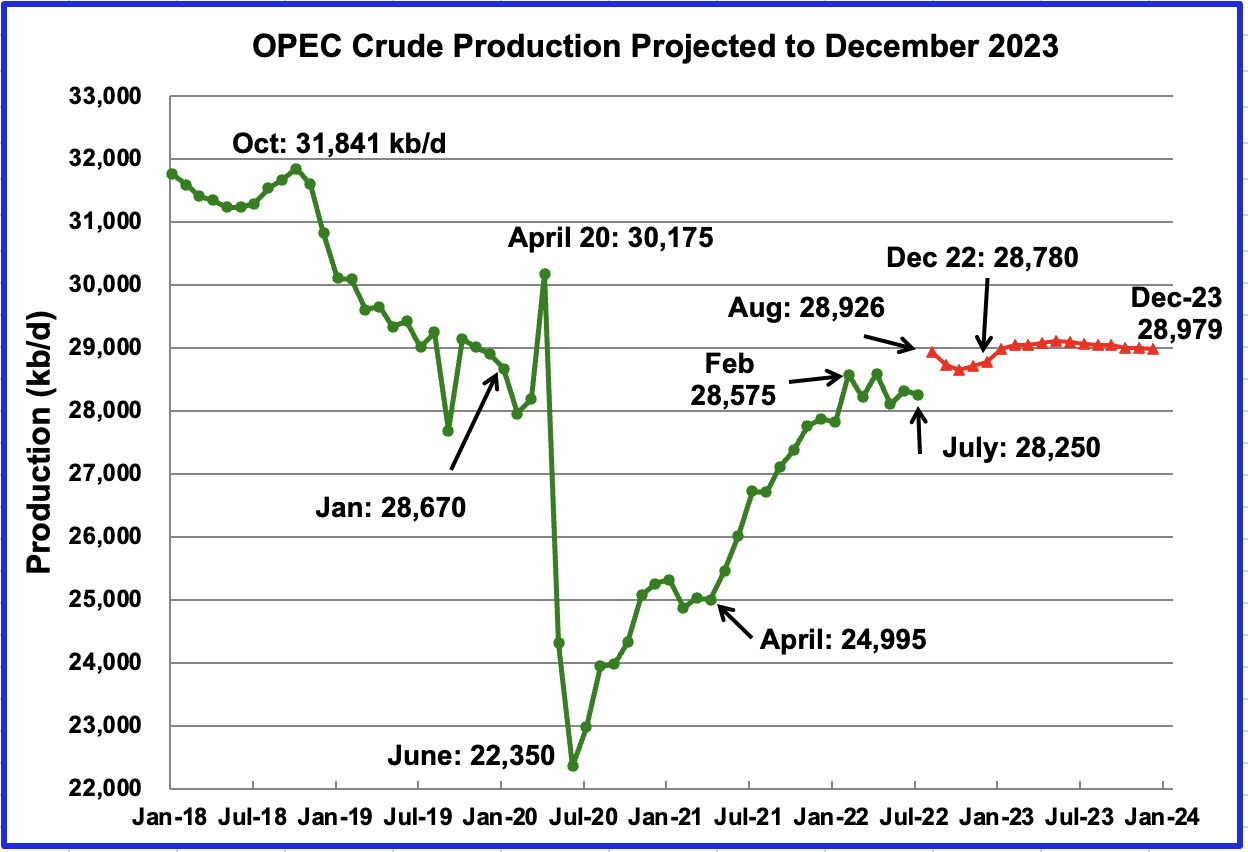
This chart shows the STEO’s August forecast for OPEC crude output from August 2022 to December 2023. OPEC’s output is projected to be essentially unchanged from August 2022 to December 2023, except for the dip in October and November. The July forecast of 28,250 kb/d was actually 650 kb/d lower than the reported OPEC production.
August could be closer to reality since OPEC reported July production to be 28,896 kb/d.
The August OPEC report indicates that the call on OPEC in Q4-22 is 29.79 Mb/d, which is 1.01 Mb/d higher than the STEO is forecasting for December 2022, 28,780 kb/d.
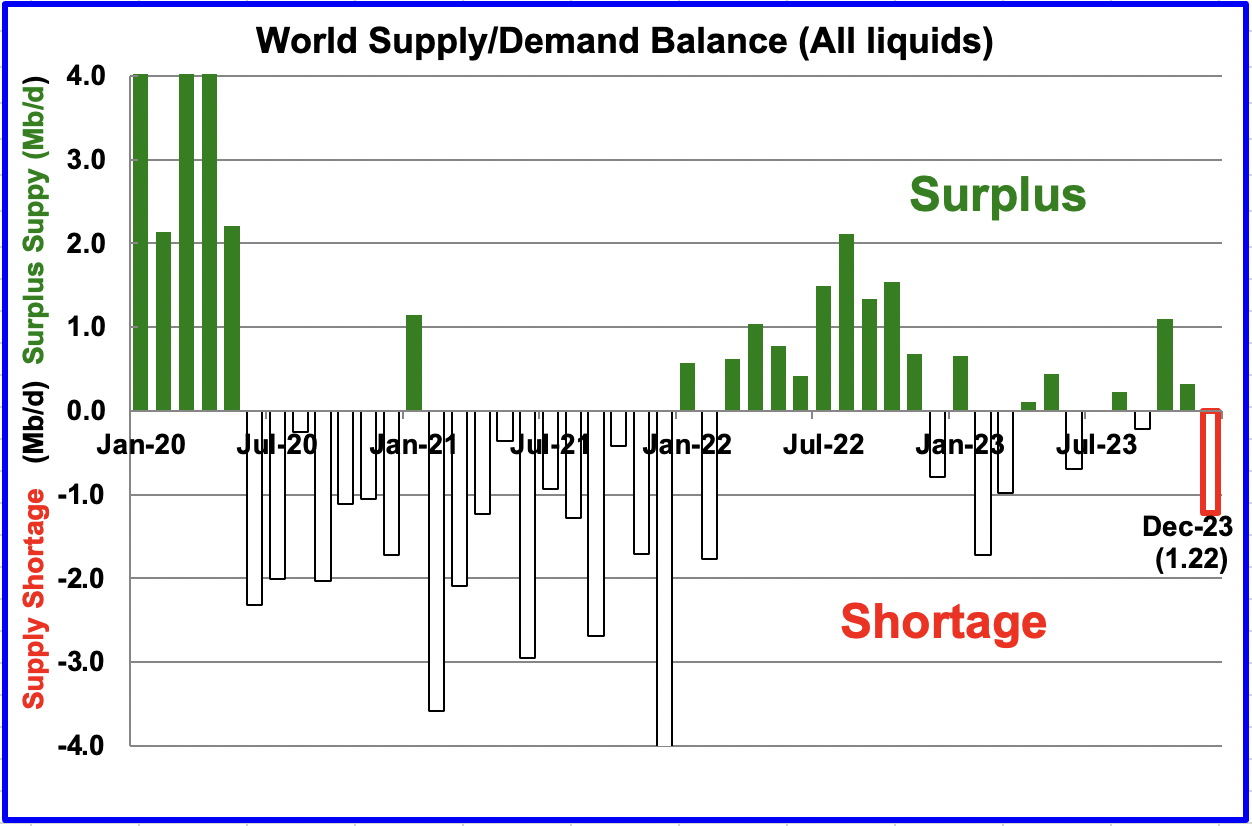
This chart shows the historical world supply/demand balance up to June 2022 and after that, the EIA’s forecast out to December 2023. The surplus of over 1,000 kb/d between August and October is overdone with the current tight market and expected increase in demand heading into winter. The supply demand situation for 2023 is expected to be very tight with December 2023 showing over 1,000 kb/d shortage.
Editor’s Note: The summary bullets for this article were chosen by Seeking Alpha editors.
Be the first to comment