

sommart/iStock via Getty Images
Introduction
Royce Value Trust (NYSE:RVT) invests in small and micro cap companies that mainly operate across the US and other developed markets. The fund outperformed the Russell 2000 benchmark since inception in 1986, with 11.07% total return each year, versus the benchmark’s 9.85% return. Thus, RVT has a long term and consistent track record that has done pretty well. As such, the present market downturn has resulted in considerable value on RVT, since investments in smaller cap stocks react more greatly to a market downturn and general risk aversion. Consequently, we are now seeing very high dividend yields on RVT, exceeding 8% and expected to do so for their forward forecast. This article discusses the merits of RVT as an investment and its attractive valuation through the dividend growth model.
Macro take on the small cap, value style
During market downturns, the smaller cap segment of the stock market which RVT invests in tends to underperform. This is due to the higher beta nature of this segment, and for RVT’s case, the beta stands at 1.44 times. This means that should the stock market move 10% either downward or upward, RVT would usually move by 14.4% in the same direction. Given the present market conditions with the war and general risk aversion, RVT has accordingly declined. However, once there is news of peace talks between Russia and Ukraine and inflation starts to ease because of the subsequent decline in commodities prices, RVT should be able to do better. A high beta also means RVT is well-positioned to participate in a cyclical market upswing.
Furthermore, the value space that RVT focuses on is poised to do well when investors are nervous about growth stocks and were disillusioned following the meme stock craze of 2021. When markets think of value stocks, fundamentally-based investment principles come to mind. Over the long term, small cap stocks have also proven to outperform their larger peers. According to Royce Investment Partners, the total return performance of small cap value stocks is expected to outperform growth stocks as “small-cap value is still priced near the bottom of its 20-year valuation range compared with small-cap growth.” As a longer term investment, RVT is well positioned since small cap total return exceeded that of large cap stocks, an observation affirmed by Schroders and Barron’s. Furthermore, as we shall explain below, RVT’s top holdings are generally cheaper based on valuation multiples.
Exhibit 1: Long term performance of small cap versus large cap
Credit Suisse, S&P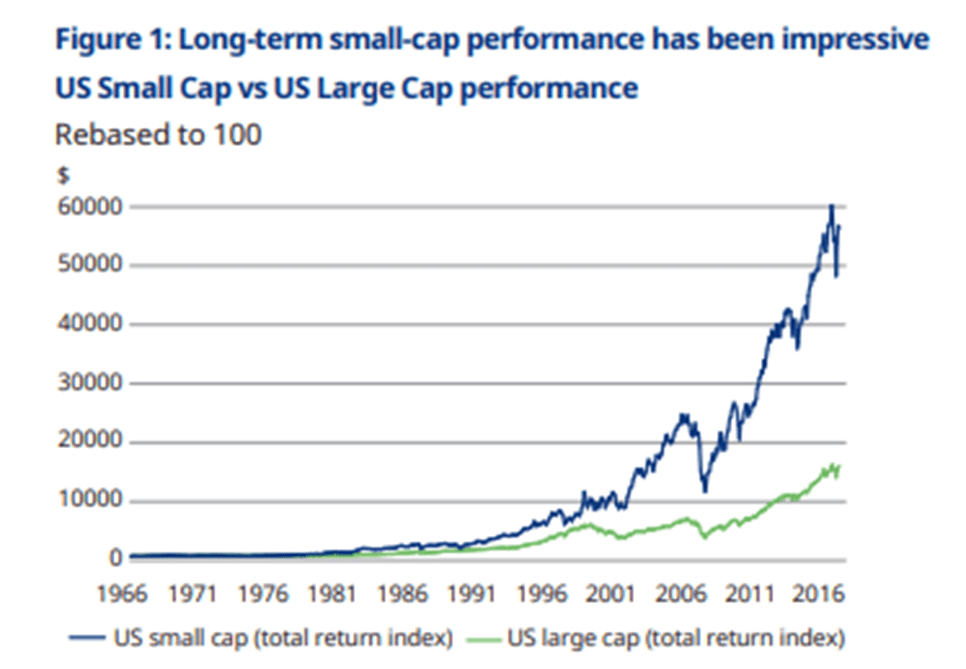
Valuations and dividend indicators are mainly in the “green zone”
The heat map below indicates the Seeking Alpha forward (FWD) price-earnings (P/E) and price-to-book (P/B) valuation grades, alongside Seeking Alpha’s dividend quality indicators, for the top ten holdings of Royce Value Trust. The cells shaded green are those within the grade A and grade B bands, yellow represents the grade C band, and red represents the grade D and F bands (blank cells are due to lack of data, or country listing outside the US). The good news is, 16 of the 34 (47%) shaded cells are in the green zone, 11 of the 34 cells (32%) are in the yellow zone, and 7 of the 34 cells (21%) are in the red zone. Therefore, the heat map suggests that valuations and dividend quality indicators lean towards being favorable for investors. Furthermore, the overall stock ratings of RVT’s holdings are mostly with a “buy” rating.
Exhibit 2: Heat map of top ten holdings of Royce Value Trust, relating to P/E, P/B and dividend quality indicators
Author, Seeking Alpha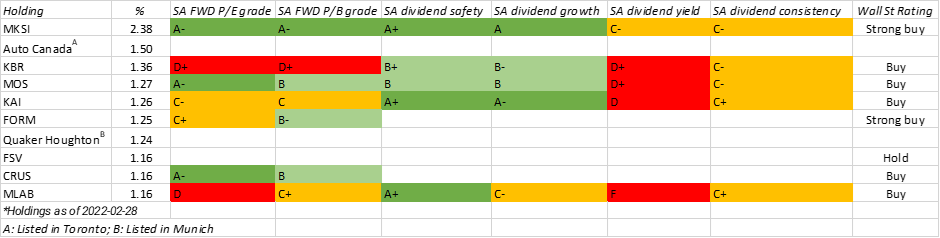
The top holdings of RVT are mainly brick-and-mortar, essential companies, which present value investing at its best. Its top holdings, MKSI, KAI, FORM and CRUS, are in semiconductor and industrial equipment and these are undoubtedly booming sectors given the importance of automation today and the recovery of the manufacturing industry. US Purchasing Managers’ Index (PMI) read 57.1 in March, and despite being a month-on-month slip, remained in expansion territory. KBR offers defense, intelligence, space, aviation solutions, segments that currently benefit from the war. MOS sells fertilizers that have obviously benefitted from the commodities price boom and the rise in food prices. FSV offers residential and commercial property management services which are stable revenue generators, further benefiting from the price boom in US property. MLAB is well positioned for the post-COVID germ-sensitive population, being involved in sterilization and disinfection products. As such, majority of RVT’s value holdings are in essential industries, rather than high growth sectors where future prospects can be uncertain.
Dividend growth valuation model suggests plenty of upside, limited downside
The table below (Exhibit 3) are valuation calculations for RVT based on the dividend growth model. Based on Seeking Alpha data, RVT has an annual dividend growth rate of 11% over each of the last five years. Exhibit 4 paints a picture whereby RVT has a long and consistent track record of paying its dividends that increase over time. Two scenarios are presented in the Exhibit 3 below, the first one being a “conservative” scenario where the dividend growth rate is less than half of the historical five-year average growth rate, at a mere 5%. The second scenario is the “optimistic” scenario where the dividend growth rate is closer to the historical average growth rate, albeit lower because the 4Q2021 dividend was taken out from the calculation due to it being an outlier (i.e. $0.78, which is more than double the usual amount). In the conservative scenario, the fair value is $15.06 which represents 13.5% downside risk, while the optimistic scenario has the fair value at $43.64, suggesting 60.8% upside. Of course, these are theoretical values that may not happen in the near term, but the main point of this representation is that the risk-reward ratio (i.e. upside versus downside risk) is favorably skewed to a long position.
Exhibit 3: Valuation of RVT based on two scenarios for the dividend growth model
| Conservative scenario: 5% dividend growth | Optimistic scenario: 10% dividend growth | ||
| S&P 500 long-term expected return (annual) | 10% | S&P 500 long-term expected return (annual) | 10% |
| Estimated risk free rate in 2022 | 2.5% | Estimated risk free rate in 2022 | 2.5% |
| Beta | 1.44 | Beta | 1.44 |
| Cost of equity | 13.30% | Cost of equity | 13.30% |
| Estimated dividend growth rate in 2023 | 5.0% | Estimated dividend growth rate in 2023 | 10.00% |
| Estimated dividend in 2023 | 1.25 | Estimated dividend in 2023 | 1.44 |
| Fair value – dividend growth model | 15.06 | Fair value – dividend growth model | 43.64 |
| Current price’s ($17.10) premium to fair value | -13.5% | Current price’s ($17.10) discount to fair value | 60.8% |
Source: Author’s model and calculations
Exhibit 4: RVT’s dividend distributions are consistent and stable with a growth trend
Seeking Alpha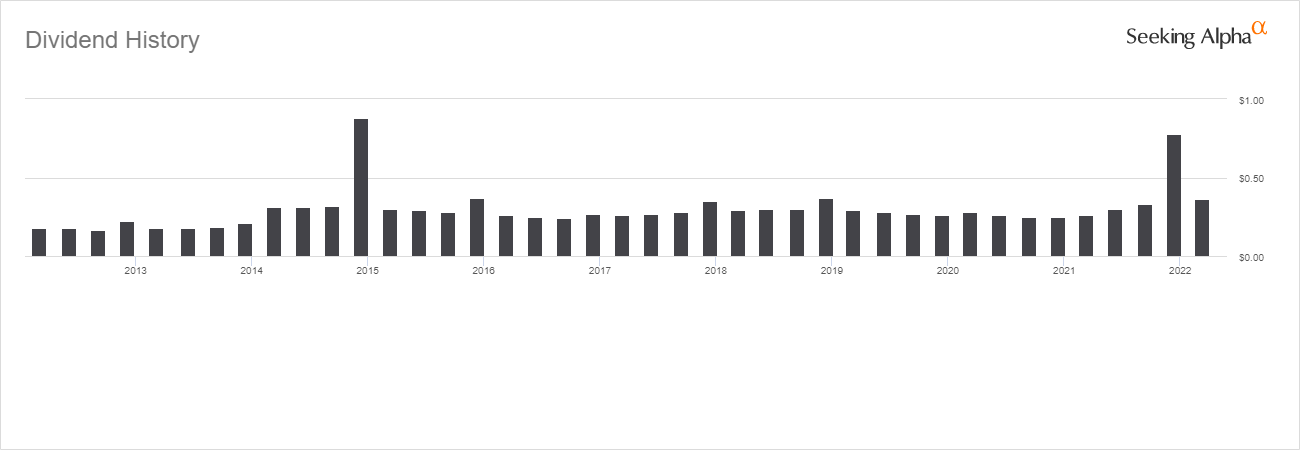
RVT’s technical chart appears promising
After touching the 100-Day Moving Average (DMA) on 7-March, RVT appears better positioned to rise, supported by RVT trading at the bottom half of its Bollinger band and its Relative Strength Index is at an oversold level. This decline to its 100-DMA was likely caused by the Russia-Ukraine war, coupled with more aggressive rhetoric on interest rates by Fed Chair Powell. Much of the macro headwinds have been priced in, but the consistent dividends by RVT will likely keep it above the 200-DMA. Assuming RVT falls to its 200-DMA to $15.30, its forward dividend yield will be a hefty 9.4%. During market downturns, we are likely to see better support for dividend payers such as RVT.
Exhibit 5: RVT may bounce after hitting the 100-day moving average
Yahoo Finance chart, technical drawings by author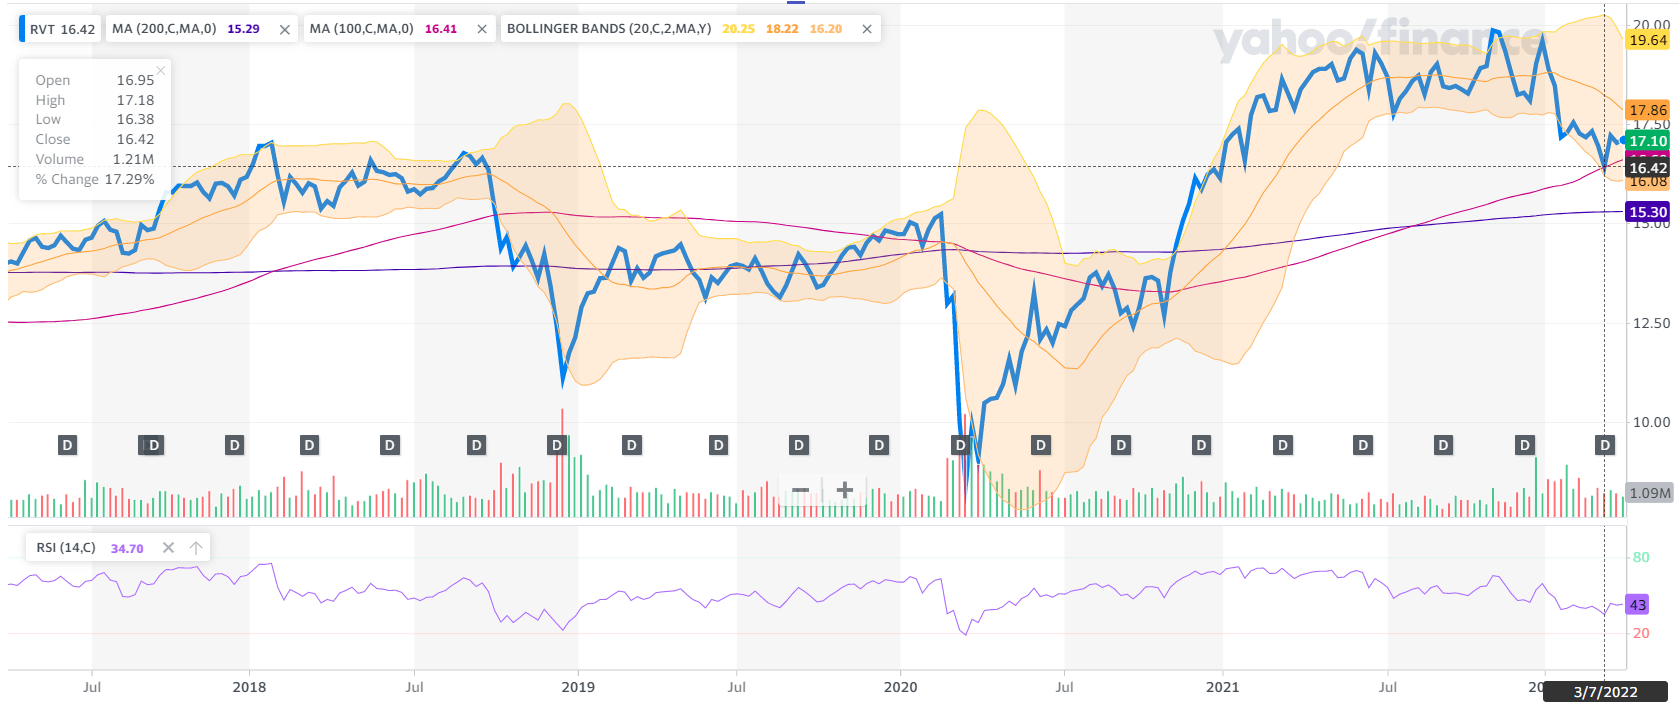
Conclusion
RVT is well-positioned as its dividend payments have a long term track record and have been consistent. The company’s top holdings have high Seeking Alpha grades on valuations and dividend quality. What’s comforting about RVT’s top holdings are its mainly brick-and-mortar companies, which means less worry over uncertain earnings growth rates. This factor will be important to maintain dividend consistency and the ability of RVT to pay out its dividend distributions, which is expected to yield above 8%.
Given the long term track record of RVT’s dividends, it is possible to value RVT with a dividend growth model; using this method, the valuation of RVT presents significant upside of 60.8% assuming the dividend growth remains at 10% each year and relatively less downside of 13.5% assuming dividend growth dwindles to 5%. This represents a very good risk-reward ratio, and regardless, the historical and expected dividend yield has been in the high single-digit in recent years. The technical chart on RVT is also attractive, as it bounced off the 100-Day Moving Average (DMA), suggesting support was found. Should RVT fall to its 200-DMA, its dividend yield is expected to exceed 9%.
Be the first to comment