

krblokhin
Introduction: Why is Raytheon Stock Down?
Raytheon Technologies Corporation (NYSE:RTX) shares have been weak since peaking in April, and fell another 4.6% on July 26 when Q2 2022 results were released, though they have rebounded by 1.7% since:
|
Librarian Capital’s RTX Rating History vs. Share Price (Last 1 Year)  Source: Seeking Alpha (22-Aug-22). |
We initiated our Buy rating on RTX in May 2020. Since then, shares have gained 49% (with dividends), including 33% since 2020 year-end, though they have fallen back 13% since their late-April peak.
Q2 2022 results showed that our investment case is on track. Commercial aerospace profits have continued their strong rebound from pandemic lows, and supply chain issues are under control there. In defense businesses, shortages have had a more negative impact because of government contract regulations. The full-year 2022 outlook was reiterated, though with help from corporate savings and tax. There may be more bad news in the short term, but ultimately the mission-critical nature of RTX products and high barriers to entry in its sectors should ensure strong earnings growth.
Our forecasts indicate a total return of 54% (14.5% annualized) by 2025 year-end, and the current Dividend Yield is 2.4%. Buy.
Raytheon Buy Case Recap
Our investment case on RTX is based on its Free Cash Flow (“FCF”) rebounding in the next few years, as passenger air travel recovers from the disruption by COVID-19, helped by structural growth in both its commercial and military businesses, as well as by the remaining synergies from the UTX-RTN merger in 2020.
We expect RTX to have $10bn of FCF in 2025, the low-end of management’s target. This compares with pro forma FCF of approximately $7bn in 2019 (excluding $1bn of upfront engine losses at Pratt & Whitney), as well as with a pre-COVID 2021 FCF target of $8bn:
|
RTX Free Cash Flow – Historic & Forecasted 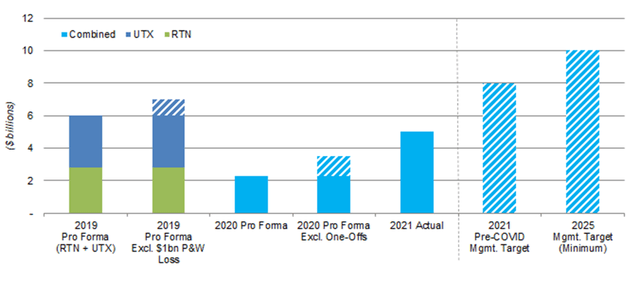 Source: RTX company filings, Librarian Capital estimates. |
RTX’s outlook for a $10bn+ FCF in 2025 is based on expectations of strong double-digit EBIT rebounds from 2020 in its aerospace segments, and mid-to-high single-digit EBIT CAGRs in its defense segments:
|
RTX Expected Sales & Adjusted EBIT CAGR (2020-25) 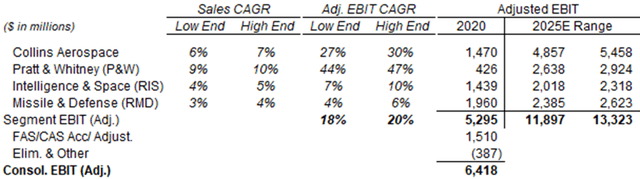 Source: RTX investor day presentation (May-21). |
RTX targets a return of $20bn+ of capital in dividends and buybacks to shareholders in the first four years of the UTX-RTN merger (compared with a pre-COVID target of returning $18-20bn in three years).
Q2 results showed that our RTX investment case continues to be on track.
Raytheon Q2 Group Results
For Q2 2022, on an adjusted basis, RTX Net Sales grew 2.7% (4% organic) and EBIT grew 1.3% year-on-year. Adjusted Net Income grew much more, by 8.9% year-on-year, primarily due to a much lower effective tax rate, and Adjusted EPS grew 13% year-on-year, thanks to the share count being 1.6% lower after buybacks:
|
RTX Adjusted P&L (Q2 2022 vs. Prior Year) 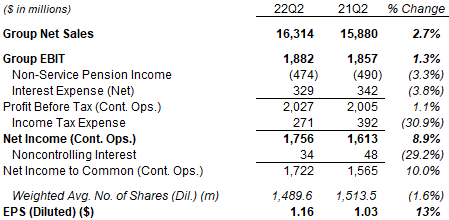 Source: RTX results releases. |
The reduction in RTX’s effective tax rate was primarily the result of R&D-related tax benefits from the 2017 U.S. tax cut becoming effective in 2022 and a prior-year one-off charge related to the increase in the U.K. corporation tax rate.
For H1 2022, on an adjusted basis, RTX Net Sales grew 2.9%, EBIT grew 9.4%, Net Income grew 16.2% and EPS grew 18.9%, following similar dynamics as described for Q2:
|
RTX Adjusted P&L (H1 2022 vs. Prior Year) 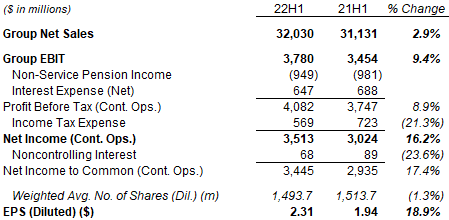 Source: RTX results releases. |
EBIT growth was higher for H1 than for Q2 because Q1 had an easier prior-year comparable. RTX’s EBIT fell precipitously in Q2 2020 after COVID-19 shut down most air travel, but progressively recovered in the subsequent quarters. Total segment EBIT reached approximately $1.5bn in Q2 2021, and has remained around that level as the recovery in commercial aerospace (for Pratt & Whitney and Collins Aerospace) was offset by an increasing weakness in its defense segments (Missile & Defence and Intelligence & Space):
|
RTX Segment Adjusted EBIT by Quarter (Since Q2 2019) 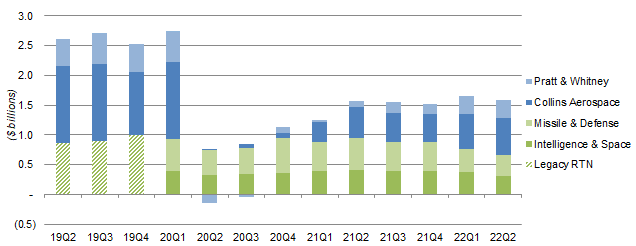 Source: RTX company filings. NB. Figures not adjusted for divestitures, FAS/CAS accounting and corporate expenses. |
EBIT weakness in defense segments was initially in part an accounting issue, when progress-based revenue recognition on contracts had to be reset following the UTX-RTN merger. More recently, the segments have been increasingly affected by supply chain issues created by COVID disruption and the Russia/Ukraine conflict.
We review the performance of each of RTX’s segments in more detail below.
Raytheon Q2 Results by Segment
Q2 Net sales and Adjusted EBIT figures for RTX’s segments are as follows:
|
RTX Sales & EBIT by Segment (Q2 2022 vs. Prior Year) 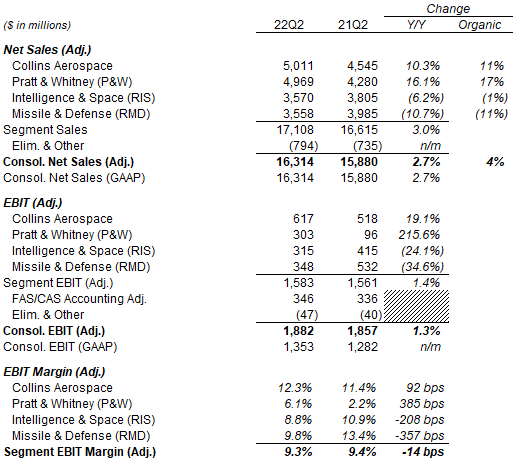 Source: RTX results releases. |
The common themes across RTX segments are that commercial aerospace businesses are recovering strongly, but military businesses are suffering lower sales and lower efficiencies due to supply chain issues.
Collins Aerospace Net Sales grew 10.3% (11% organic) year-on-year, with Commercial Aftermarket sales up 25%, Commercial Original Equipment (“OE”) sales up 14% but Military sales down 6%. Adjusted EBIT grew 19.1% as margin expanded with drop-through on higher commercial aftermarket sales offsetting negative items.
Pratt & Whitney Net Sales grew 16.1% (17% organic) year-on-year, with Commercial Aftermarket sales up 26%, Commercial OE sales up 22% but Military sales up “only” 5%. Adjusted EBIT rebounded by 216%.
Intelligence & Space (“RIS”) Net Sales fell 6.2%, largely due to the disposal of RTX’s global training & service business, and was down 1% organically due to lower sales across a number of areas. Adjusted EBIT fell 24.1%, partly because of the disposal and a prior-year land sale gain, but also because of lower net program efficiencies.
Missile & Defense (“RMD”) Net Sales fell 10.7% (11% organic), driven by “continuing delays in material availability” as well as expected sales declines in certain programs. Adjusted EBIT fell 34.6% because of “lower net program efficiencies resulting from continued supply chain constraints”, unfavorable program mix, and lower volume.
Air Travel Recovery Still Incomplete
The strong recovery in RTX’s commercial aerospace businesses in Q2 2022 nonetheless represented a still incomplete recovery in global travel. Management provided several examples:
- Global revenue passenger miles were at nearly 70% of pre-COVID levels in Q2
- U.S. traveller numbers (through TSA checkpoints) were at nearly 90% of 2019 levels in Q2
- International revenue passenger miles were at over 60% of 2019 levels at the end of Q2
There is potential for their profits to grow further in coming quarters as travel continues to recover. For example, RTX expects international revenue passenger miles to recover to 75-80% of 2019 levels by the end of 2022.
Impact of Supply Chain Shortages
Supply chain issues have had a material negative impact on RTX’s defense businesses, but not its commercial aerospace businesses. The reason for this is that regulations on government contracts have restricted RTX’s ability to take mitigative measures against expected disruption and shortages. As CEO Greg Haynes explained on the call:
The commercial businesses have done a better job, I would say, because of the way we structure those long-term agreements. If you look at the defense side of the business, only about 10% of those businesses of RMD and RIS, suppliers are on long-term agreements. And that’s not surprising because of government contracting rules …
The MMS, Material Management System, which dictates how much inventory we can drive and how soon we can place things on order, really constrains our ability to be flexible on the defense side. I would tell you the reason that we have been able to be successful on the commercial side is we have driven a lot of inventory in … We are not constrained on the commercial side by the MMS system.”
Shortage of materials not only reduced deliveries and thus revenues, but also reduced productivity and thus profit margins. As an example, management stated that kit availability on the shopfloor across RTX factories fell to around 50% in Q2, compared to a target of 90-95%.
Delayed deliveries mean that revenues are deferred, not lost, so the main negative for long-term shareholder value is the lower margins on products that are delivered but at subpar efficiency.
In addition to shortages in materials, RTX is also suffering from shortages in labor. Management stated that they have only been able to rehire about 25% of the people laid off during the pandemic, compared to 75-80% in past layoffs.
As before, management expects at least some supply chain issues to persist into 2023, but we are confident they will be resolved eventually. Since we view the intrinsic value of a business as the net present value of all future earnings, temporarily lower sales and margins do not affect our investment case.
Impact of Inflation
Inflation has been less of an issue for RTX than shortages, thanks to the way its contracts are structured.
In the short to medium term, RTX is protected against cost inflation by its long-term supplier agreements and by cost-based contracts. As CEO Greg Haynes explained on the call:
On the commercial side, again, the LTA (Long Term Agreement) coverage at 80% really provides you a lot of coverage with inflation. Now there is dead bands in there and excess inflation above some levels. Usually 6% or 7% gets shared with the supplier. But for the most part, we’ve been able to manage through that. On the defense side … at least 30% of the work that we have is cost type at RMD.”
Haynes quantified the impact of additional inflation headwind since the start of 2022 as about $200m (compared to 2021 group Adjusted EBIT of $7.26bn), which is manageable and something that RTX will aim to offset through efficiencies.
Over the longer term, RTX should be able to pass on inflationary cost increases to its customers, given the mission-critical nature of its products and high barriers to entry in the aerospace and defense industries. For this reason, we also do not believe inflation is a material issue for our investment case.
RTX Full-Year Outlook
RTX reiterated its full-year outlook, which includes organic sales growth of 6-8%, an Adjusted EPS of $4.60-$4.80 and a Free Cash Flow (“FCF”) of approximately $6.0bn:
|
RTX 2022 Outlook (Group) 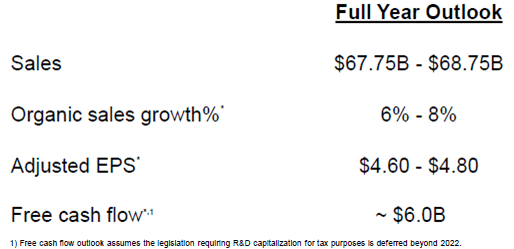 Source: RTX results presentation (Q2 2022). |
Expected CapEx spending for 2022 has been reduced slightly, from $2.5bn to $2.4-$2.5bn.
The $6.0bn FCF outlook represents a year-on-year growth of nearly 20%, and supports the 2025 target of $10.0bn+.
Included in the reiterated full-year outlook, however, are upward revisions for Adjusted EBIT in the aerospace segments and downward revisions for Adjusted EBIT in the defense segments:
|
RTX 2022 Outlook (By Segment) (Revised) 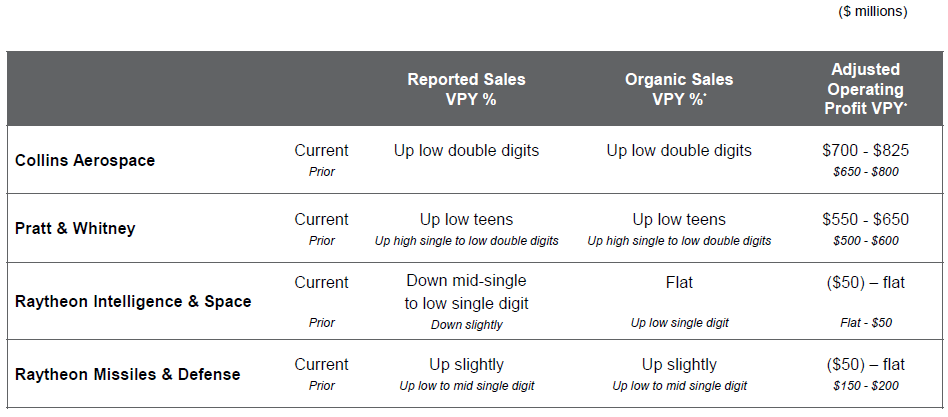 Source: RTX results presentation (Q2 2022). |
The expected total growth in segmental Adjusted EBIT is now $1,150-$1,475m, compared to $1,300-$1,650m before. However, the decrease is expected to be offset by lower corporate and unallocated expenses (now $325m, was $375-$400m) and a lower expected tax rate (now 18.0-18.5%, was 18.5-19.0%), so that expected Net Income is unchanged.
As before, RTX assumes that legislation requiring a longer R&D capitalization period will be deferred beyond 2022. If not, FCF this year will be lower by approximately $2.0bn in 2022, to be recovered in subsequent years. (Lengthening the R&D capitalization period would, for the same amount of R&D spend, provide the same amount of tax offset but over a longer period.)
Raytheon Valuation
At $91.78, on 2021 financials, RTX shares are at a 21.2x P/E and a 3.7% FCF Yield; on the mid-point of the 2022 outlook, RTX shares are at a 19.5x P/E and 4.4% FCF Yield:
|
RTX Earnings, Cash flows & Valuation (2020-22E) 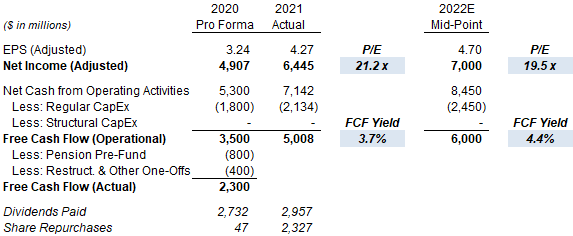 Source: RTX company filings. |
RTX’s quarterly dividend is $0.55 ($2.20 annualized), having been raised 8% in April, and represents a dividend yield of 2.4%.
RTX repurchased $1.06bn of shares in Q2 at an average price of approximately $95, bringing the H1 total to $1.78bn. Management expects to repurchase “at least $2.5bn” in 2022, equivalent to 1.8% of the current market capitalization.
Management reaffirmed the goal to return $20bn to shareholders in both dividends and buybacks in the first four years of the UTX-RTN merger.
Raytheon Stock Forecasts
We keep the assumptions in our forecasts unchanged:
- 2022 FCF of $6.0bn
- 2023-25 FCF to be $8.0bn, $9.0bn and $10.0bn respectively
- Share count to fall by 1.5% each year
- From 2023, dividend to be based on a 65% Payout Ratio (on FCF)
- FCF Yield at 5.5% at 2025
Our 2025 FCF/Share forecast is unchanged at $7.05:
|
Illustrative RTX Return Forecasts 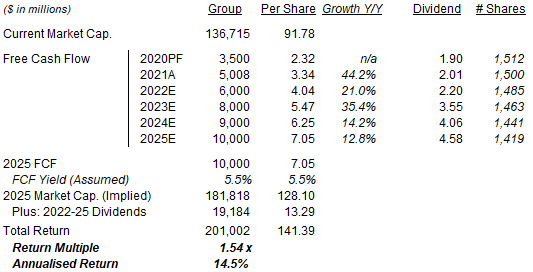 Source: Librarian Capital estimates. |
With shares at $91.78, we expect an exit price of $128 and a total return of 54% (14.5% annualized) by 2025 year-end.
Conclusion: Is Raytheon Stock a Buy?
We reiterate our Buy rating on Raytheon.
Be the first to comment