

Dividends
“The world has fundamentally changed” was the opening line of CEO Ben van Beurden this morning before he went on to “rebase” (read: cut) the Royal Dutch Shell (RDS.A) dividend from $0.47 to $0.16 cents per share, a 66% reduction. This led to stock price declines of circa 7% on the announcement and falling further since, for those interested my own purchase price is £11.99 per share of (RDS.B) for my personal portfolio on the 1st of May.
Just a quick note on both share classes, as a UK based investor I bought the B shares as they are listed in London. This allowed me to avoid the 15% tax on dividends I would have paid if I had purchased the A shares, which are based in the Netherlands.
Getting back to the dividends, as an investor I care not about how much capital is retained vs. paid out back to shareholders but about the value created with each dollar. Broadly speaking, capital is only paid out to investors when the management feel we (the investors) are better equipped to put that money to work than they are. In the case of RDS, they need the dollars to thrive (or perhaps that should read survive) more than we do right now.
Source: (Royal Dutch Shell, 2020)
Overall, my feeling is this is a relatively conservative approach and done so in anticipation of worsening conditions through the next quarter, as oil prices remain heavily depressed. In my opinion it is also a sign of a clued up and competent management, that understand while making a (small) quarterly loss, dividends would be paid out via debt. This would hardly be a sensible move given the current macro-economic climate we are in, especially with regards to oil pricing at the time of writing.
Truth be told, dividend investors should be thankful for any dividend at all given current circumstances. Bolstering cash on hand and strengthening the balance sheet (which in fairness, remains relatively strong) should absolutely be the priority moving into the next quarter, which will be akin to a bloodbath compared to today’s results.
For a little further context, at the time of writing 41 companies in the FTSE 100 (so 41%) have either materially reduced or altogether cancelled dividends, as they seek to strengthen balance sheets in anticipation of risks and further uncertainty felt globally due to COVID-19.
Now that the headline of the day has been discussed, let’s move on to mid to long-term opportunities.
Opportunities Ahead
Oil Is Fundamentally Cyclical
As the graph below illustrates, the price of oil experiences significant volatility decade to decade for a wide-ranging number of reasons outside the scope of this report. The two reasons I do want to talk about today are the disruption on the demand side caused by COVID-19, and the increase on the supply side led primarily by geo-politics between Saudi Arabia and Russia.
However, a few caveats on the graph below. This is a circa 70-year graph on West Texas Intermediate prices, which remains discounted compared to its primary counterpart, that is Brent Crude, which is primarily sourced from the North Sea. Brent oil is currently trading at $25.30 a barrel compared to WTI at $17.48, a fairly substantial divergence. Furthermore, it is worth noting the above graph accounts for inflation and is based on CPI, helping paint a more accurate long-term picture.
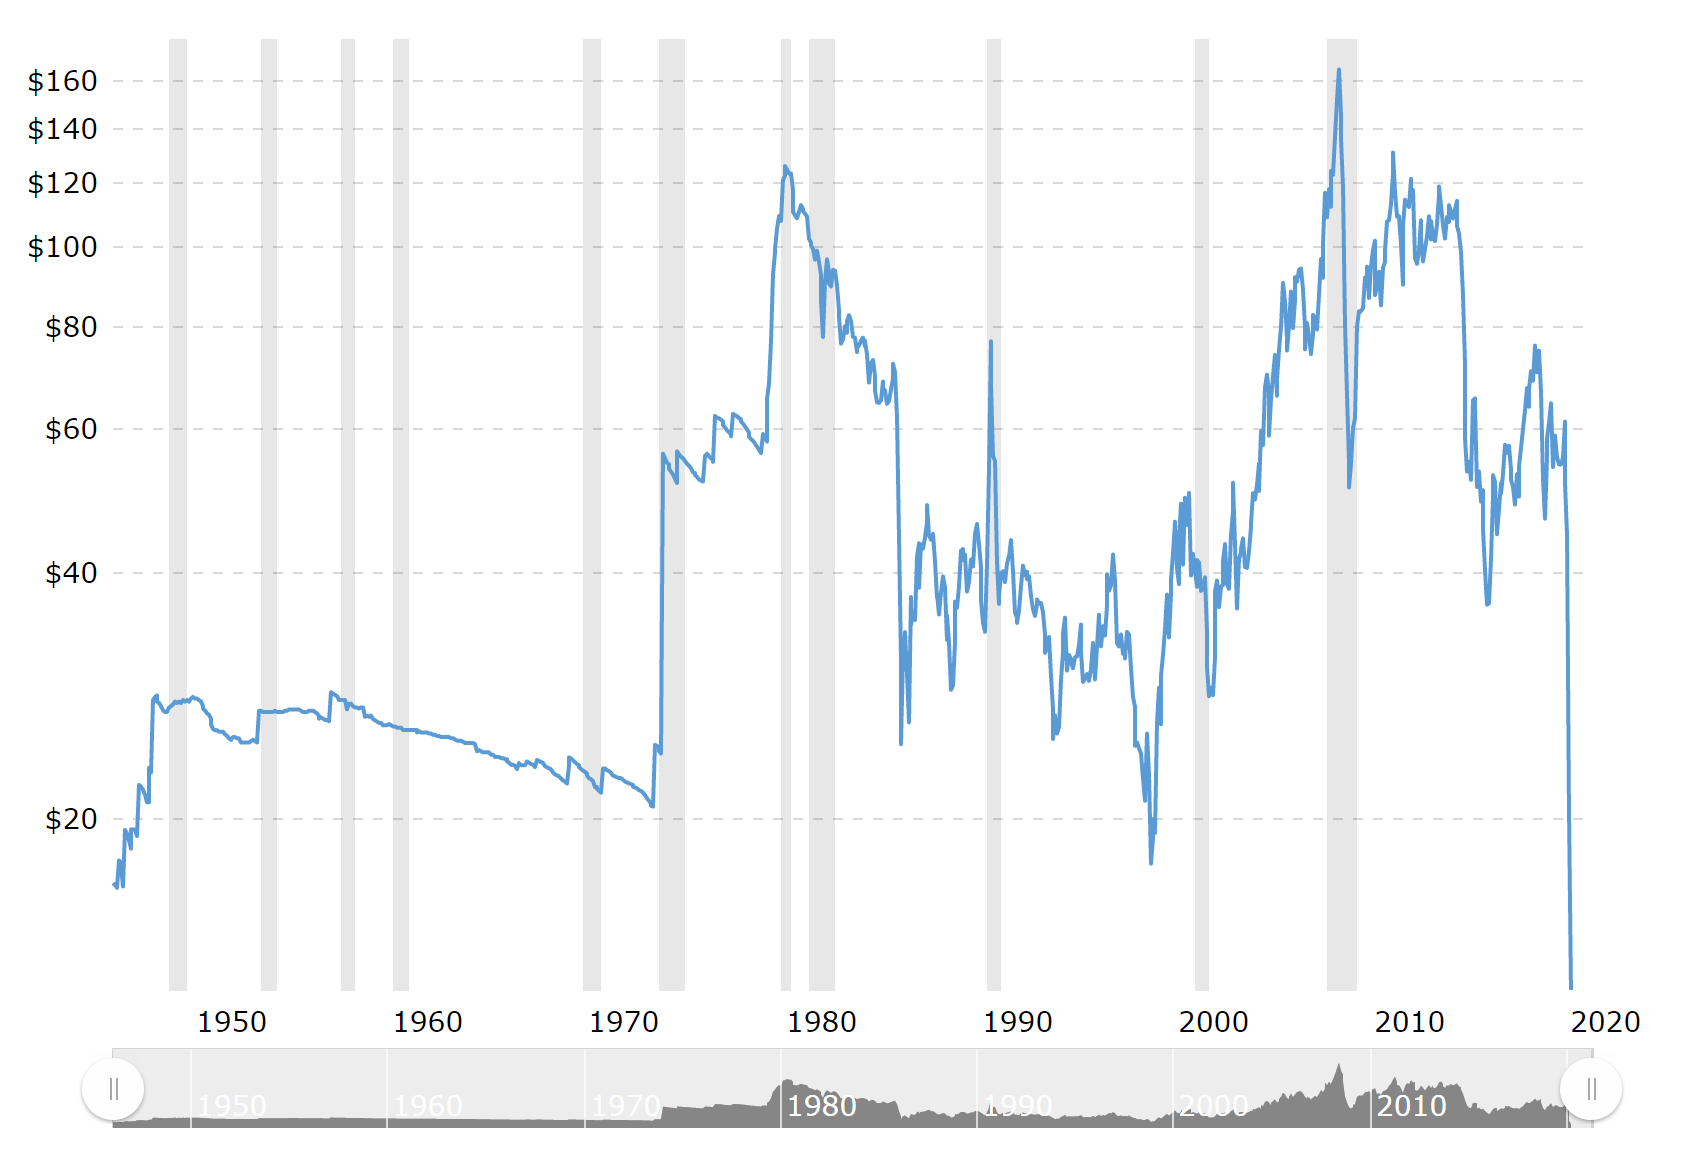
Source: (MacroTrends, 2020)
With oil prices at historic lows, the only way is up from here when looking further out into 2020 and beyond. As the table below illustrates, futures prices for WTI expect oil to rise to circa $30 a barrel by December, which will bring most European oil majors relatively close to (or indeed at) a profitable price point.
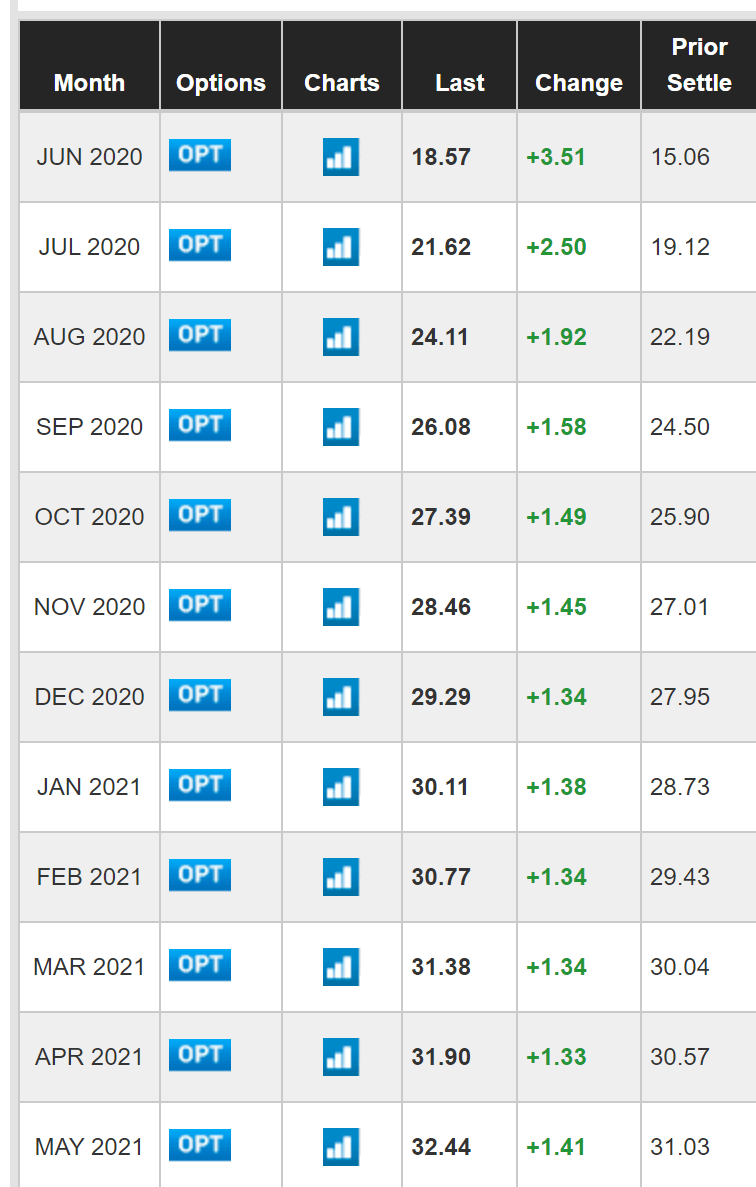
Source: (CME Group, 2020)
BP (BP) recently announced it would be profitable and able to cover dividends at circa $35 per barrel and it is reasonable to assume other oil majors are taking similar steps during these uncertain times. This is done through extensive cost cutting measures and a re-thinking of capex moving forward, including the avoidance of sites (perhaps offshore) where production costs are higher (Reuters, 2020).
However, long-term prices will undoubtedly rise well above $35 and hit $60 globally at some point within the next ten years. As long as profitability can be maintained around $30, there is scope for substantial margins with mid to long-term horizons in mind.
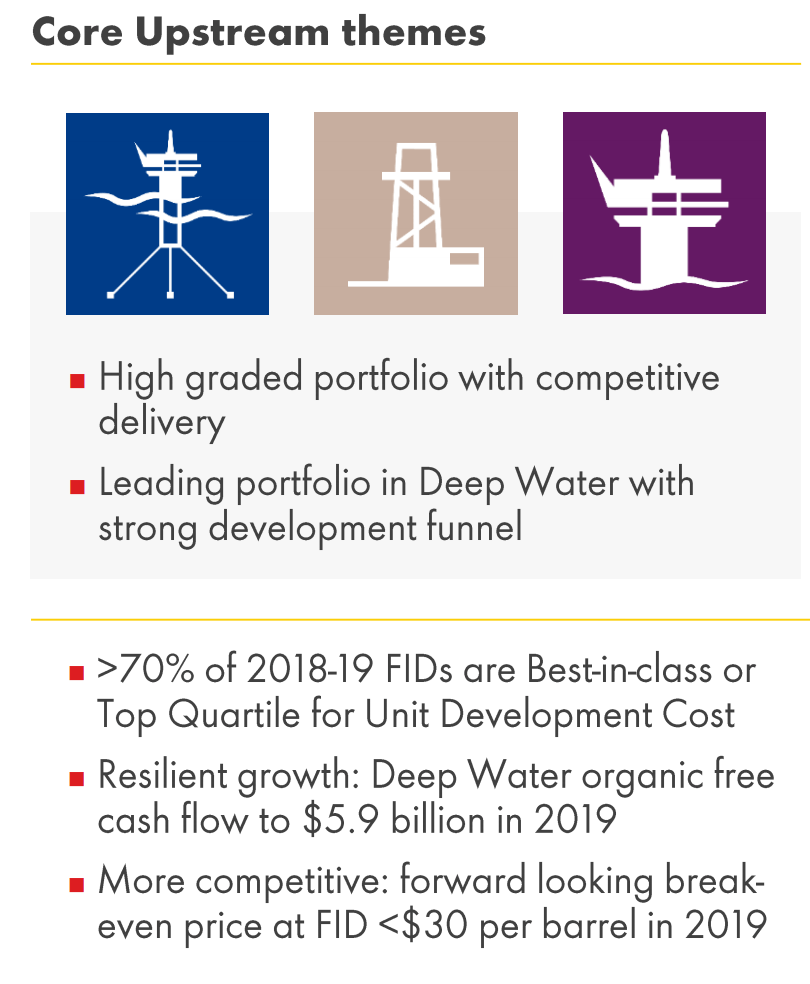
Source: (Royal Dutch Shell Investor Presentation, 2020)
As the slide above points out, investment decisions through 2019 took a Final Investment Decision (FID) on the viability of new sites at below $30 a barrel. This provides some optimism that even during heavily depressed times of oil pricing, Shell can both survive and remain profitable should this happen again, at least across a substantial part of its portfolio.
It is also worth pointing out the extreme volatility in short-term prices in recent months. As the table below illustrates, both WTI and Brent futures are seeing almost daily double-digit changes in price movements. This is primarily caused by uncertainty in terms of storage space, which is now reaching capacity and relatively muted progress by OPEC and OPEC+ in terms of production cuts.
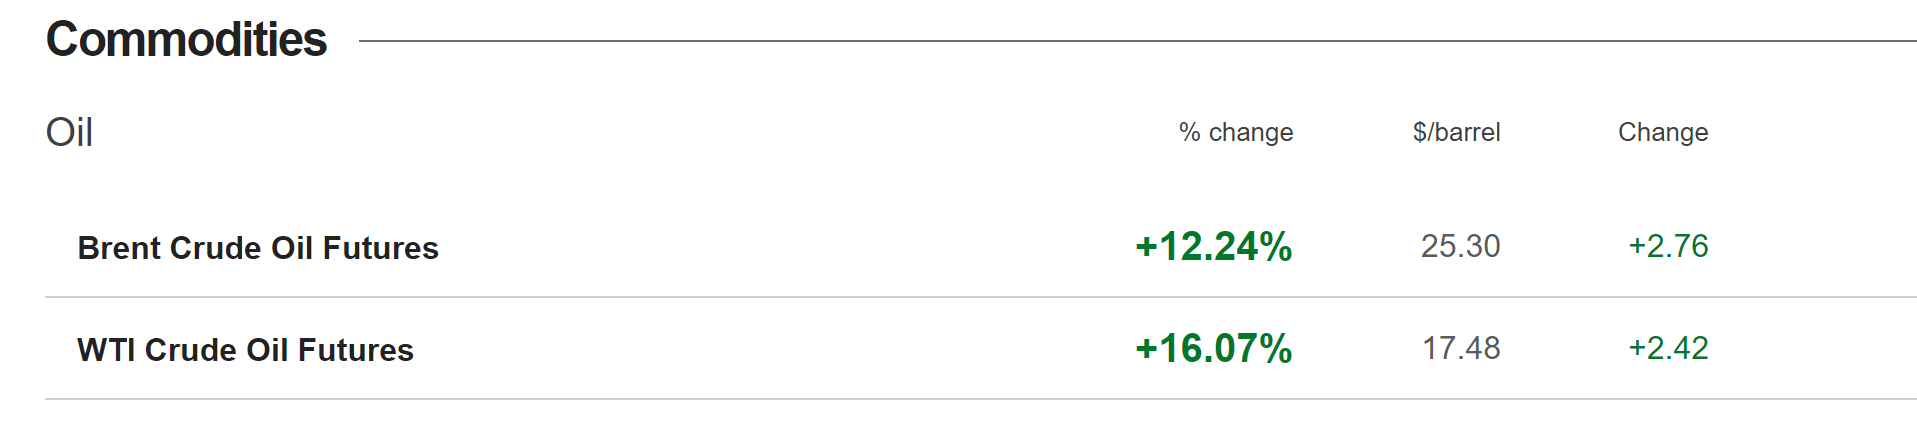
Source: (BBC Market Data, 2020)
That said, US shale oil and gas is likely to be adversely affected moving through 2020 due to its substantially higher costs of production. Therefore, this should provide some supply side relief as market forces (specifically pricing) become felt, and this will be especially prevalent amongst smaller shale producers who will find it tough to weather out this particular storm. In my opinion, bankruptcies among such producers will rise exponentially through the second half of 2020.
Finally, there is some good news in terms of replacement activities, with the Harvard Business Review noting that by 2027 circa 40% of current oil and gas production capacity will need to be replaced. This in theory will allow the global industry to simply lower capex modestly (which many oil majors are currently doing), and allow prices to creep higher (geo-political caveats aside) over the next few years.
RDS Remains Under Competent Leadership
Ben van Beurden took over as CEO of RDS in 2014 and has been with RDS for 30+ years. His experience ranges from all segments of the business, both upstream and downstream giving him a deep and perhaps unique understanding of core processes and forces across the firm. Since 2014 he has transformed safety within the group in terms of accidents and spillage and continues to push forward an agenda into both renewables and utilities via green technologies and First Utility respectively. Corporate social responsibility remains a key pillar of his leadership approach moving forward, and this process is likely a net positive with mid to long-term horizons in mind.
Perhaps the biggest testament to Beurden’s success can be measured in total returns, which have beaten other oil majors across the world by 39% in the last 10 years, as reported by the FT this January (Financial Times, 2020). On the negative side, share buybacks in hindsight look to be very badly timed. This commended with the announcement of a $25 billion share buyback program on July 26, 2018 but is now discontinued as of the 23rd of March due to macro conditions and uncertainly caused by COVID-19. However, this program is set to continue post crisis, but management indicate this is unlikely to happen by the end of 2020 (Royal Dutch Shell, 2020).
Overall, I am willing to accept the timing of buybacks as being more to do with bad luck than an attempt by management to inflate EPS, hit targets for options bonuses or other somewhat nefarious agendas managements sometimes pursue.
Green Tech Is The Future (For The Most Part)
The world fundamentally requires energy companies to move away from activities that generate high levels of co2 by the latter half of this century. This remains especially true of the oil and gas sector, where the production and use of oil and gas accounts for over half of global greenhouse gas emissions associated with energy consumption. Overall, energy consumption itself generates circa 65% of emissions globally (CDP, 2020).
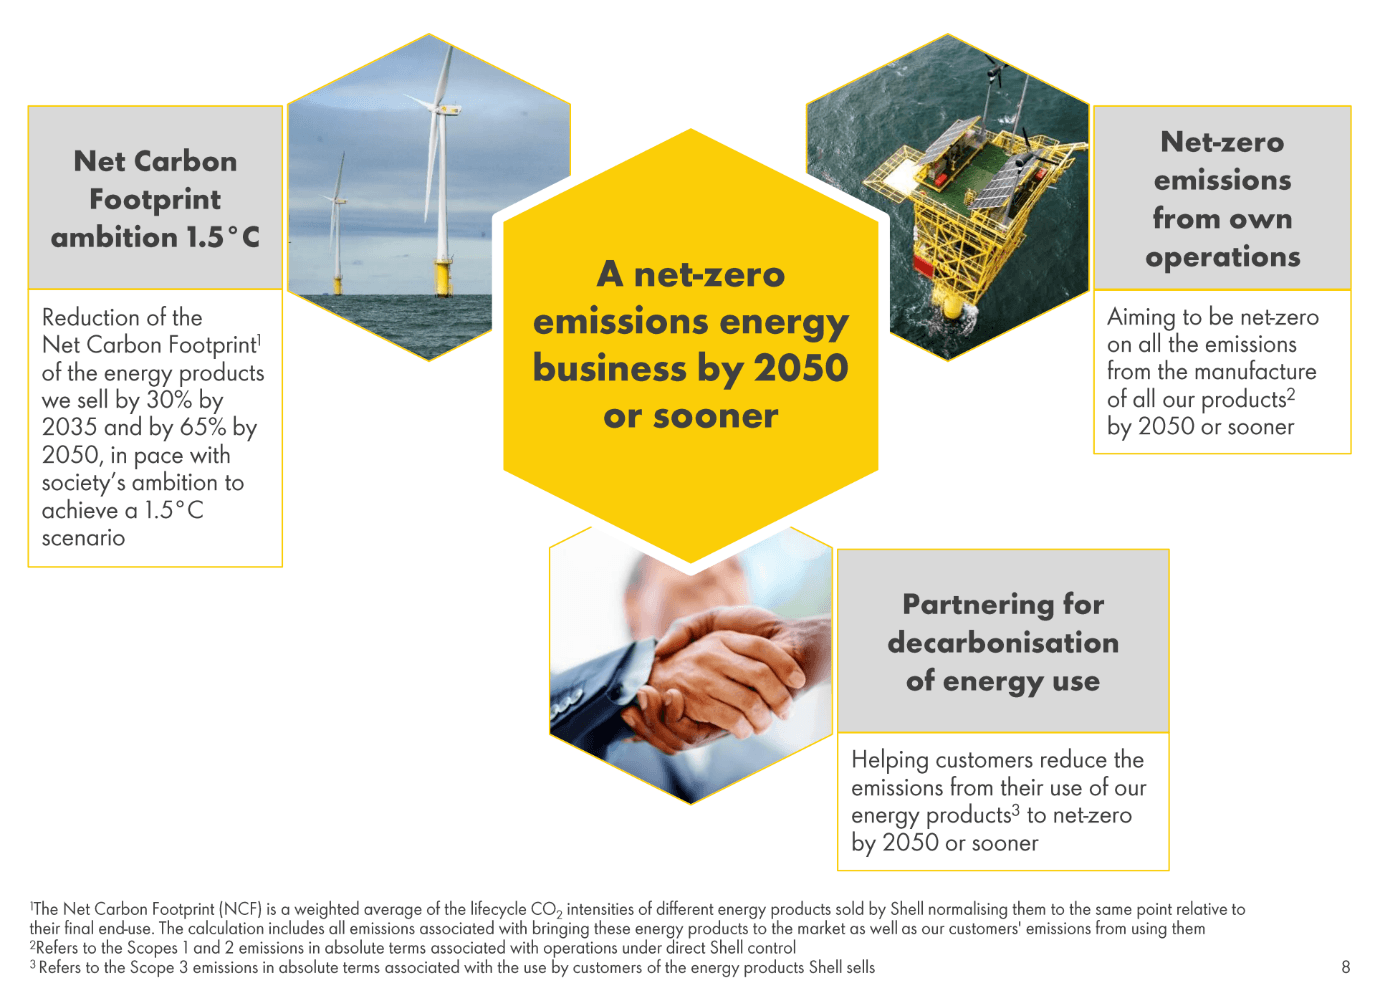
Source: (Royal Dutch Shell Investor Presentation, 2020)
Shell has two primarily levers to leverage to meet its 2050 target of net zero emissions and they are as follows: Bio Fuels & Biomass
The chart below indicates a possible scenario for net zero emissions by 2050 and beyond and shows biofuels and biomass playing a substantial role alongside other renewables. In this light, by developing experience and expertise now and slowly building biofuel and biomass capacity, Shell will be sufficiently prepared for this transitional phase of the energy mix moving forward.
Starting to scale up now will provide a few advantages, firstly is cost as additional ubiquity tends to provide more effective cost reduction solutions as understanding and expertise is further leveraged. Economies of scale may also play into this as generally the more of something that gets built, the more cost effective it becomes. This is known as the learning curve.
For the Paris climate agreement to be met, governments around the world may offer tax breaks or other subsidies to help promote this shift by major oil players away from traditional oil and gas. Pioneering this technology today will help Shell be first in line for such incentives when governments decide to act. Overall, while this is a relatively small part of Shell’s portfolio today, the research and development of these technologies now will stand it in good stead well into the future. In my opinion it is worthwhile expenditure, and costs little relative to Shell’s size and scope.
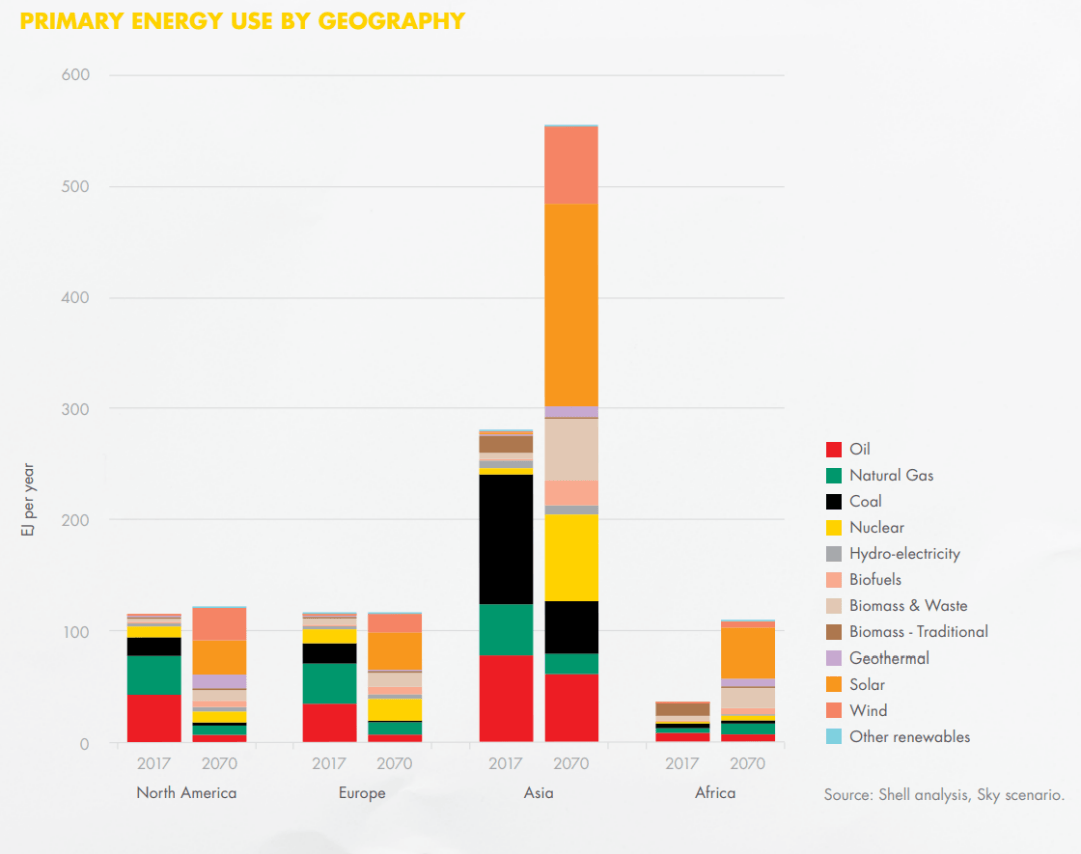
Source: (Royal Dutch Shell Sustainability Report, 2020)
Hydrogen
As the infographic below illustrates, Shell is expanding its footprint of hydrogen-based fueling stations across North America and Europe as it trials these technologies in conjunction with Daimler (OTCPK:DDAIF) and Toyota (NYSE:TM).
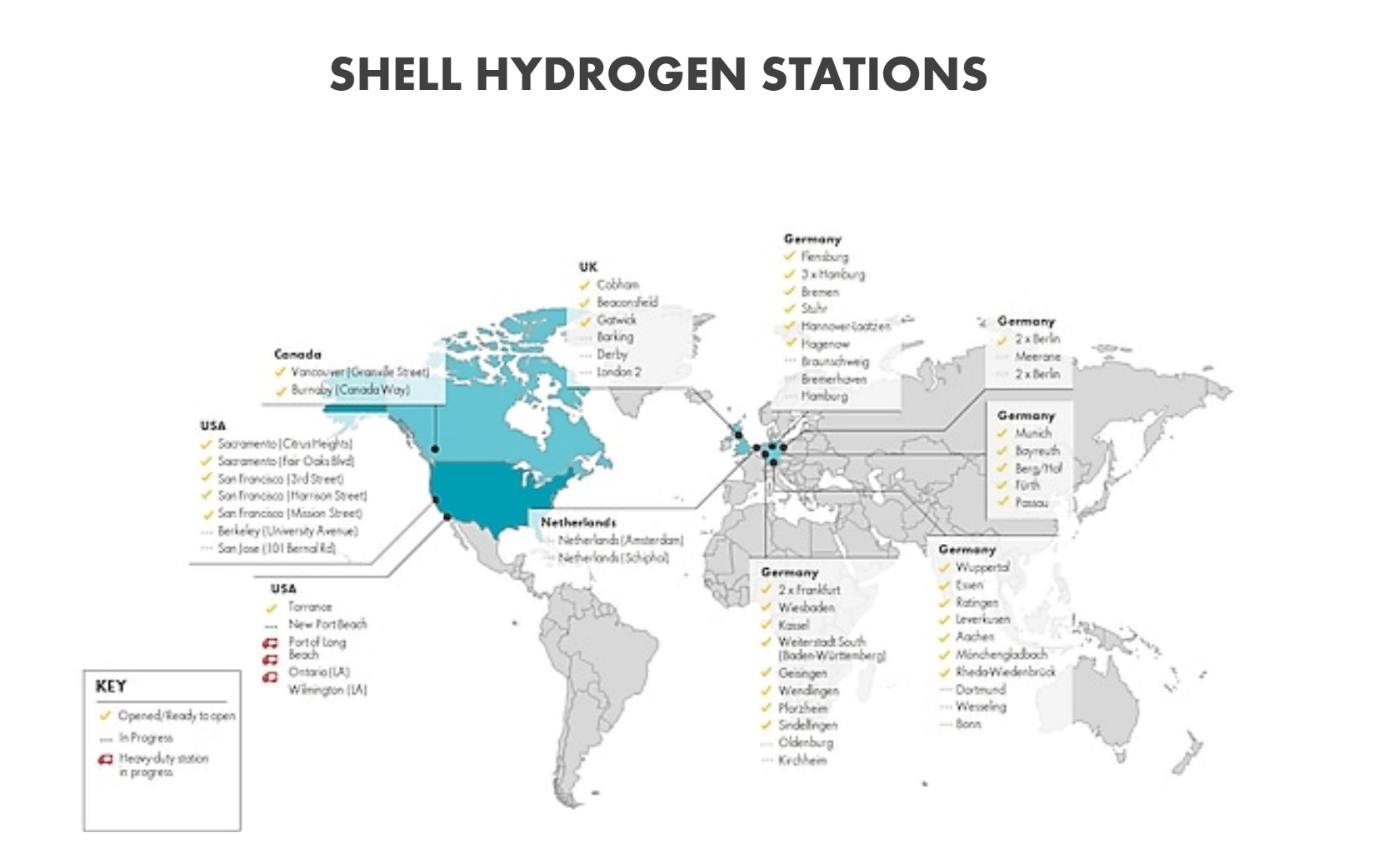
Source: (Royal Dutch Shell, 2020)
As transportation accounts for the bulk of emissions, with cars alone generating 9% of global emissions accord to Green Peace, hydrogen may provide a vital alternative to diesel and gasoline. This is perhaps especially prominent in long distance travel and trucking, where battery technology is as of yet still getting to grips with 200-300+ mile journeys, and where solutions do exist, recharging times remain stubbornly high compared to fossil fuel or hydrogen-based alternatives.
While on paper hydrogen is theoretically cheaper than fossil fuels, in practice the cost per mile is generally higher. In the UK this breaks down to circa £11.40 per 100km versus £6.72 per 100km for a diesel based vehicle (Sussex Express, 2020).
Solar & Renewables
Renewables, especially solar power, is projected to rise substantially over the next few decades primarily because of this:
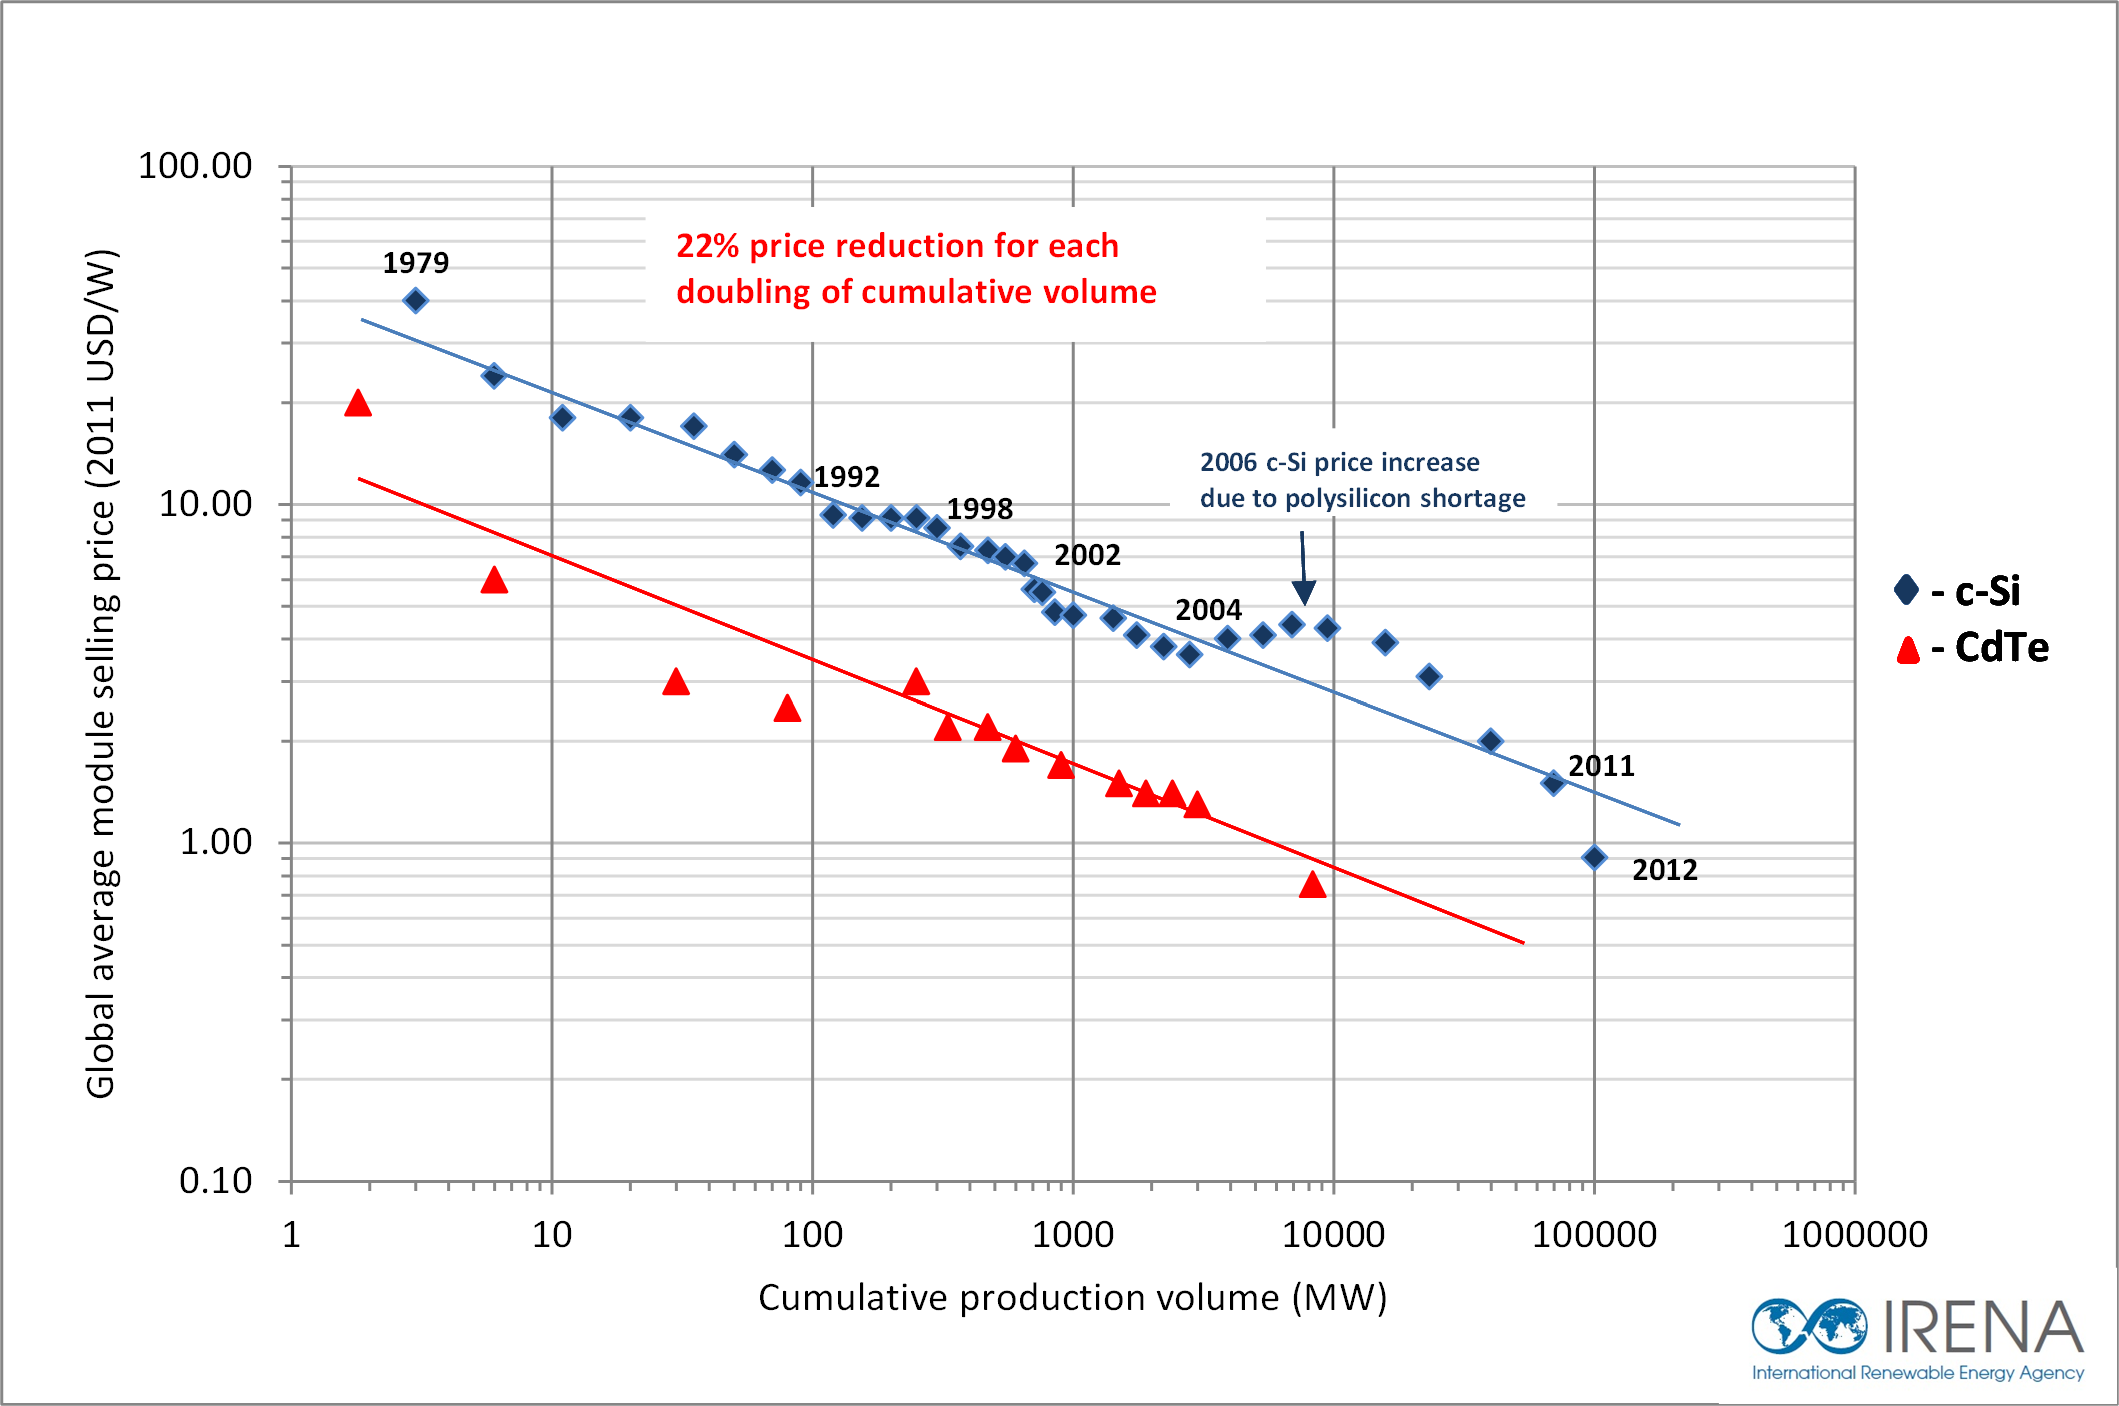
Firstly, the undeniable trend that it is getting cheaper over time, and secondly that efficient costs of production per KW is driving further popularity. It is in essence becoming a self-reinforcing process. Historically, we can look as far back as 1958 where the Vanguard 1 satellite used six solar panels at a cost of $5,00-$10,000 for circa half a watt of generation.
Moving forward to the mid-1970s and this was reduced to circa $100 per watt. This fell further still and by 2016 the cost was circa $0.50 per watt of electricity generated, and this trend shows no sign of slowing down (IRENA, 2020).
Admittedly, the price per watt today varies depending on the part of the world you live in, and it will be increasingly economically attractive to do it in some parts of the globe compared to others. One particularly prominent example of this was during 2016 in Nevada, where several major casinos transitioned to renewable energy sources instead of using state utilities. This was not done on the basis of corporate social responsibility or as a marketing exercise, but as a way to reduce costs. This held up as economical despite a circa $150m severance fee paid to the utility suppliers (BBC, 2019).
Getting back to Shell, they are somewhat lagging behind counterpart BP in terms of developing a solar based portfolio. Yet based on Shell’s own predictions, it is highly likely they will invest substantial capex spend into solar based projects moving forward. It remains a key growth area for the group as traditional oil and gas segments flatline in favor of new, cleaner technologies to meet long-term worldwide energy demand.
Utilities
Source: (Shell Energy, 2020)
It is worth briefly touching on Shell’s continued operations in the utilities business, which has recently been relabeled and rebranded as Shell Energy. This utility arm of the group operates primarily in the UK and at present offers 100% renewables-based energy supply to its customers. As the largest challenger utility firm in the British market, it remains an interesting segment to watch, and should the model prove profitable it is likely to expand further across the European continent. Unfortunately, no financial metrics are provided for the segment and it is unlikely investors will get such information anytime soon.
However, it is an indication of the firm’s interest in the utilities market, and specifically in utilizing 100% renewable energy for household retail customers.
Headwinds
Two Black-Swan Events
RDS faces two once in a decade crisis or Black Swan events simultaneously. This comes in the form of geo-political maneuvering by major oil producing countries Saudi Arabia and Russia. Compounding this problem further is the sharp and unexpected collapse on the demand side caused by COVID-19. This section of the report will explore these two major headwinds facing oil majors across the world today.
Geo-Political Pressure: The Race to Pump Black Gold
Just two months ago in March 2020, Saudi Arabia embarked on its path of increasing oil production with no mind or heed to current worldwide demand, and this has thus far had terrible consequences. On the 3rd of January WTI futures traded at $63.05 per barrel, a relatively stable and normalized price over the last few decades, two months later on the 3rd of March it fell to $47.18, still within acceptable boundaries for oil majors to remain profitable and stable.
One month on at the 1st of April prices sunk to $20.31 per barrel before rebounding by the 3rd to $28.34 with many speculators deeming the bottom had been found. It had not, falling as low as $11.57 on some 17 days later and trading at a once in a lifetime price of -$37.63 as the expiration of April futures approached. This was because holders of futures dumped their contracts to avoid having to take physical delivery of the underlying asset, this black gold.
Commentary of the last few months aside, economic reality is now hitting Saudi Arabia full force. The nation’s deficit has soared, with Reuters reporting late last month that: “The kingdom slipped into a $9 billion budget deficit in the first quarter as oil revenues collapsed” (Reuters, 2020). I’m focusing on Saudi Arabia here because they are A) the second largest producer in the world, and B) the lack of diversification within their economy means they are exposed and vulnerable to price shocks such as this.
However, it is this same vulnerability that will sooner or later force their hand in cutting supply dramatically as a means to survival, and to avoid the hardships of severe austerity and economic collapse. For this reason alone, I believe oil prices will eventually rise and find a stable equilibrium in a post-COVID-19 world. What I do not know is when this will happen, it may be months, it will probably be years.
Source: (Royal Dutch Shell, 2020)
Demand Side Collapse: COVID-19 Hits Hard
The second piece of this jigsaw was the sudden collapse on the demand side as supply pushed ever higher, creating the perfect storm. This goes against the basic fundamentals of supply/demand economics, and the consequences we have seen over the last few months will undoubtedly prove to be an excellent case study in years to come.
This collapse in demand has primarily been caused by the lockdown measures undertaken by governments worldwide in response to the COVID-19 pandemic, and specifically within transportation. As the image below illustrates, air travel, especially across Europe has practically ceased to exist. IATA reports the combined loss to the industry to be circa $314bn (IATA, 2020) as airlines cut as much as 90% of total capacity, materially reducing the need for its single largest variable cost, aviation fuel.
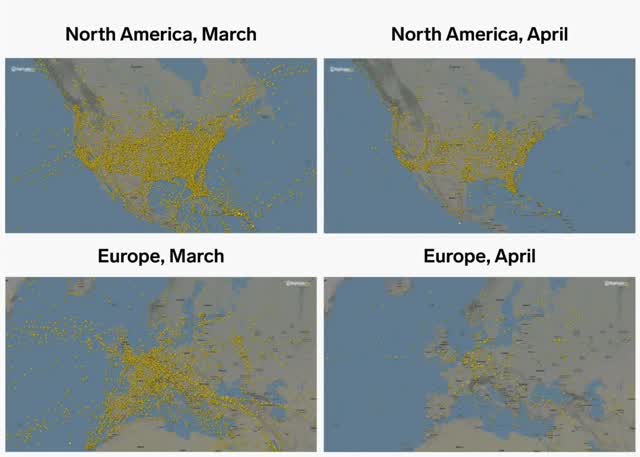
Source: (Business Insider, 2020)
This has extended to other modes of transportation as well, from cars and buses to trains and boats as restrictions are broadly expected to last throughout May. The chart below shows roughly how 25% of the world’s oil supply is used:
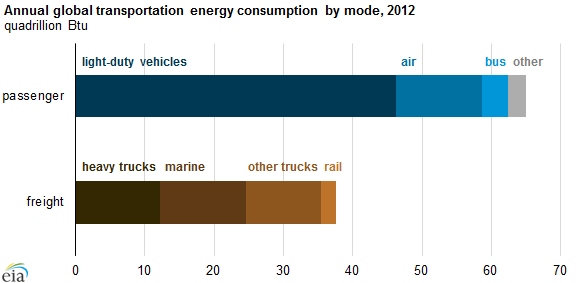
Source: (Maritime Executive, 2020)
Clearly the short-term supply side of oil is getting crippled right now, and the headwinds are both material and extremely damaging in the short term. However, the long-term need for transportation will recover, and the lower equity prices seen in oil majors today do indicate, on balance, a good entry point into oil equities for investors with multi-year time horizons on which to capitalize on this short-term shock.
Financial Analysis
The next quarter will be particularly painful, that much is not up for debate. If the average price per barrel sold falls to $30 from this quarter’s $50, that implies a hit on revenues of circa 40%, hedging caveats aside.
The model for discounted net income below is based on quite an extreme worst-case scenario. This includes a 40% reduction in revenues for FY 2020, tanking profitability to a loss of circa $10bn while hypothesizing a slow and painful recovery. The model below assumes revenues to not fully recover from 2019 levels until 2022 and profitability not to recover until circa 2025-26. It must be stressed that this is quite a dire expectation, and the recovery is likely to be hastened compared to the model below.
|
2020 |
2021 |
2022 |
2023 |
2024 |
|
|
Revenues |
$216.00 |
$259.20 |
$311.04 |
$332.81 |
$356.11 |
|
Operating Profits |
-$10.23 |
$4.54 |
$15.84 |
$16.95 |
$18.14 |
|
Tax at 32.9% |
$0.00 |
$1.49 |
$5.21 |
$5.58 |
$5.97 |
|
Actualized Cash Flow |
-$10.23 |
$3.05 |
$10.63 |
$11.37 |
$12.17 |
|
Discounted Cash Flow |
-$10.23 |
$2.99 |
$10.32 |
$10.93 |
$11.58 |
|
2025 |
2026 |
2027 |
2028 |
2029 |
|
|
Revenues |
$381.04 |
$407.71 |
$436.25 |
$466.79 |
$499.46 |
|
Operating Profits |
$19.40 |
$20.76 |
$22.22 |
$23.77 |
$25.44 |
|
Tax at 32.9% |
$6.38 |
$6.83 |
$7.31 |
$7.82 |
$8.37 |
|
Actualized Cash Flow |
$13.02 |
$13.93 |
$14.91 |
$15.95 |
$17.07 |
|
Discounted Cash Flow |
$12.27 |
$12.99 |
$13.77 |
$14.58 |
$15.45 |
|
10 Year Present Value |
$94.64bn |
|
Assumptions: |
|
|
Discount Rate |
1% |
|
Growth Rate |
7% |
|
Tax Rate |
33% |
However, should this model stand the test of time, overall decade long expectations remain reasonably attractive to investors today. With value generation beyond 7% per annum, and strong dividend growth expectations in the second half of this decade, long-term prospects for RDS remain intact at current prices.
Levers are currently being pulled across the group, from discretionary spending to a slowdown in the hiring of new recruits. Capex is being reduced while FIDs are being granted exclusively to projects profitable at circa $30 per barrel. This has both short-term and long-term implications.
Firstly, free cash flow is being made available to support the balance sheet short term, and to allow RDS to maintain its coveted AA credit rating. This allows it to undertake and maintain attractive financing and keeps interest costs at a minimum. Secondly, having an increasingly large asset base capable of profitability at circa $30 per barrel means profitability is likely to soar should we see oil trade at its longer-term averages of $30-$60 per barrel. Indeed, $60 per barrel prices half a decade from now would see RDS shine, with annual profitability in all likelihood setting new records and its stock price with it. How likely it is we will see such prices this decade is, however, still up for debate.
Conclusion
As Buffett pointed out while talking about Occidental (NYSE:OXY) over the weekend at Berkshire’s annual meeting, betting on oil companies is essentially betting on the future price of oil. As the price of oil rises, so too will the oil majors who produce it. While I firmly believe that oil will hit $40+ per barrel, it is worth noting that this may take years to happen. It is unlikely we will see oil at these levels over the next 12 to 24 months and so this remains a long-term play and a bet on the eventual rise in oil prices above $35 per barrel, the price point at which most European oil majors will reach stable profitability.
RDS remains healthy in terms of its balance sheet and has a competent CEO and management team to guide it through these uncertain times. The next quarter will undoubtedly be a blood bath in terms of cash flow, but measures taken this quarter should have a limited but positive impact.
History doesn’t repeat itself but it does rhyme, and the cyclical nature of the industry should allow oil prices to recover greatly from current levels, however, the time frame for this is up for speculation. I remain confident in RDS long term and believe we will see it rise back, as it has done countless times before in its long history.
To get real-time updates on my latest articles, follow me right here on Seeking Alpha.
Disclosure: I am/we are long RDS.B. I wrote this article myself, and it expresses my own opinions. I am not receiving compensation for it (other than from Seeking Alpha). I have no business relationship with any company whose stock is mentioned in this article.
Be the first to comment