

samsam62/iStock via Getty Images
Investment thesis
Roche Holding AG (OTCQX:RHHBY) (OTCQX:RHHBF) has been in a downtrend since April 2022, while underperforming the healthcare sector, the stock could perform better than its industry in the past 5 years. The stock has reached my previously set target, but failed to break out above that level and has since consolidated. Although drug manufacturers didn’t perform well in the past 3 months, the stock is showing some relative strength and could attempt to reach its overhead resistance, but would need significant conviction and buying volume to overcome it. My most likely price target is set at CHF 333 or around $43, followed by an even higher target at CHF 350 or around $46, resulting in a 3% to 9% short-term upside potential from its latest closing price.
A quick look at the big picture
The healthcare sector in the US is among the winners in the last 3 months, led by a rebound in biotechnology stocks, followed by companies in the diagnostics and research industry, while companies in the drug manufacturing industry performed worse in the group.
finviz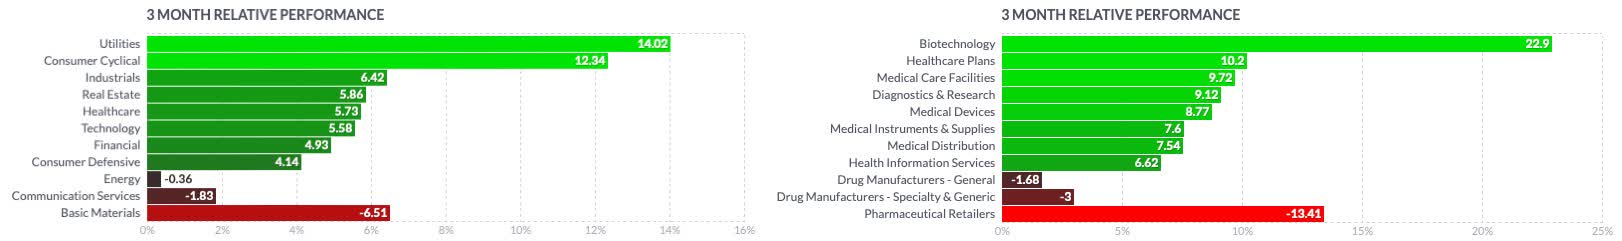
The VanEck Vectors Pharmaceutical ETF (PPH) began to show relative weakness in July and finally fell into a downtrend in August when compared to the broader healthcare sector. Despite a recent rebound, the industry reference seems to be set for further weakness as no sign of relative strength is shown, and every important support level has been broken.
Author, using TradingView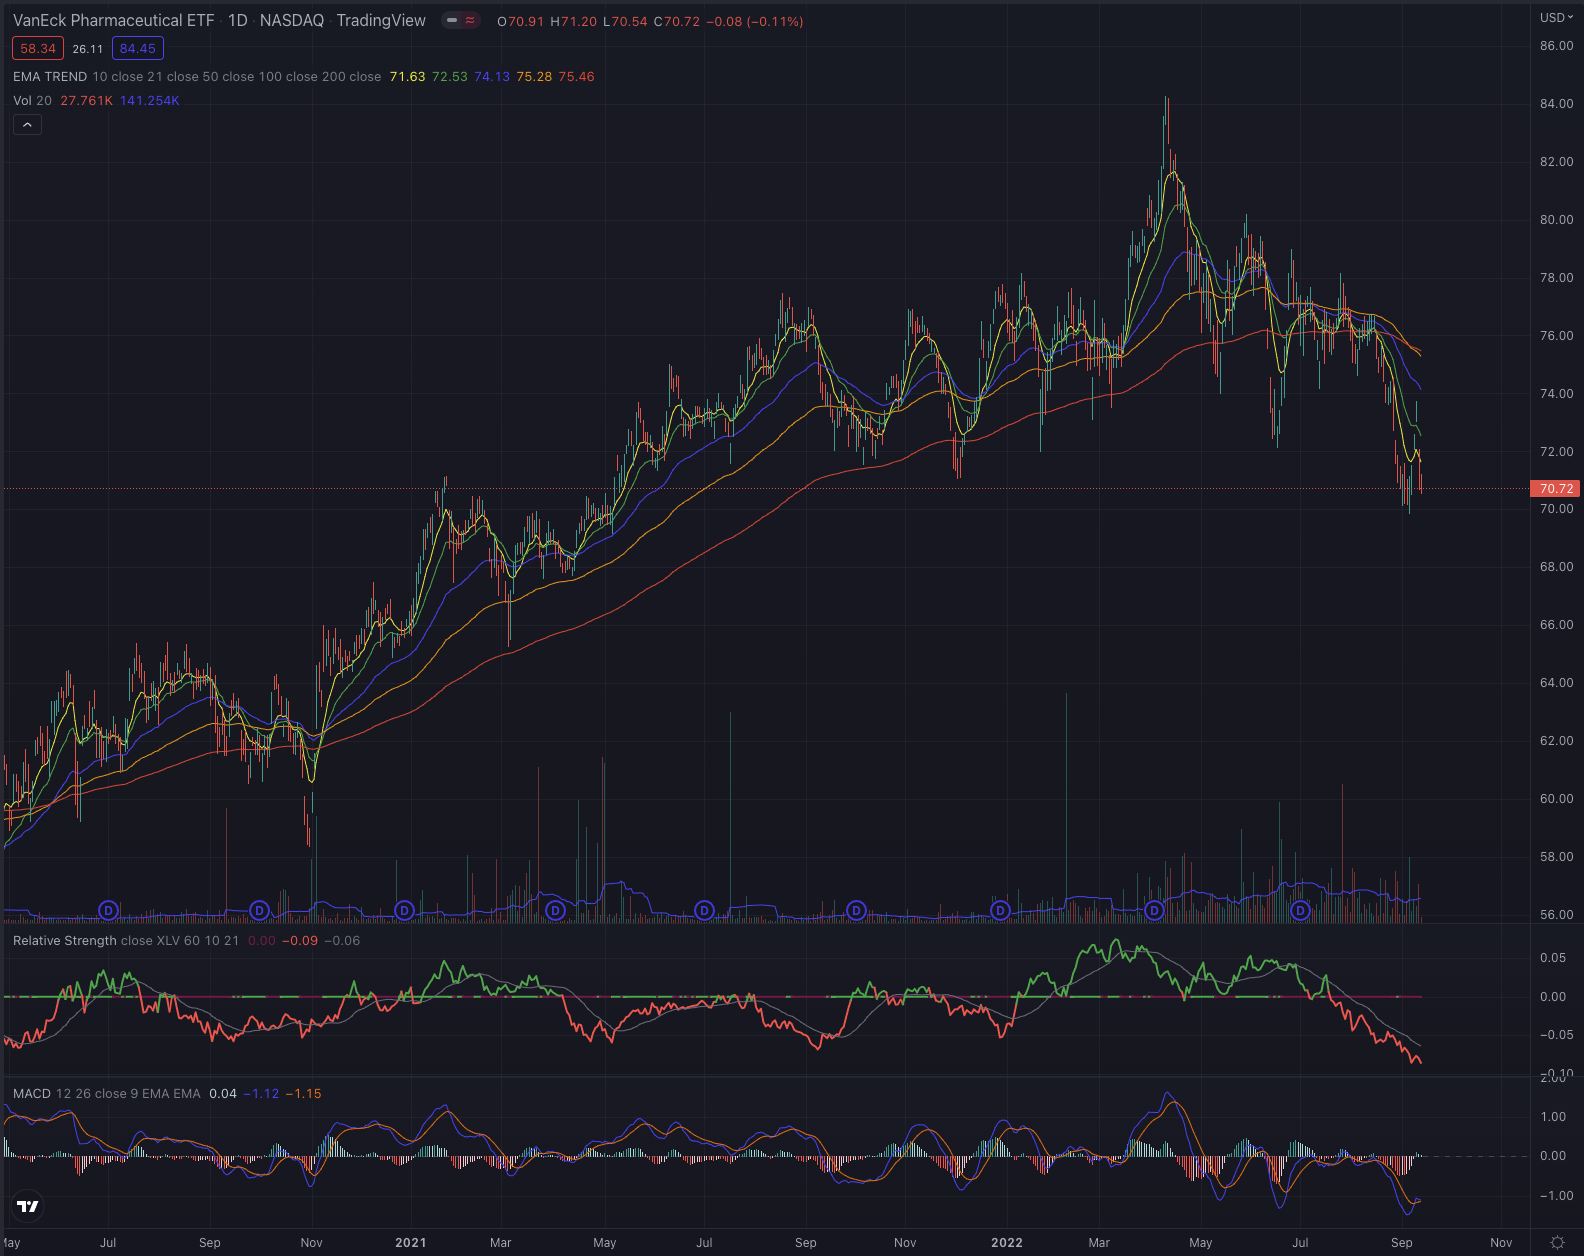
Looking back even further, Roche significantly underperformed its main sector reference but could establish itself better in its industry, reporting 32.41% performance over the past 5 years, 42% better than its industry reference, but still about 40% worse than the Health Care Select Sector SPDR (NYSEARCA:XLV).
Author, using SeekingAlpha.com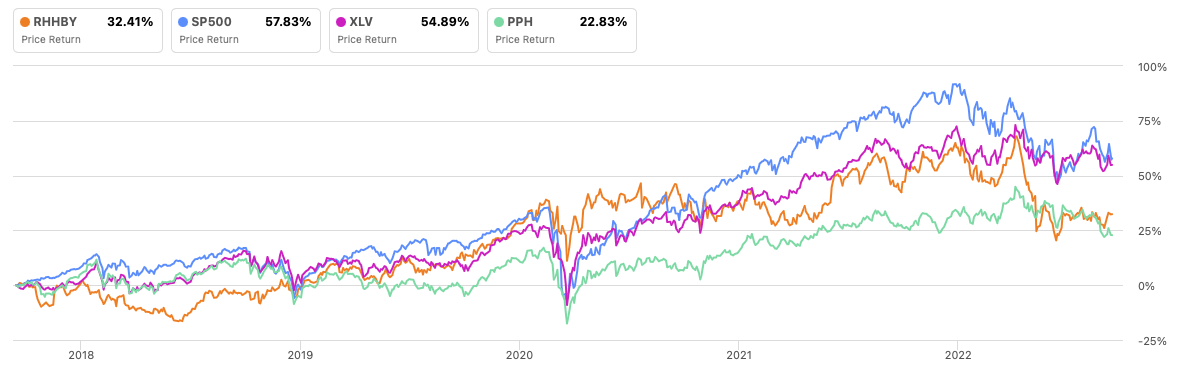
Where are we now?
The primary exchange for Roche is at the SIX, and I always perform technical analysis at the main listing of a company’s stock. Since my last article Roche: The Undervalued Swiss Pharma Giant, the stock has reached my previously set target at CHF 335 but failed to overcome this price level, by consolidating shortly after, and since hovering in a side-movement around the EMA50. The stock is attempting to overcome its upper limit, set by the EMA100 but the increasing selling volume has since now underscored the rejection of any possible outbreak.
Author, using TradingView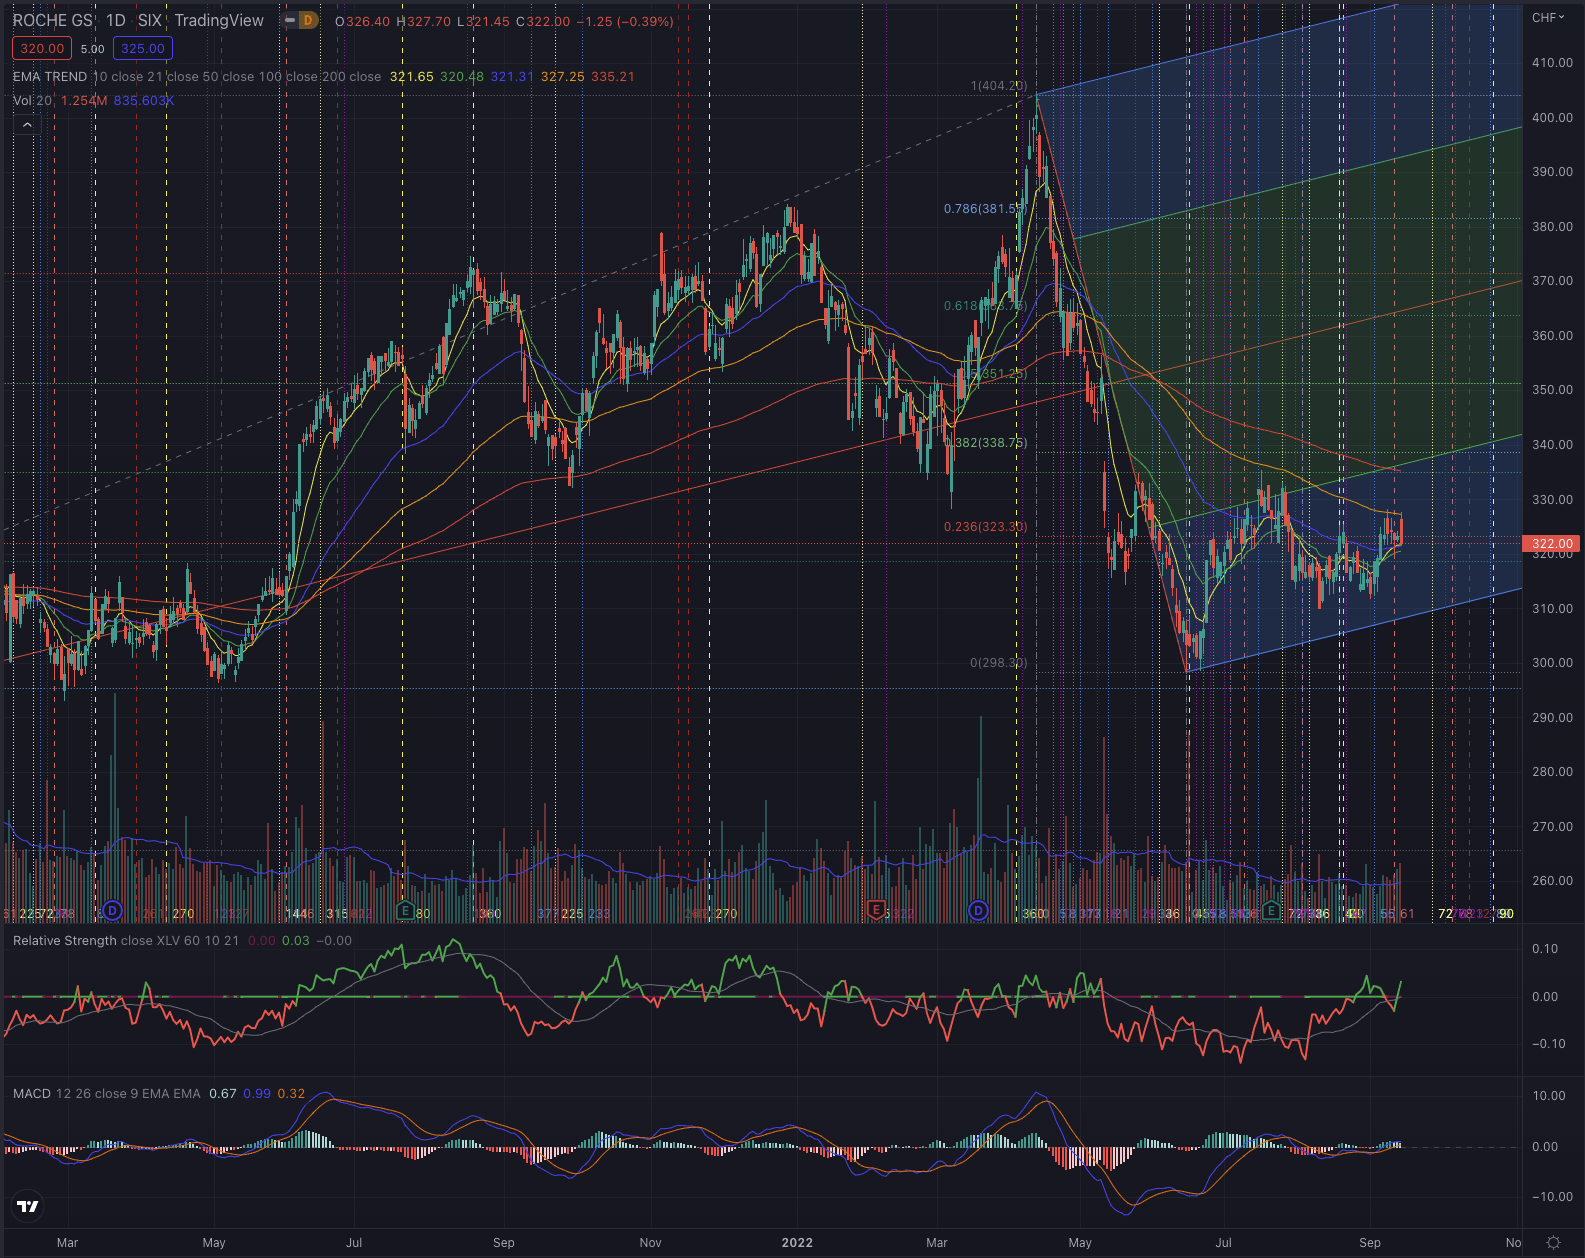
Although some relative strength seems to build up, and the stock shows some positive momentum confirmed by its MACD, which is rising over its signal line, it will need substantial volume and conviction to overcome the strong overhead resistance set by the EMA100 and the EMA200, and the upper limit of the ascending channel, while some support could be found at the EMA50 at the actual price level.
What is coming next
I expect the stock to continue to underperform its reference sector, while it could outperform its industry in the near term, as the stock is fundamentally undervalued and has a promising pipeline. Technically the stock seems to be more likely to continue its sideways movement, forming a sound base, from which it would start attempts to break out, as shown in the past 3 months.
Author, using TradingView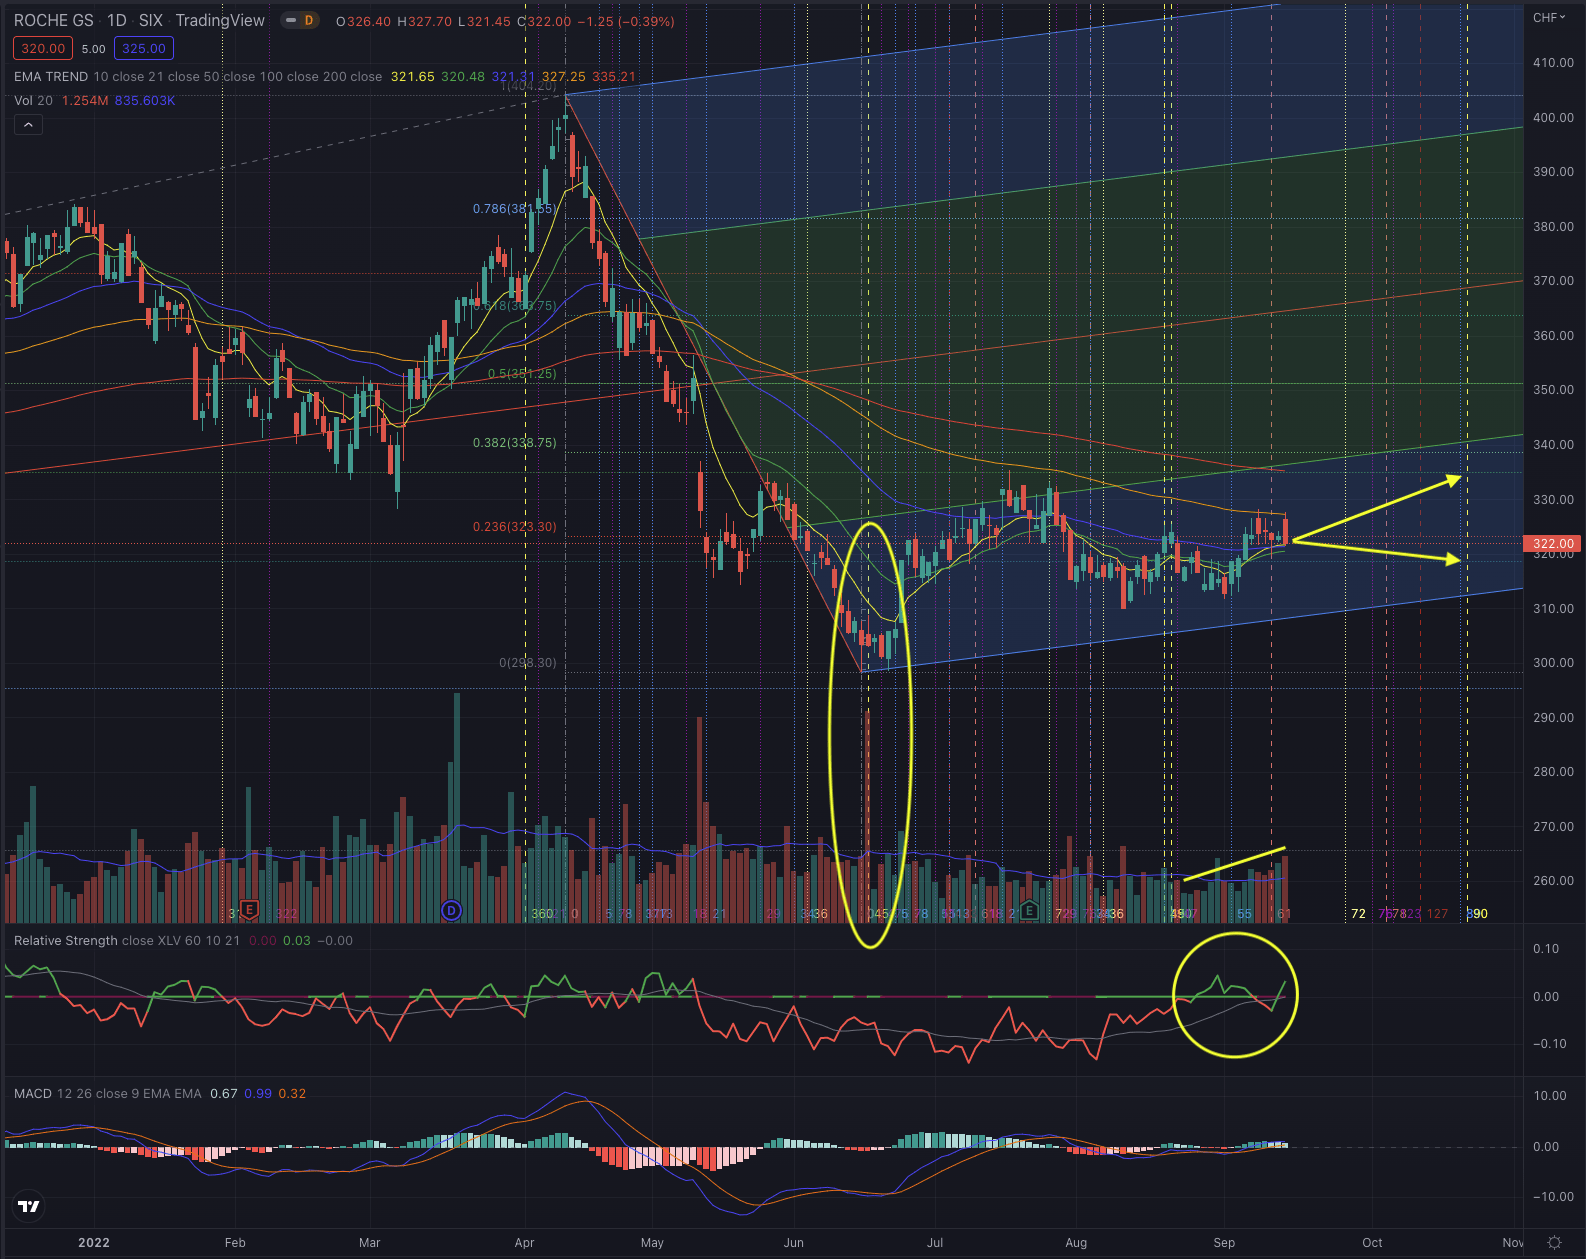
My calculations based on Fibonacci’s theory, suggest the most likely price target is around CHF 333 or $43. If the stock breaks this target, the next most likely target is seen at CHF 350 or $46.
Investors should observe the price action and how the stock behaves at the next support and resistance levels, and how an eventual attempt to overcome its resistances is confirmed or rejected, by particularly observing the trading volume in both directions and the relative strength. As the breakout over the EMA100 seems hard in the short term, I would put particular attention on the EMA50, as it could serve as a trailing stop, to protect from eventual drops.
The bottom line
I consider techniques based on the Elliott Wave Theory, as well as likely outcomes based on Fibonacci’s principles, by confirming the likelihood of an outcome contingent on time-based probabilities. The purpose of my technical analysis is to confirm or reject an entry point in the stock, by observing its sector and industry, and most of all its price action. I then analyze the situation of that stock and calculate likely outcomes based on the mentioned theories. Roche likely bottomed on June 16, and since forming a sound base with a slight uptrend tendency. The stock faces significant overhead resistance which it has since now failed to overcome, but a positive relative strength and increasing volume could indicate that the stock could be rising with more momentum and could attempt to reach the next targets set at CHF 333 or $43 and further at CHF 350 or $46. I would certainly consider the EMA50 as my trailing stop-loss and not wait for the stock to bottom again, as there may be a likelihood to test the recent lows.
Be the first to comment