

osmanpek/iStock via Getty Images
(This article was co-produced with Hoya Capital Real Estate)
Introduction
I was aware there were Shariah screened bond or generic equity funds but not sector specific ones like the ETFB Green SRI REITs ETF (NYSEARCA:RITA). For other religions, socially screened funds have existed for a long time and have accumulated $100b in assets across 180+ ETFs.
Some investors do not find these non-Shariah screened funds to always incorporate all the restrictions that the Shariah law would apply, thus the growing number of ETFs that follow those laws, though each manager probably applies slightly different interpretations. I listed several Shariah-based ETFs that I found at the end of this article. The main focus here is to review the ETFB Green SRI REITs ETF, then compare it against a unrestricted REITs ETF, the iShares Global REIT ETF (NYSEARCA:REET). Since I did find a second Shariah REIT, a lighter comparison is done against the S&P Global REIT Sharia ETF (SPRE).
ETFB Green SRI REITs ETF review
Seeking Alpha describes this ETF as:
The fund invests in dividend paying stocks of companies, that are deemed socially conscious in their business dealings and directly promote environmental responsibility. It invests in stocks of companies that follow the values and teachings of Shariah law. It does not invest in companies related alcoholic beverages, tobacco, gambling/casino, firearms, military/weapons of mass destruction, adult entertainment, music and radio, cinema and television, conventional financial services, embryonic stem cells, pork related products. The ETF invests based on the FTSE EPRA Nareit IdealRatings Developed REITs Islamic Green Capped Index. RITA started on 12/8/2021.
Source: seekingalpha.com RITA
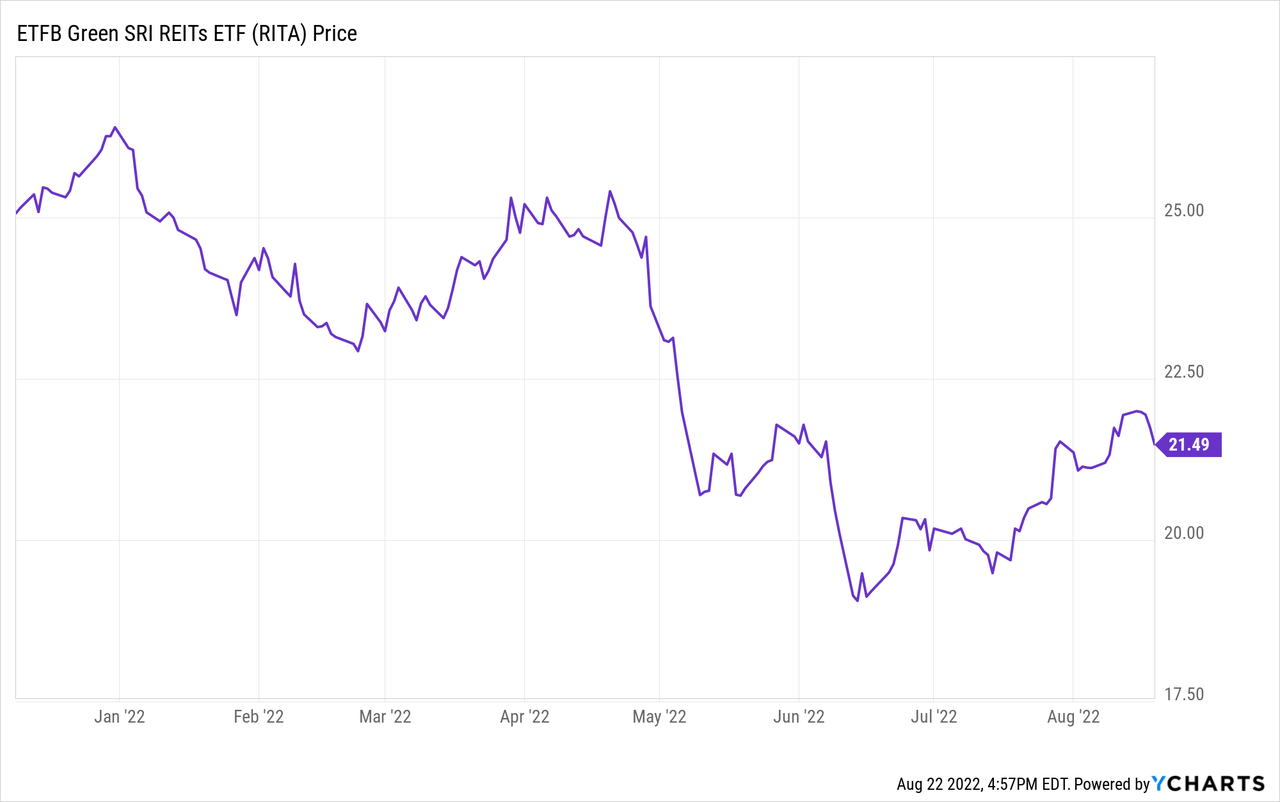
RITA is very small at $13m in assets. The managers charge 50bps in fees, which is reasonable. As RITA is under one year old, I will assume it will eventually yield 2.9%, as does the underlying index.
Index review
FTSE Russell provided this description for the FTSE EPRA Nareit IdealRatings Developed REITs Islamic Green Capped Index.
The FTSE EPRA Nareit IdealRatings Developed REITs Islamic Green Capped Index underlying universe is the FTSE EPRA Nareit Developed REITs Index whose constituents are then screened according to the business and financial activities as outlined in the FTSE IdealRatings Islamic Indexes Screening Guidelines. The Index is reviewed each September.
Source: research.ftserussell.com Index
While the ETF is new, the Index has more history, though most is back-tested data I believe.
research.ftserussell.com Index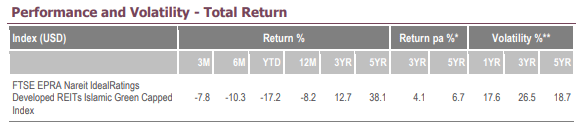
To compare, REET was up 4.4% over the past five years, versus a CAGR of 6.7% for RITA’s Index. How well RITA tracks the Index could be the key to its success.
Using the RITA Prospectus, I was able to find these Index rules:
Business Screening:
To be eligible for inclusion in the Index, companies must meet the following criteria:
• The company invests at least 75% of its total assets in real estate;
• The company derives at least 75% of its gross income from rents from real property;
• The company pays at least 90% of its taxable income annually in the form of shareholder dividends;
• The company is taxed as a corporation;
• The company is managed by a board of directors or trustees;
• The company has at least 100 shareholders; and
• The company has no more than 50% of its shares held by fewer than five individuals.
Financial Screening:
Eligible companies are further screened to eliminate REITs whose interest-bearing debt exceeds 33% of the market value of the REIT’s assets (or book value, if higher).
SRI screening:
Consistent with Shariah principles, eligible REITs are screened to eliminate REITs earning more than 5% of their income from interest-bearing investments or from the following business activities or tenants engaged in such activities:
cdn-webmaker1.nyc3.digitaloceanspaces.com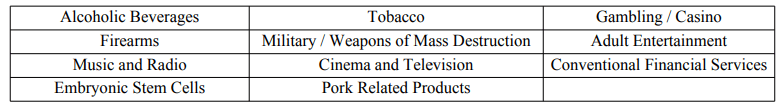
Green screening:
Eligible REITs are further screened to eliminate any REITs that have not received a Green Certification from an eligible third-party certifying body (e.g., LEED certifications from the U.S. Green Building Council or BREEAM certifications from Building Research Establishment Ltd.). Green Certifications are determined based on the share of total net leasable area owned and/or managed by a constituent that is certified as part of an eligible green certification scheme.
Green Tilt and Weighting:
REITs meeting the above screens are included in the Index at the time of each quarterly rebalance and reconstitution of the Index. The Index is rebalanced and reconstituted effective at the market open on the Monday following the third Friday of each March, June, September, and December based on data as of an earlier date. Companies are given weights based on their relative free float market capitalization to the aggregate free float market capitalization of the Index’s investment universe, subject to a minimum individual company weight of 0.5% and a maximum individual company weight of 20%. Additionally, the aggregate weight for all companies with a weight greater than 4.5% is “capped” at a maximum of 48% at the time of each rebalance and reconstitution of the Index.
The Prospectus goes into more detail on each point and definitions for each industry classification.
RITA holdings review
The RITA data available did not include sectors or countries so I turned to another source and cross-referenced the data into the RITA holdings and percentages provided by the manager.
multiple sources; compiled by Author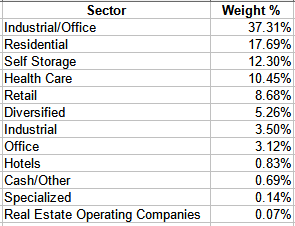
Industrial/Office is the top sector even without including the fact each type has its own sector too with an additional 6.62% allocations.
multiple sources; compiled by Author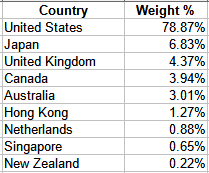
While RITA is Global in its coverage, the Top three countries account for 90% of the portfolio, with the US the dominant country.
Top 20 holdings
multiple sources; compiled by Author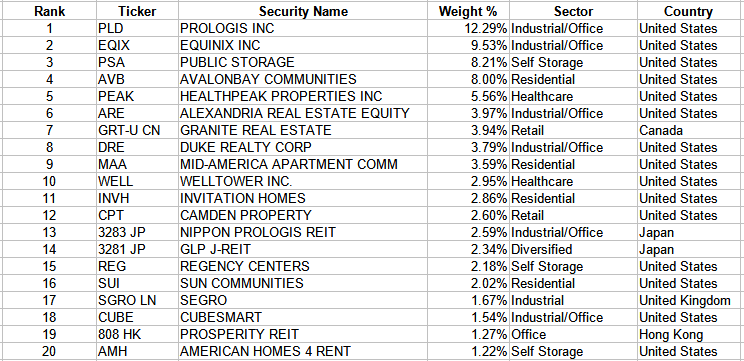
Over 43% of the weight is in the five largest holdings; the Top 20 account for more than 82% of the portfolio weight. The current asset count is 68. The Index states the average market-cap is $8.8b, with a median value of $3.4b.
RITA distribution review
seekingalpha.com RITA DVDs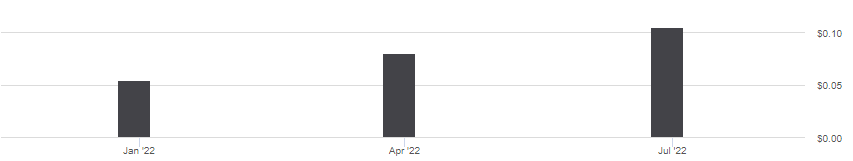
Being a new ETF, distribution history is very limited. I suspect the first payout was below normal as the ETF started toward the end of the quarter. It is a good sign that the most recent payout was an improvement over the prior one. Quarterly payout levels will need to reach $.15 to match the yield listed in the Index PDF.
iShares Global REIT ETF review
Seeking Alpha describes this ETF as:
The fund invests in stocks of companies operating across mortgage real estate investment trusts (reits), financials, diversified financials, equity real estate investment trusts (reits) sectors. It invests in growth and value stocks of companies across diversified market capitalization. It seeks to track the performance of the FTSE EPRA Nareit Global REITs Index. REET started in 2014.
Source: seekingalpha.com REET
REET has $3.2b in assets and comes with a 14bps fee. The current yield is near 3%. One reason I picked REET, not one of the more well-known REIT ETFs, is it uses the same index as RITA but without the restrictions. FTSE Russell provides this overview of the Index.
The FTSE EPRA Nareit Global Real Estate Index Series is designed to represent general trends in eligible real estate equities worldwide. Relevant activities are defined as the ownership, trading and development of income-producing real estate. The index series now covers Global, Developed and Emerging indices, as well the UK’s AIM market. By making the constituents of the indices free-float adjusted, liquidity, size and revenue screened, they are suitable for use as the basis for investment products, such as derivatives and Exchange Traded Funds.
Source: research.ftserussell.com Index
REET holdings review
While REET had both sector and country data, I chose to cross-reference its holdings using the same source I used for RITA to allow for apples-to-apples comparison.
multiple sources; compiled by Author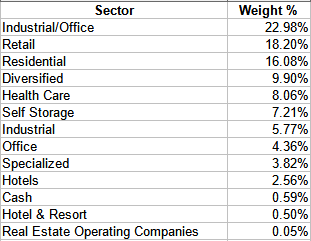
I will compare these sector allocations against RITA later, but REET is not as top heavy as RITA. The data shows that not all data providers classify REITs the into the same sector; not use even the same list of sectors. That said, the two sources were close.
multiple sources; compiled by Author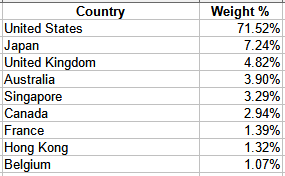
The above are the nine countries where REET had a 1% or greater weight. REET has positions in 19 more countries. While not as high as RITA, the US is the major country here too.
Top 20 holdings
multiple sources; compiled by Author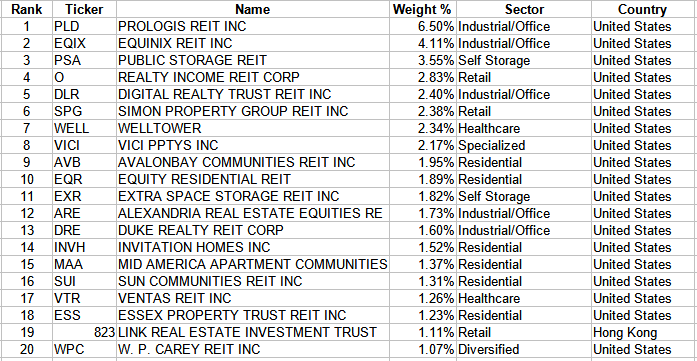
With over 350 REIT positions, REET is less dependent on the Top 5 (19%) and its Top 20 (44%) holdings, but both percentages show REET is concentrated considering the number of REITs held.
REET distribution review
seekingalpha.com REET DVDs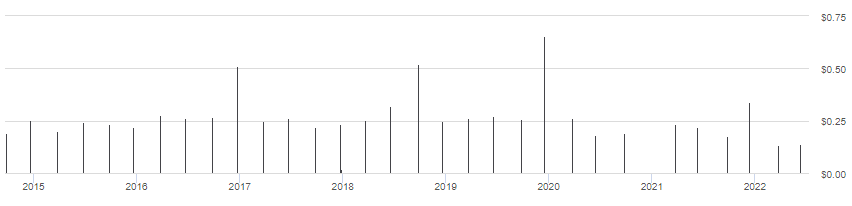
Except for a few payout “spikes”, the dividend has not grown since REET first started. REET skipped a payout at the end of 2020 and used LTGs to cover part of the 2019 payouts.
Comparing RITA and REET
ETFRC.com overlap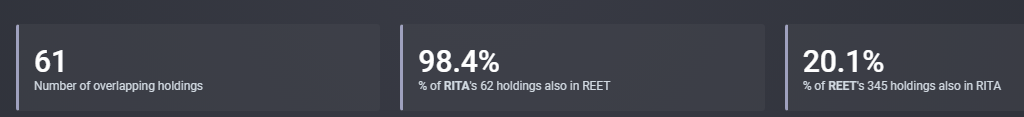
While REET holds all but one REIT held by RITA, screens keep 80% of REET’s holdings ineligible for RITA to own. That effect is shown in the next two charts. The first shows the holdings with the largest weighting overlap.
ETFCR.com top holdings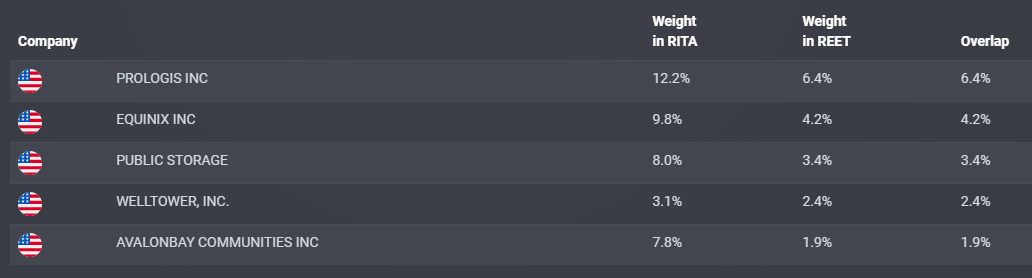
Between these top holdings in RITA, they account for 41% of the portfolio. In REET, only 18%. The next chart shows each ETF’s top holdings and how they compare against the other ETF.
ETFRC.com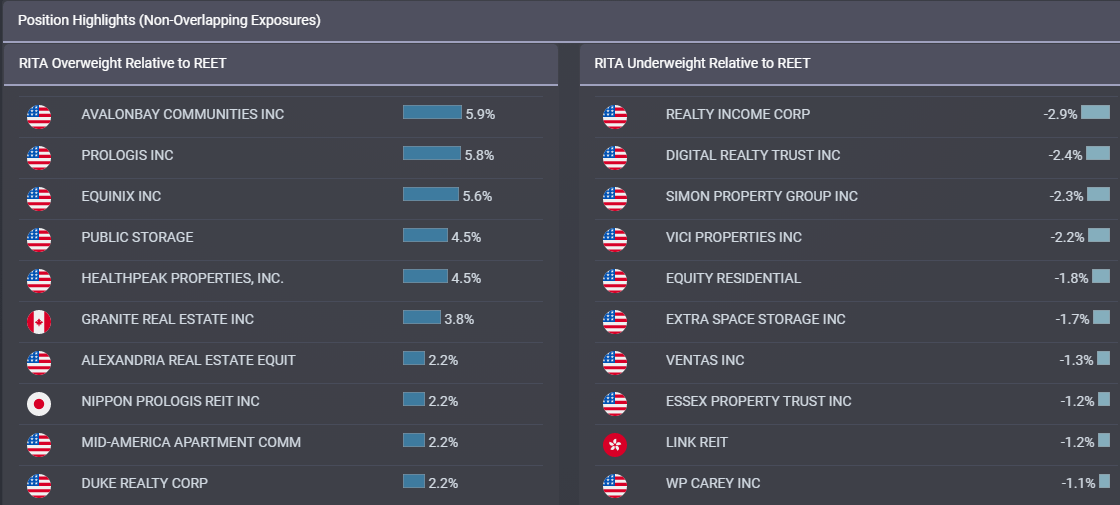
Except for the light weight in the US for REET, the country weights are close.
multiple sources; compiled by Author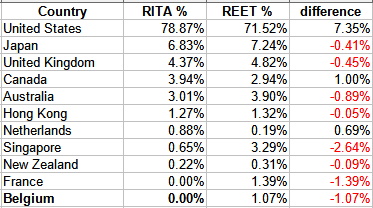
With sectors now with a common source, here is how the two ETFs match up.
multiple sources; compiled by Author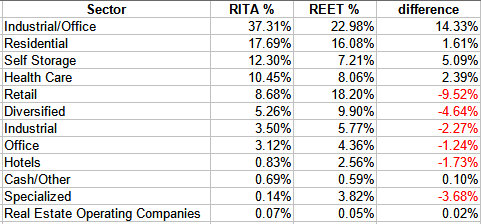
RITA has a definite shift away from Retail, Diversified, and Specialized REITs and into Industrial/Office ones. The 10 largest holdings in REET that RITA investors do not get exposure to are:
multiple sources; compiled by Author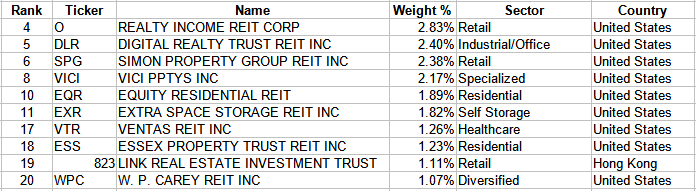
Comparing RITA with SPRE
The S&P Global REIT Sharia ETF was the other Shariah-restricted ETF. Seeking Alpha describes this ETF as:
SP Funds S&P Global REIT Sharia ETF is a Shariah-Compliant exchange traded fund launched and managed by Toroso Investments, LLC. The fund is co-managed by Shariaportfolio, Inc. The fund invests in public equity markets of global region. The fund invests in stocks of companies operating across real estate, equity investment trusts (REITs) sectors, across diversified market capitalization. The fund seeks to track the performance of the S&P Global All Equity REIT Shariah Capped Index. SPRE started at the end of 2020.
Source: seekingalpha.com SPRE
SPRE has $18.7m in AUM and comes with a 60bps fee schedule. The 12-month yield is 3.4%. SPRE started at the end of 2020.
SPRE uses the S&P Global All Equity REIT Shariah Capped Index which consists of 53 REITs. SPRE apparently does not hold all of them (pdf). For those interested, the Index Methodology PDF covers its rules.
ETFRC.com overlap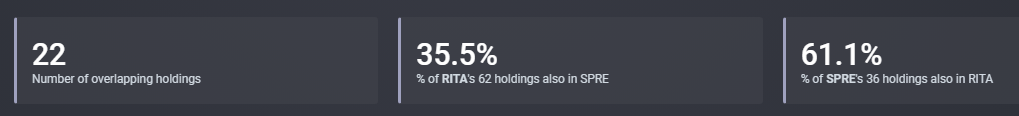
So we have two REIT ETFs claiming to following Shariah law and yet own very different portfolios. At least investors have a choice.
ETFRC.com holdings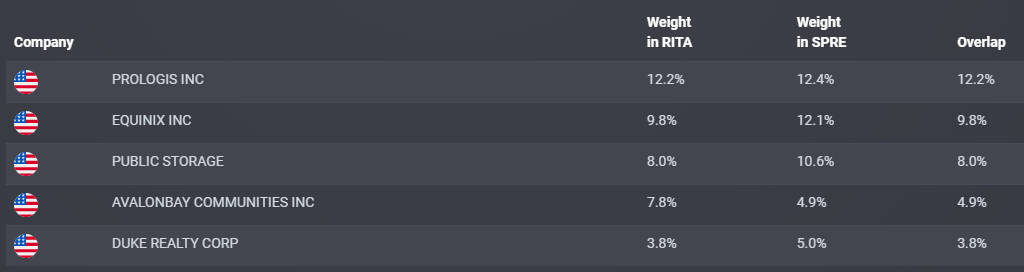
The weight difference between ETFs for the Top 5 slightly favors SPRE; not the wide difference seen in the prior comparison. The top holdings differences are:
ETFRC.com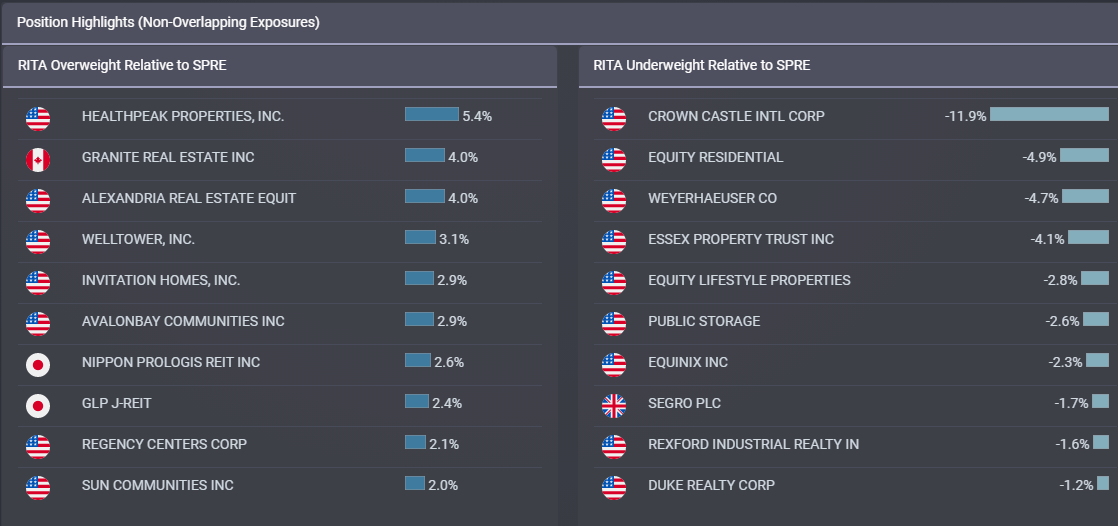
Portfolio strategy
I know many investors have strong opinions on whether one’s personal values should play a part in their portfolio construction policy, both pro and con, which is up to them. Without ETFs like RITA or SPRE, and other screened funds, that choice/decision would not exist. Even if the concept is rejected, knowing such funds do exist is important as these funds could tilt the “playing field” by adding demand to certain market segments over others. Think of the concerns that fossil fuel companies are having as ESG/SRI funds start pressuring banks not to lend to that industry due to climate concerns.
Changing REITs environment
FTSE, who helped develop the indices used by RITA And REET divides the REITs market into these sectors.
www.reit.com sectors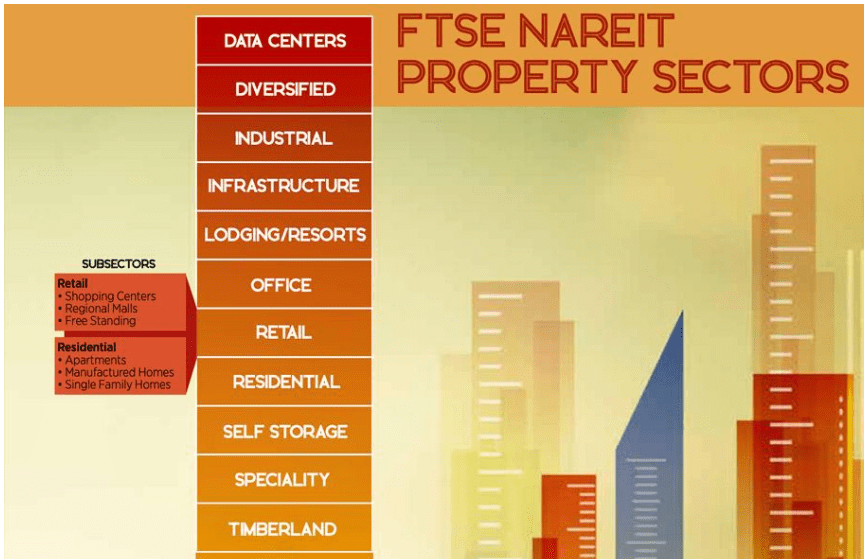
They also presented a chart showing how the weights of those sectors have changed since 1993.
www.reit.com sectors weights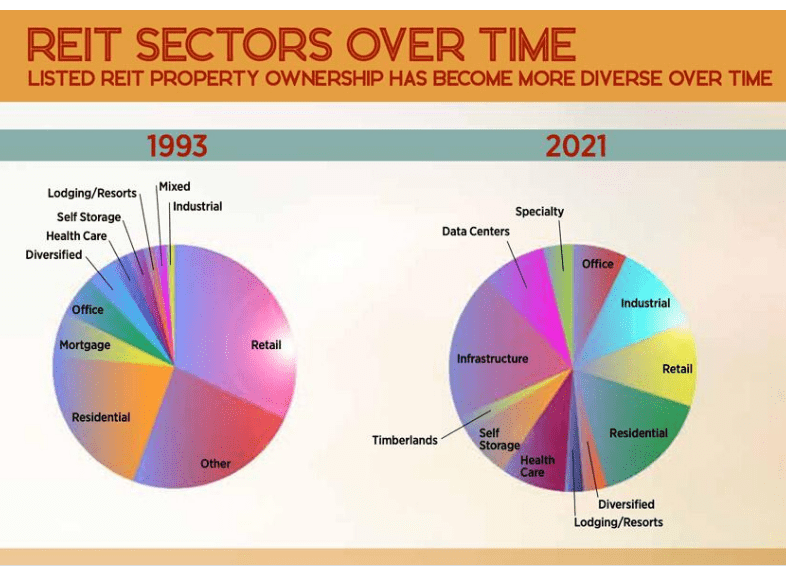
Will ESG, SRI, and other screening techniques continue these shifts or possibly reverse them? As a prior president liked to say, “That question is above my pay grade.”.
Other Shariah ETFs not already mentioned
Stocks
- Wahed FTSE USA Shariah ETF (HLAL): FTSE USA Shariah Index
- SP Funds S&P 500 Sharia Industry Exclusions ETF (SPUS): S&P 500® Shariah Index
- Wahed Dow Jones Islamic World ETF (UMMA): Dow Jones Islamic Market International Titans 100 Index
Bonds
- SP Funds Dow Jones Global Sukuk ETF (SPSK): Dow Jones Sukuk Total Return (ex‑Reinvestment) Index
There are several Shariah equity ETFs available for investors who trade in Europe from BlackRock and Invesco. Wealthsimple has one that trades in Canada.
Final thought
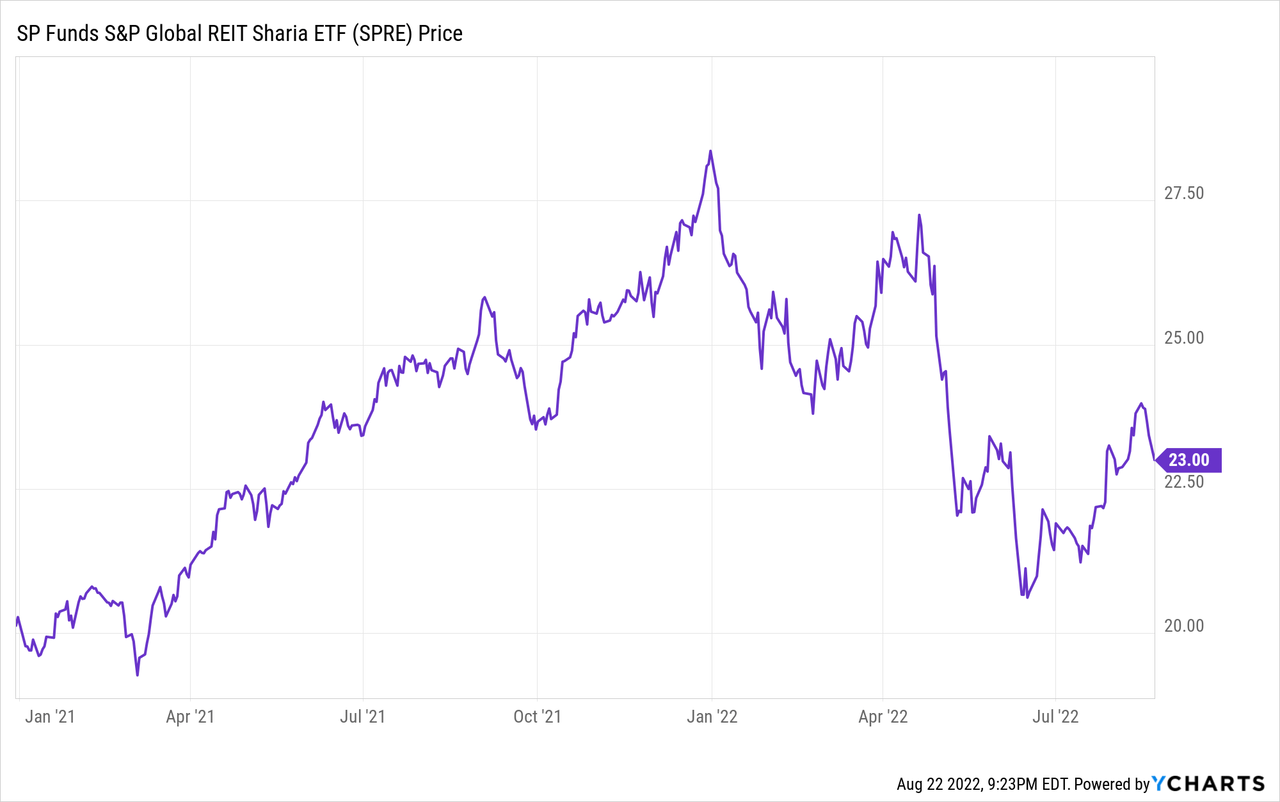
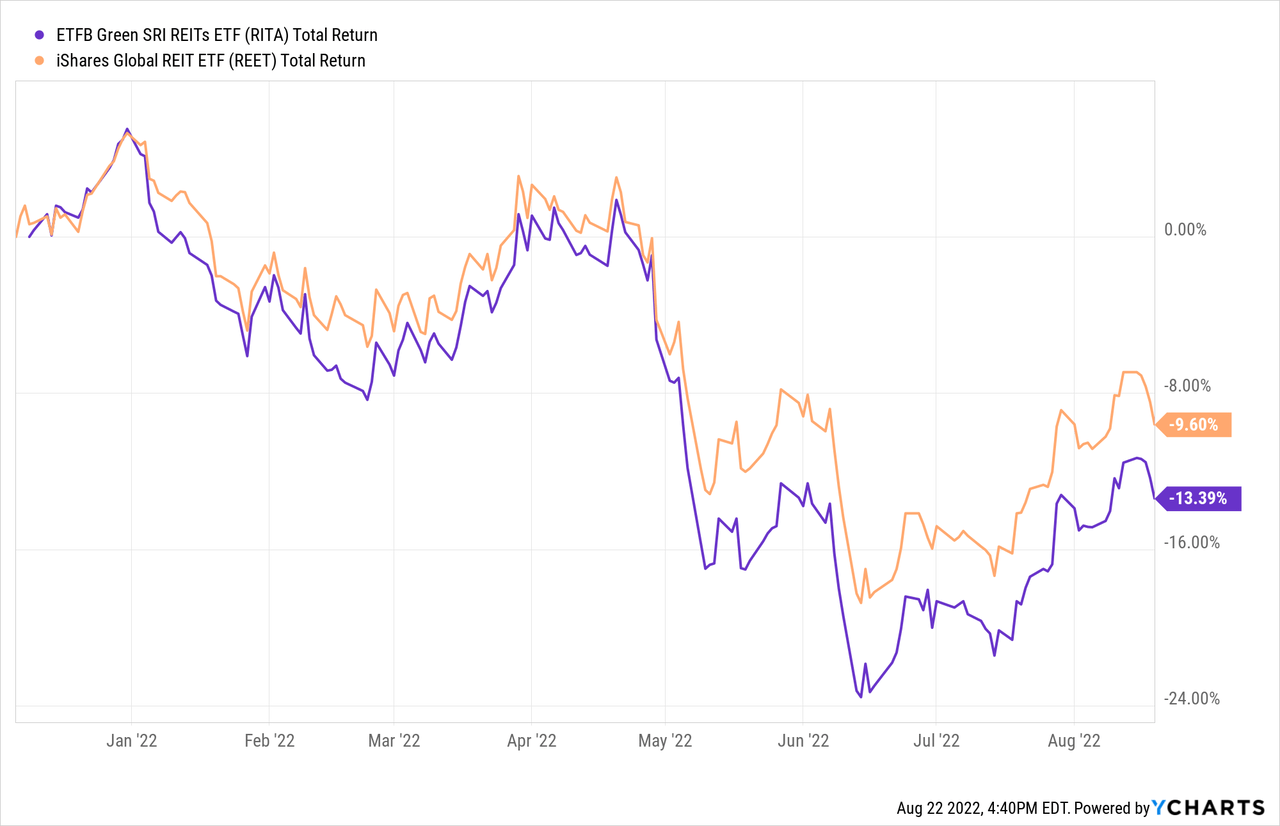
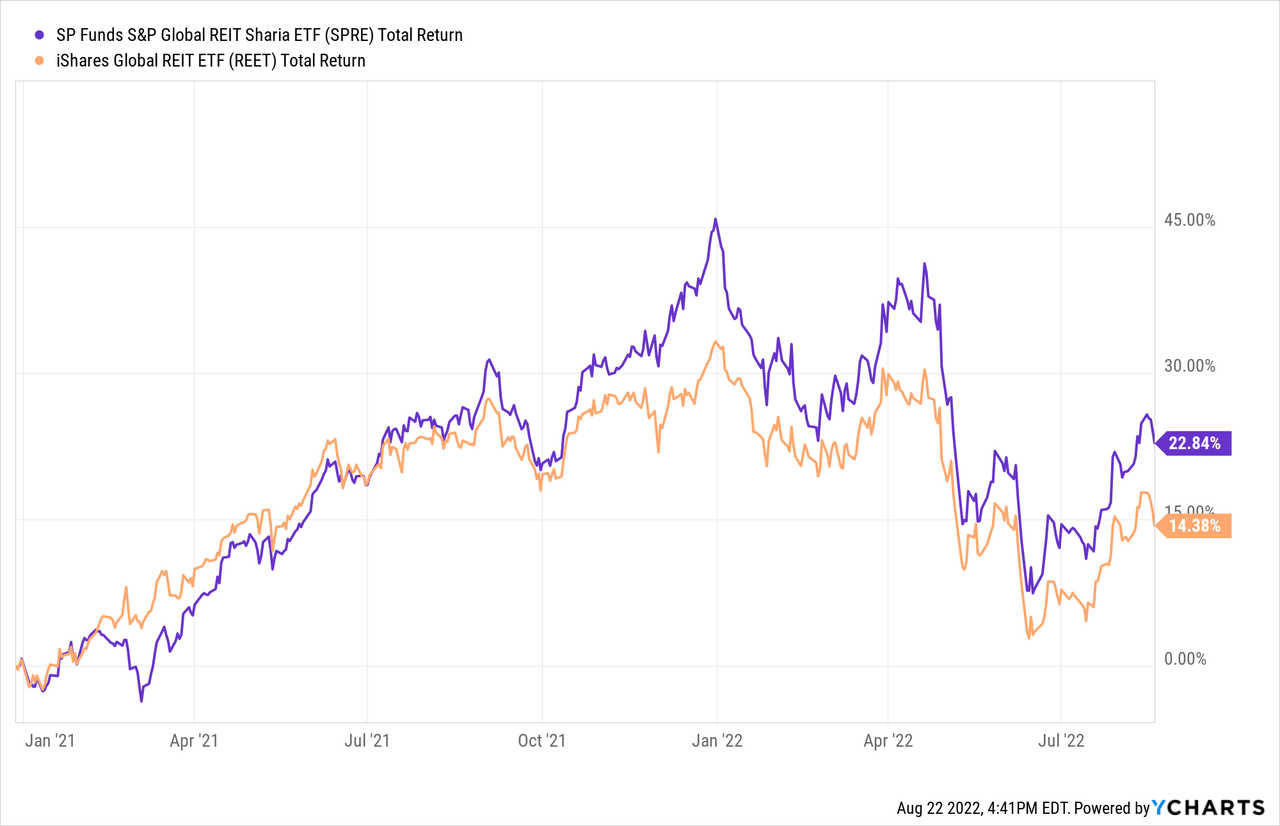
For investors putting their ethnical values above the need to for returns for parts of the portfolio allocation, then either the RITA ETF or SPRE ETF are your choices for REIT exposure for Shariah-restrictions. Since the results for both of these ETFs are close to the non-restricted Global REIT ETF, that “give up” might not always be required. Here is how both Global Shariah ETFs have performed versus a non-restricted Global REIT ETF, REET. While SPRE is only 20 months old, it does show there is the ability to invest ethically and outperform an unrestricted ETF, but not always.
The next chart only shows data since RITA started in early 2022.
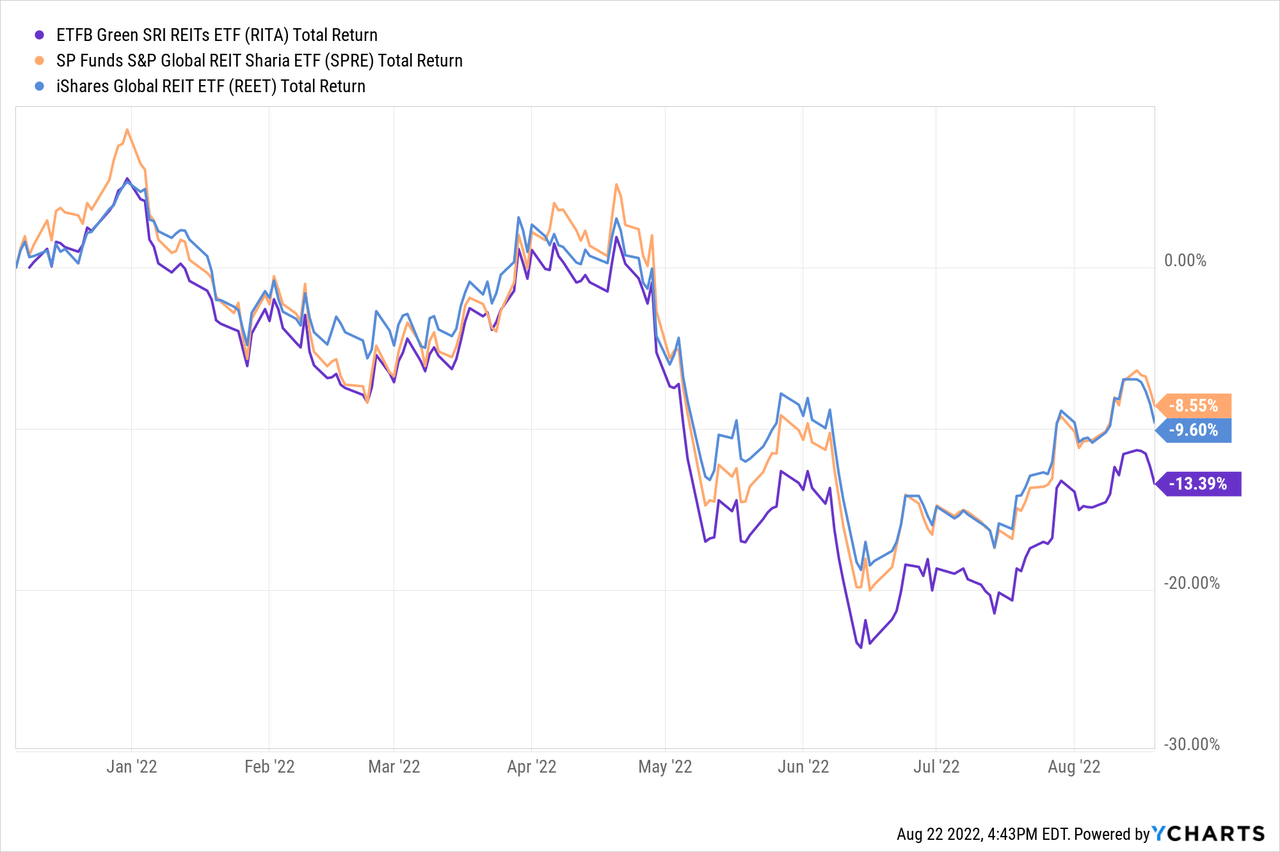
While the ETF history favors SPRE, the underlying indices favors RITA as the best choice.
Be the first to comment