

urbazon/E+ via Getty Images
I am usually eager to invest in residential real estate. But the U.S. Housing market is breaking at the seams. U.S. households are struggling to shoulder the increasing costs of everything, including rent. With mortgage rates the highest in nine years the housing market is due for a correction and it’s going to take residential REITs with it.
Housing is Falling Apart
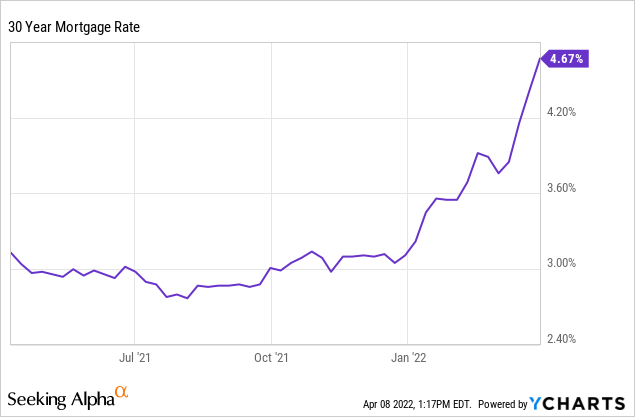
In my previous article U.S. Housing Is A Dead Man Walking I outlined the reasons why the U.S. Housing market is in trouble and starting to show signs of weakness. The reason is because housing affordability is at an all time low by many metrics. This is a result of elevated home prices, due to an enthusiastic market, and mortgage rates rising at the fastest pace on record. The average 30 year rate on a new mortgage is now 4.89%.
As a consequence, buying a home is now the most expensive relative to renting since 2008. This is important because when housing is overvalued, like in 2007, the cost relative to renting increases out of proportion, like today. The decline in housing affordability causes rents to rise as residents are priced out of buying and rental occupancy rates rise.
But the cure for high prices is high prices. After housing peaks and begins affordability mean reversion rent price growth declines with it. This occurred after 1980, 1989, 2007, and appears ready to do so again. The dramatic rise in mortgage rates leads me to believe that pivot point is near.
FRED Data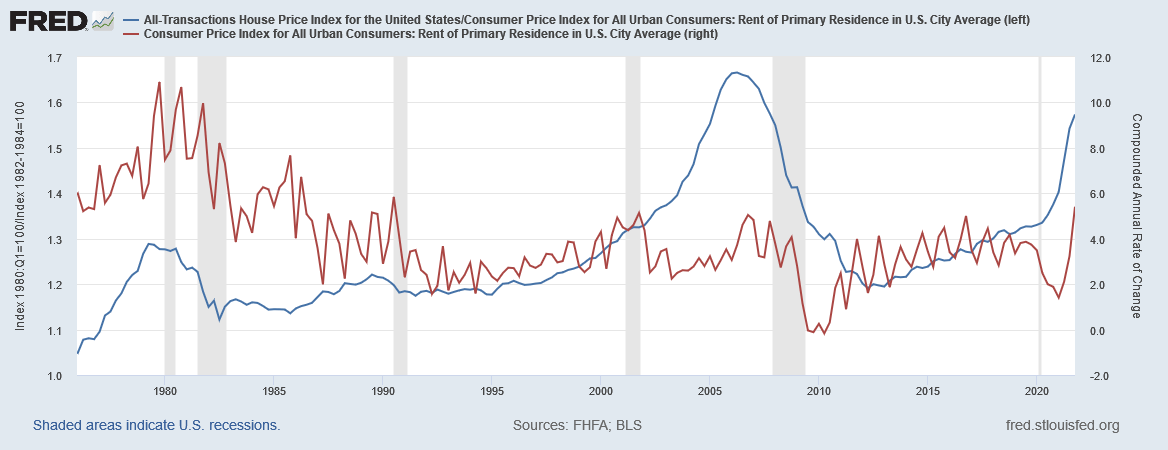
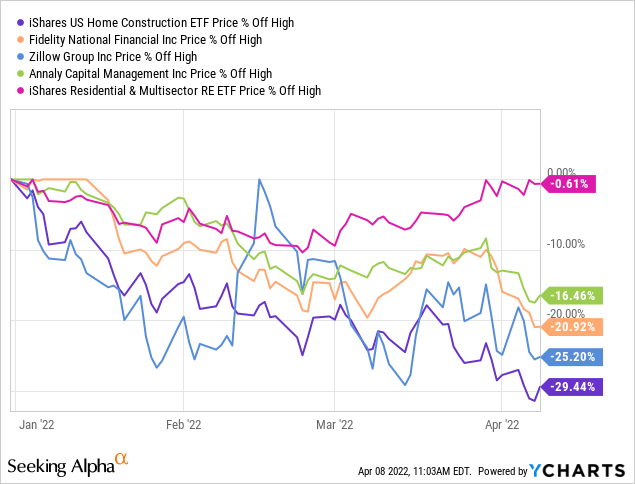
Sectors related to housing have begun to anticipate this weakness since the start of the year. Homebuilders are down 29% YTD despite attractive valuations, a sign that the market sees trouble ahead. It’s not surprising, then, that homebuilder gross margins have suddenly declined. Zillow (Z) and other real estate services are down similarly. Mortgage lenders and title companies such as Annaly (NLY) and Fidelity National Financial (FNF) are also down. The industry is falling apart at the seams.
And then there are REITs. Most residential REITs, including the iShares Residential Real Estate Capped ETF (NYSEARCA:REZ), are up on the year or slightly down. They are holding up against the backdrop of rising rents and increasing property values. However, I think it is a ticking time-bomb.
Examine the chart below which compares REZ with 30 year mortgage rates. Over the last 15 years, dramatic rises in mortgage rates have correlated with a sharp decline in REZ (outlined in red boxes). The average decline during the three correlated periods was 18%. During the 2008 housing correction REZ declined over 70%. I do not expect that this housing market is the same as 2008, but it is similar in many ways.
TradingView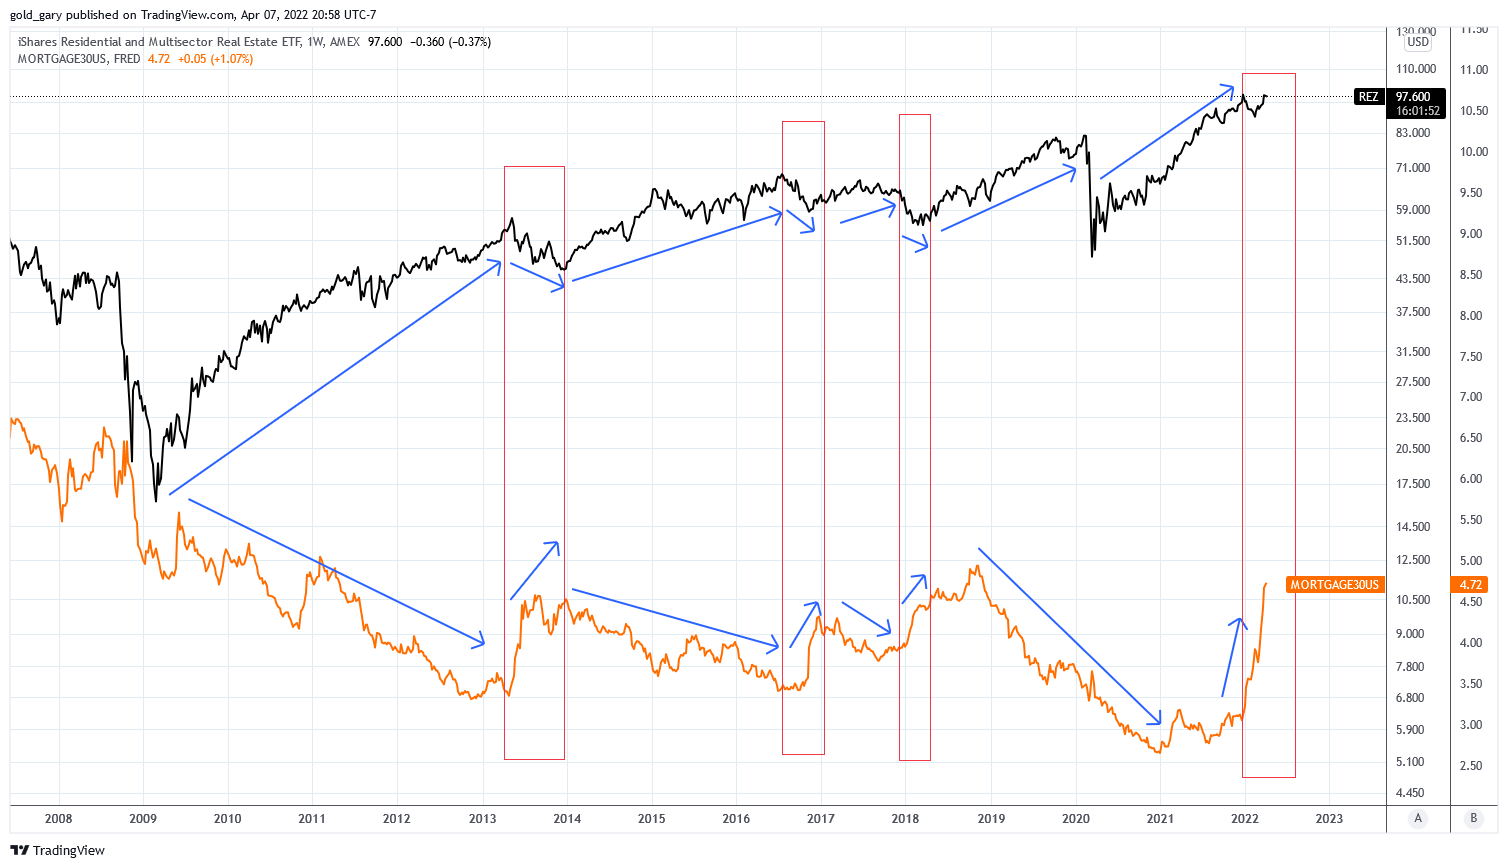
Rents have been climbing steadily with YoY increases of 9.3% and 9.0% in Q3 and Q4 of 2021. Notably, Q4 experienced slower growth, the first in over a year. And most of the increases are in new leases where rent increases are nearly twice as much as lease renewals. It’s possible this condition is a function of high delinquency rates and suspended evictions, which we will discuss next. In fact, the single family rental market index has been declining for three consecutive quarters.
The Inflation Driver
Inflation has been a driver of both home prices and rent prices. The cost of home construction has risen dramatically while investors have sought out inflation protection from residential real estate assets. Home affordability worsened which put pressure on rents. Home buyers have cited rising rents as a top reason for buying a home and thus the momentum feeds on itself until something stops the merry-go-around. That thing is mortgage rates.
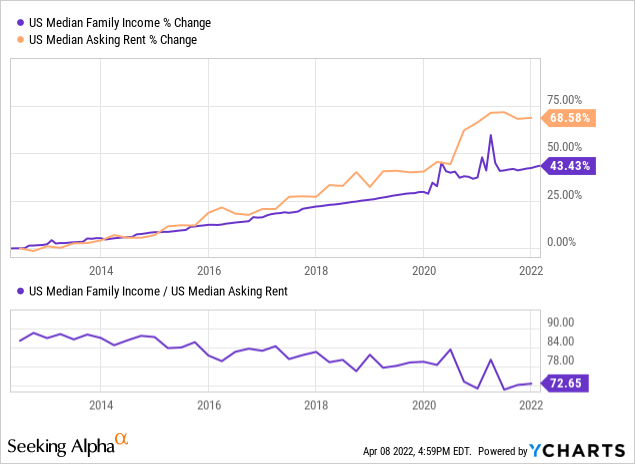
The problem is that there is a limit to which consumers can pay. Household incomes spiked up twice with the dispersal of stimulus checks. Since then incomes have moderated. This is while the median asking rent has climbed dramatically in the last two years. The ratio of median family income to median asking rent is near the lowest point since 2012, indicating that rents are expensive relative to incomes.
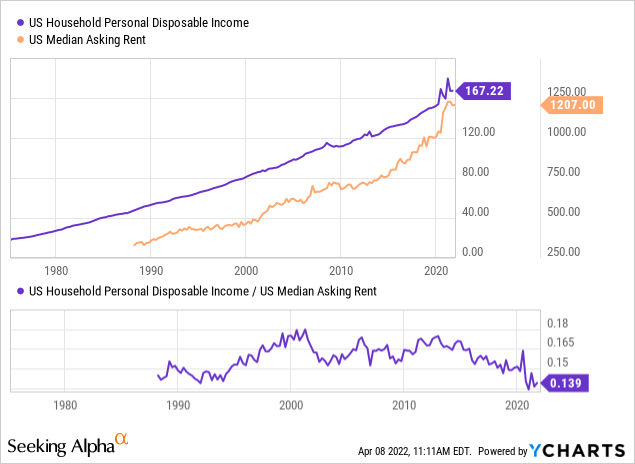
Affordability is similar when comparing household disposable income to rent which is the most expensive in three decades.
According to the NMHC the percentage of rents that are delinquent is at a three year high of 8%. Data from the Eviction Lab shows that eviction rates are rising in most U.S. cities. Eviction filings are piling up across the U.S. and the legal system will take months to sort it all out.
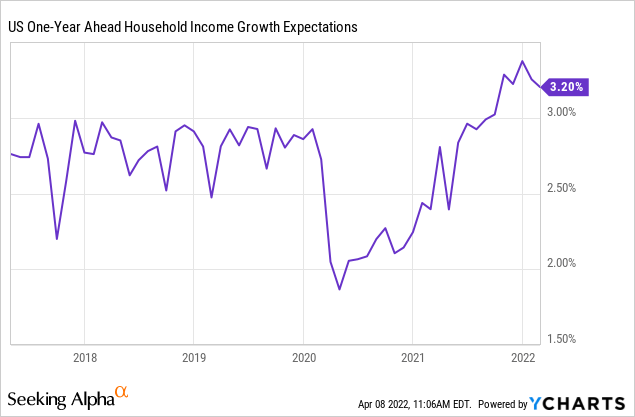
Aside from further government assistance, incomes are not expected to rise much in the future. Next year household income growth is expected to be 3.2%. This outlook does not consider the risk of recession in 2023, a condition that is being forecasted by several yield curves and economic growth indicators.
Without wage inflation or further government stimulus it appears that inflation is beginning to moderate. For example, we can observe that used car prices have declined over the past couple of months:
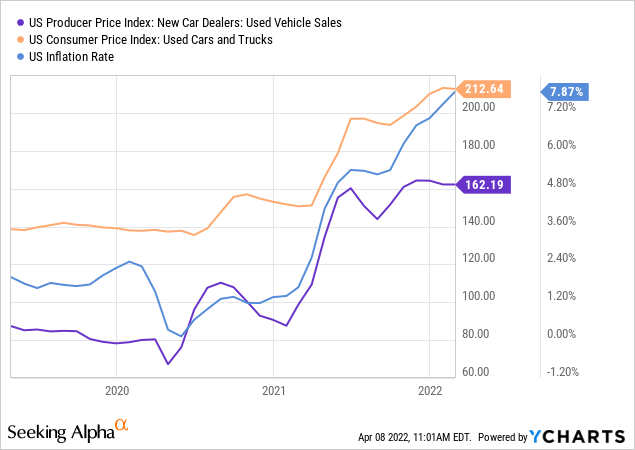
When compared to previous surges in inflation, this current surge is nearing the typical turning point. This would make sense as the Federal Reserve is now tightening policy, rising rates, and decreasing balance sheet assets. The rise in mortgage rates has all but ended cash out refinances which is a key source of cash for consumers.
The Daily Shot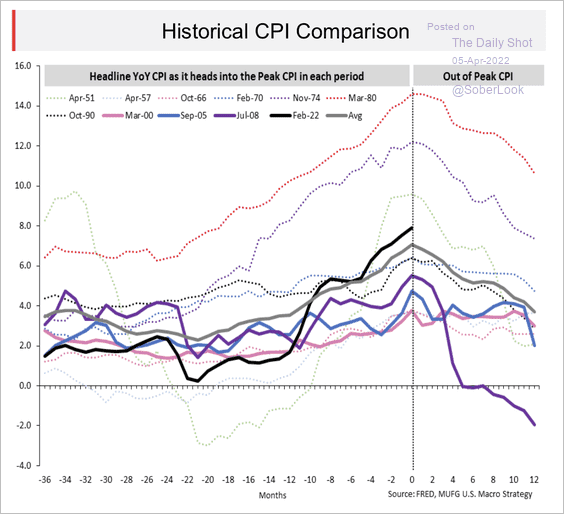
The chart below forecasts the expected U.S. Treasuries and Mortgage Backed Securities on the Fed balance sheet for 2022-23. Additionally, the credit impulse has declined sharply which is projecting much lower inflation rates in the immediate future.
The Daily Shot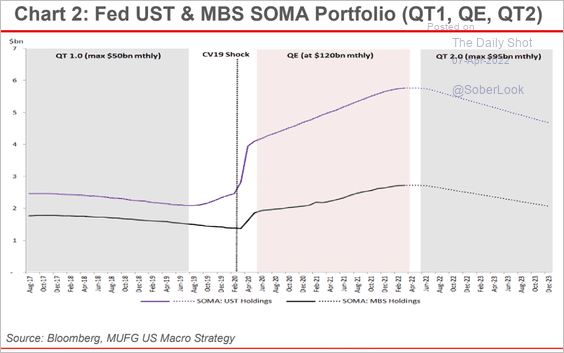
The chart below shows the ratios of median family income in the U.S. to the food CPI (black), gasoline CPI (orange), and rent CPI (blue). A low ratio is less affordable than a high ratio. The rent ratio is the lowest since 2000. Gasoline and food are the lowest since 2015. Goods inflation has been similar across the board, thus the relative cost of living is high for the average U.S. family. The change in affordability is similar to that of 2007-08. From 2008 to 2010 the CPI rent price index rose 1.5% CAGR.
TradingView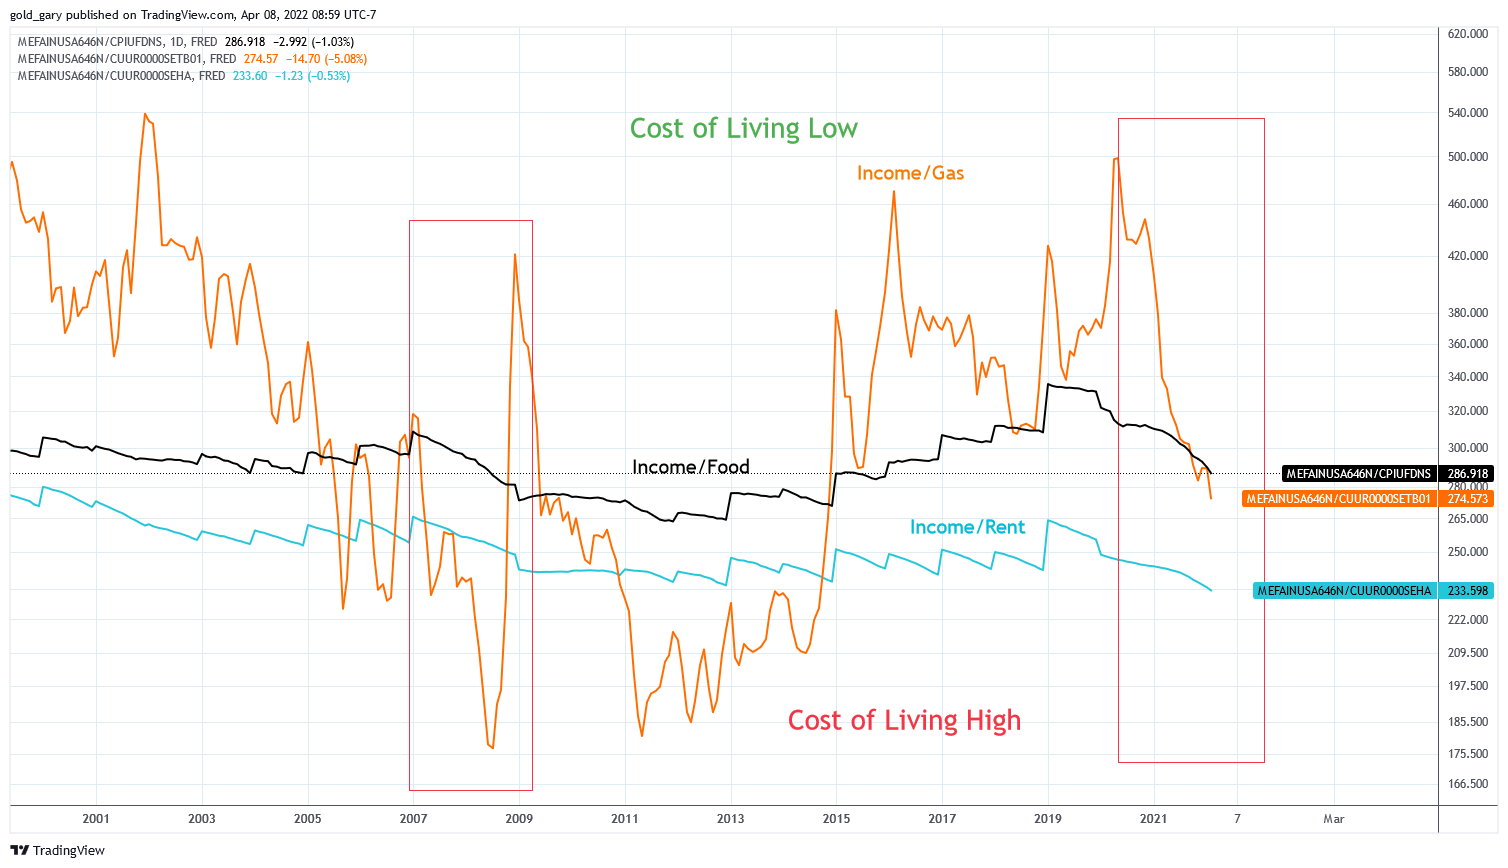
This increase in cost of living is causing a significant expansion in consumer credit. The cost of trucking freight hit a peak and continues to decline, which is a sign of decreased economic activity. Given these macroeconomic conditions I expect slow economic growth moving forward which results in low wage growth. U.S. households are already under pressure from rising costs and cannot sustain much higher rents.
Over-hyped and Overvalued
Residential REITs are very popular right now as an attractive inflation hedge in a hot market that has been surging higher since 2020. I appreciate residential real estate, it is one of my preferred assets when fairly valued. But the market has reached a level where the risk-reward is no longer favorable.
There are over 1.5 million houses under construction in the U.S. which is more than the peak of construction in 2006 at 1.4 million. Of which, 389,000 are already sold. There are many people living in homes or rentals waiting for these new houses to be constructed so they can move in. When they do, most of their current homes will become rentals or be sold.
With increasing population growth the house construction may not be significant. However, working age population growth in the U.S. has been slowing since 2006 and has been negative since 2019. The divergence between growth and construction is leading to overbuilding.
FRED Data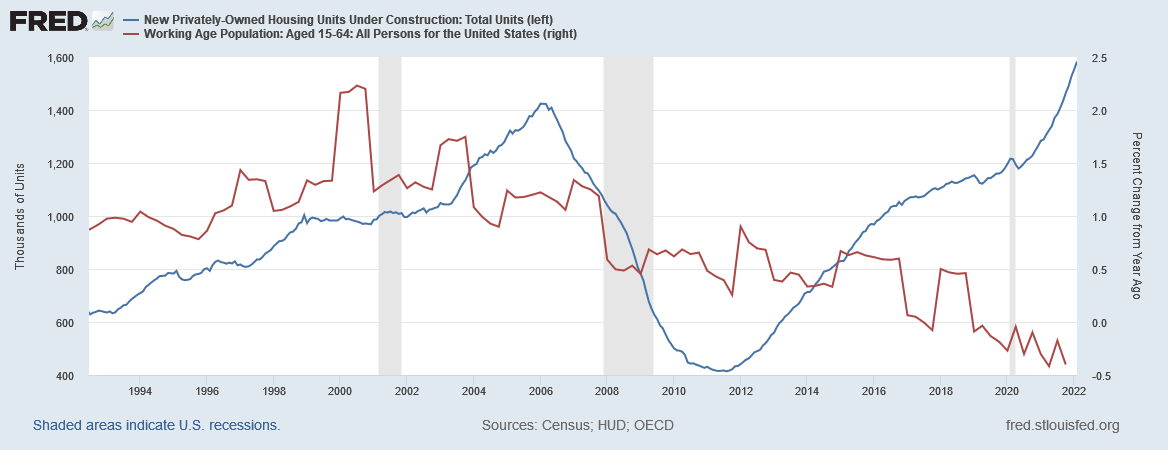
I do not expect rents to continue rising at the current pace due to limited income and incoming housing inventory. I expect rent price growth to slow to 2-4% over the coming 12-24 months before continuing higher.
The issue is that residential REITs are not priced for that level of growth. The chart below contains the current price to FFO multiple of each holding in REZ compared to the normal price to FFO multiple for that equity. We can see that the majority of holdings are well above their normal multiple, including all of the residential REITs. Healthcare REITs constitute 26% of the fund and are mostly fair-priced. The average P/FFO for the fund is 28.8x compared to an average normal P/FFO of 19.0x. This represents a current overvaluation of 33-34%.
Chart by author (data from FAST Graphs)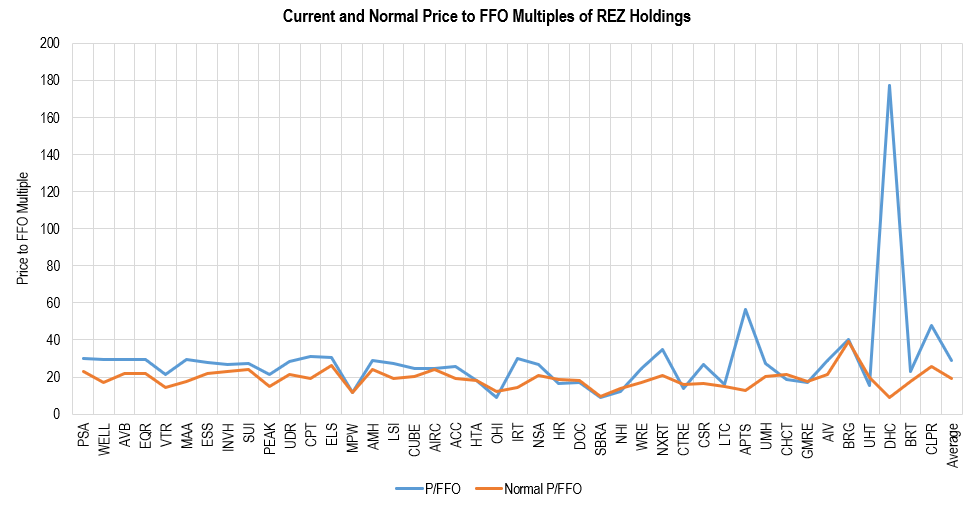
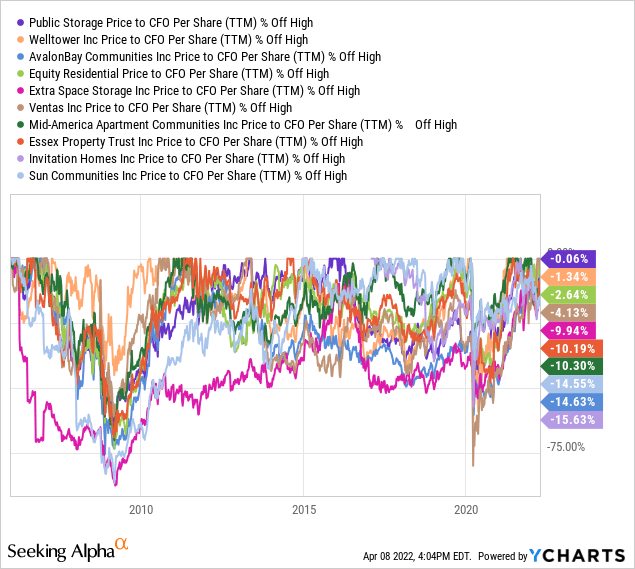
The top ten holdings of the fund constitute 58.6% of total holdings. Of these, four are within 5% of their 16-year high in price to cash from operations multiple. All ten are within 16% percent of their 16-year high in P/CFO multiples. As a group, the multiple is the highest since 2006.
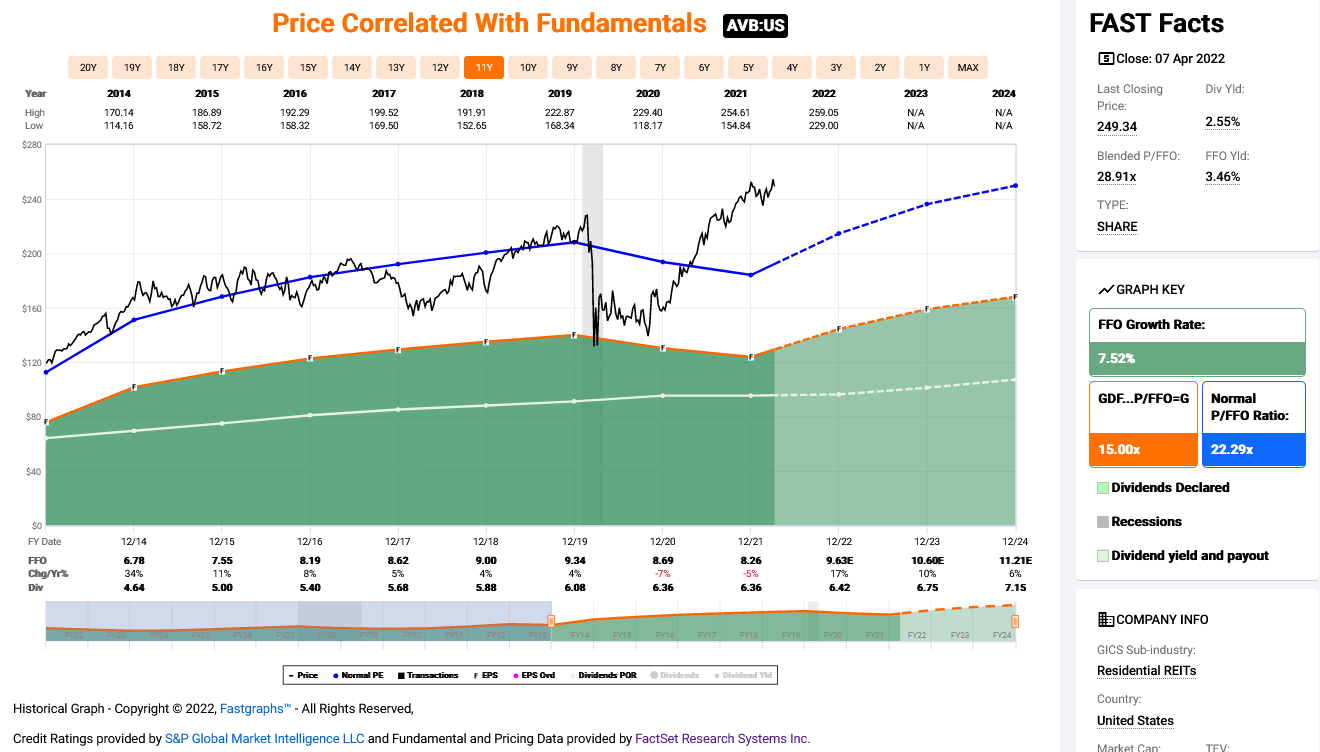
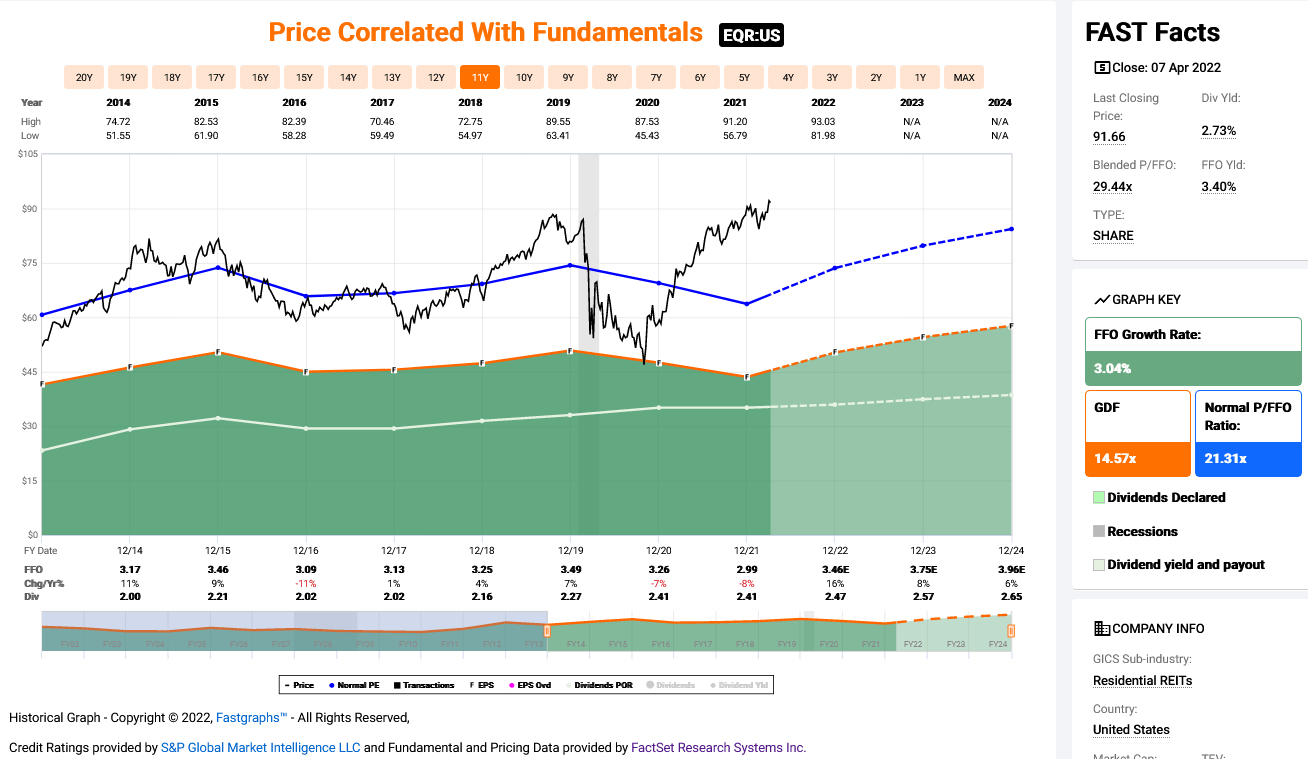
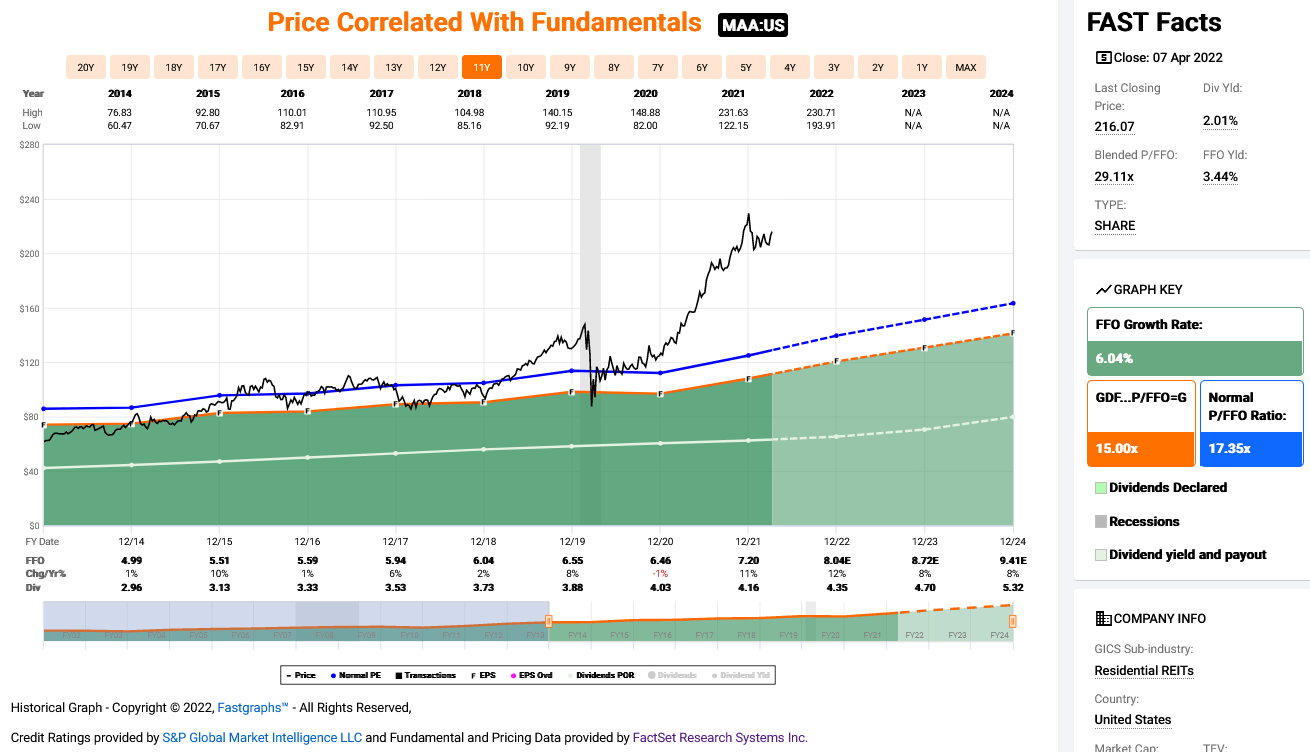
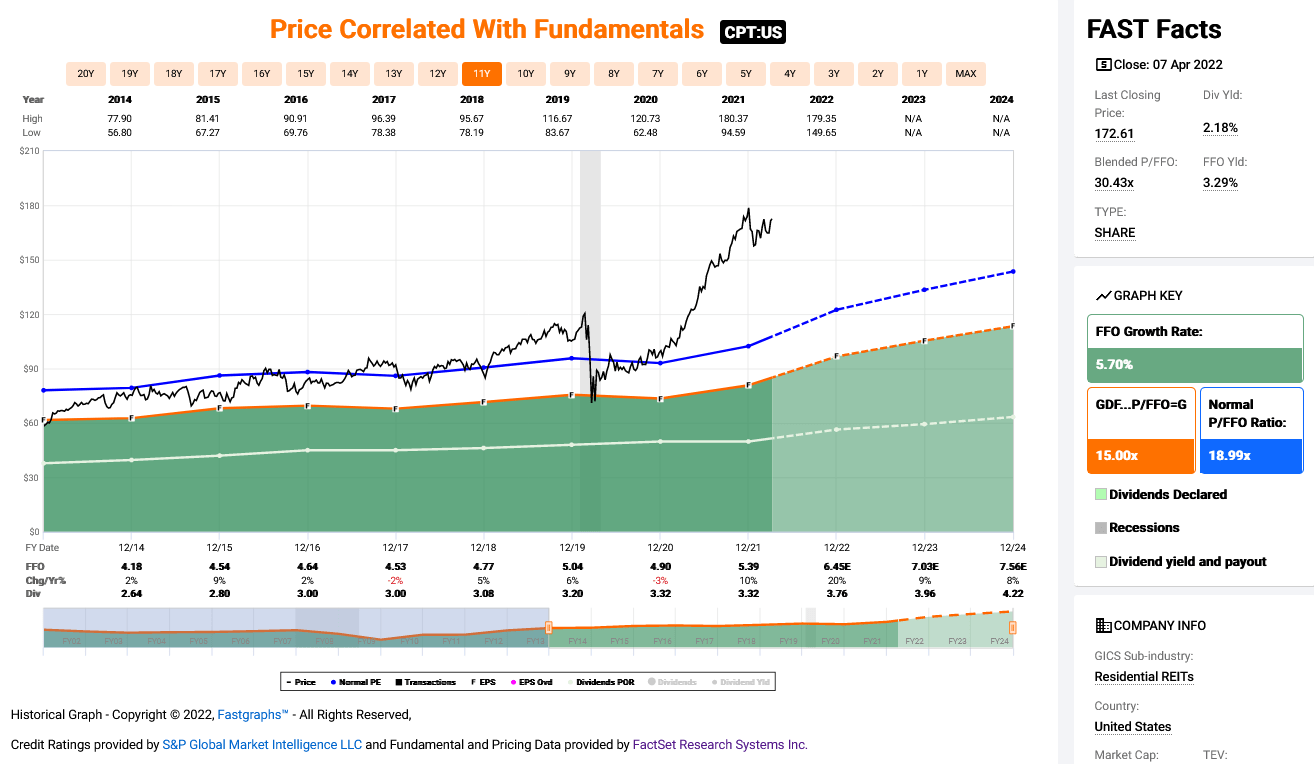
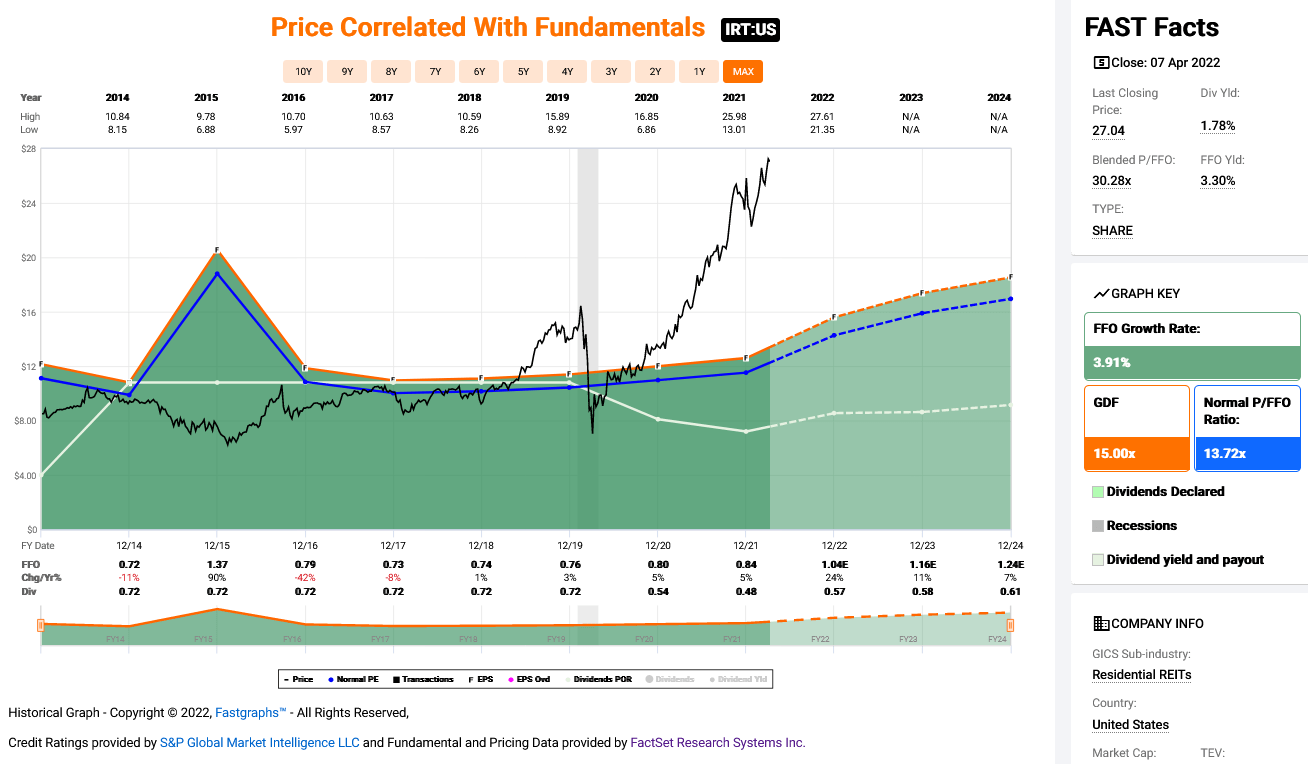
CPT and AVB have both recently issued new stock. These actions suggest that management might also perceive their stock price as overvalued. Below is a series of FAST Graph charts for many of the top residential REIT holdings in the fund, with the exception of Public Storage (PSA) which is the top holding. Note how high current valuations are even when compared to generous growth estimates that I believe are unlikely to be achieved.
FAST Graphs FAST Graphs FAST Graphs FAST Graphs FAST Graphs FAST Graphs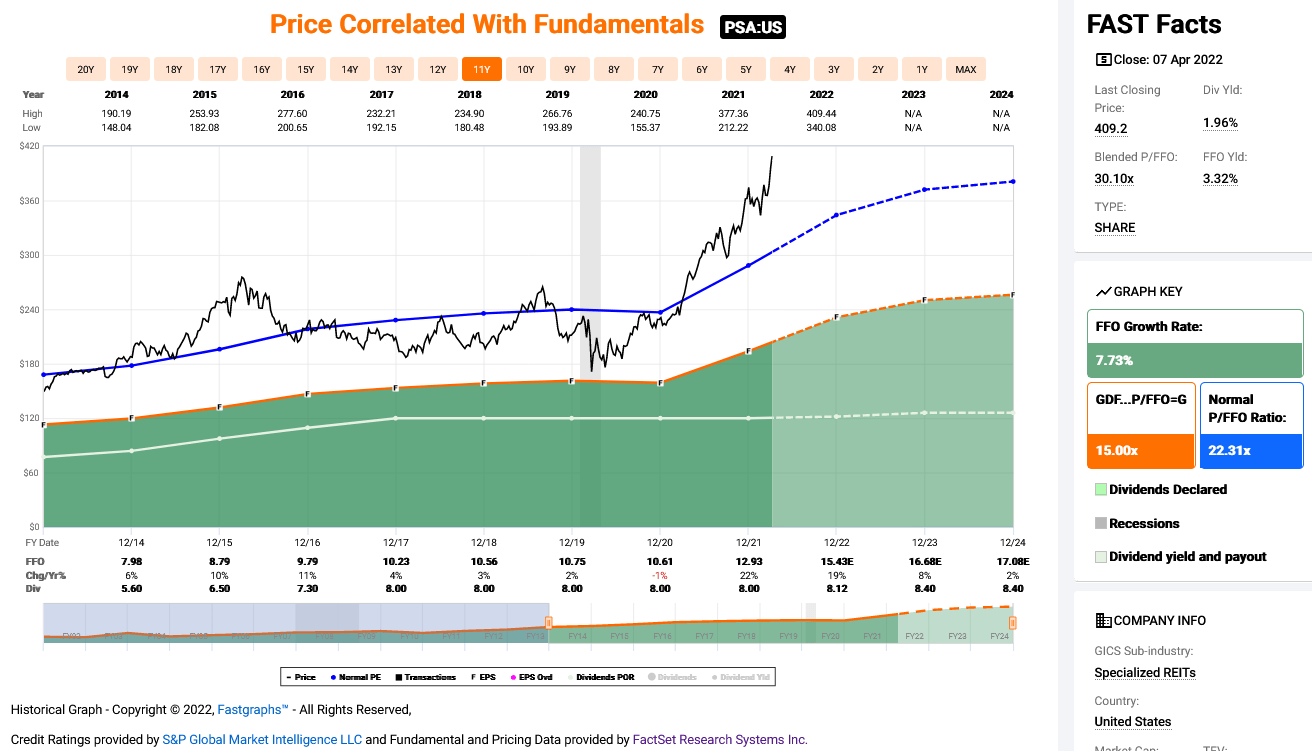
Summary
The housing market is losing momentum. Rent price growth will moderate with slower home price growth, slower inflation, and higher inventory. The rise in mortgage rates in combination with weakness in other sectors, such as homebuilding, are forecasting weakness in the residential REIT space. Even if rents were to continue growing at 5% CAGR the equities are still overvalued. Rising rates will encourage multiple compression.
I have decided to close my long position in REZ and open short positions using puts. Below is an analysis of October 21, 2022 puts on REZ. I would prefer longer dated puts but these are the longest available right now. When the next expiration becomes available I will roll out my puts. Using an equation to evaluate the attractiveness of each put I have identified the 110.0 strike as the most attractive. I have bought to open 110 strike puts and will look to add on weakness between the strike prices of 100 and 115.
Chart by author (data from TD Ameritrade)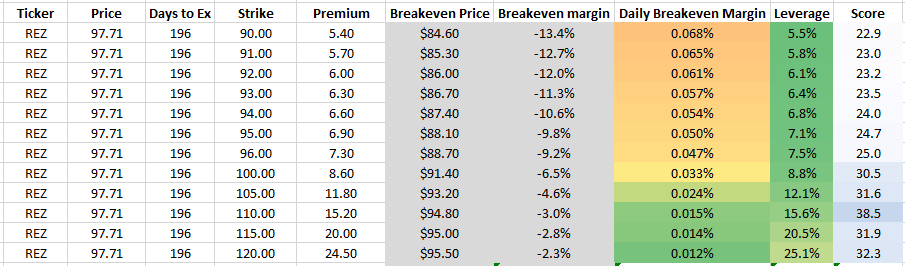
I expect this trade could take many months to develop. I plan to continue the trade into 2023 until the thesis changes.
Be the first to comment