

Kameleon007
Before we get into why treasury 2-year vs 10-year yields are likely headed lower and the spread higher, let’s look at what that relationship usually looks like. Generally, 10-year yields will be higher than 2-year yields, at least most of the time. The chart below shows the 10-year and 2-year treasury yields. We can see at a glance that the positive relationship holds for most of the time.
TradingView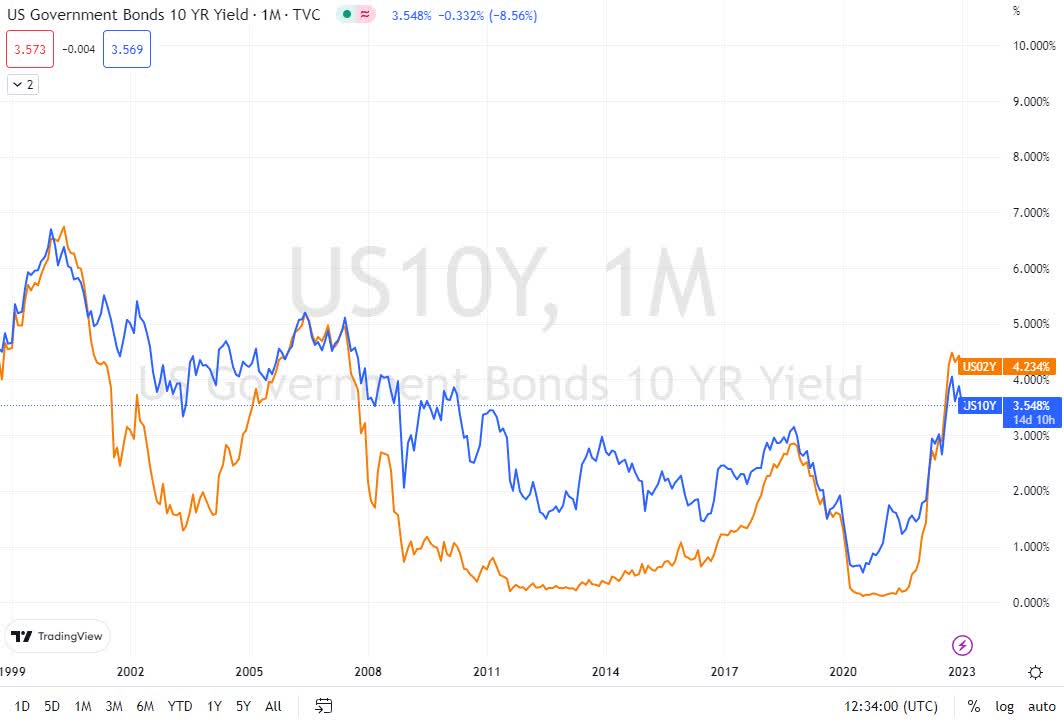
There are mainly a couple of reasons why investors will demand a higher yield on a longer-maturity bond. I mention them as they underlie what my presumptions about forwards yields are based on. Investors typically want a higher yield for bonds that expire at a later maturity to compensate for the longer investment horizon.
This is often attributed to having higher credit risk. I don’t believe that is the case, as the Fed can print as much money as it wants and use it to buy government bonds. We have seen this in the recent past. However, there most likely is a premium that investors want for a longer maturity.
But it’s probably more the second reason that influences the higher yield for longer-maturity bonds. That’s the risk of seeing interest rates increase at some point during the bond’s lifetime. The longer the lifetime of the bond, the more it’s susceptible at some point to increasing interest rates.
While shorter maturity bonds are only susceptible to the immediate Fed monetary policy as they have a relatively short lifetime, this aspect makes short-term yields move quickly as investors sense a change in interest rates.
10-year yields will also anticipate Fed monetary policy; however, 2-year yields will move faster, as they are affected more by short-term changes in interest rates.
The chart below shows the weekly yields for 2-year and 10-year treasuries as well as the Fed Fund rate. The black rectangle indicates the preceding months to a change in Fed policy. The right-hand side marks the week that Fed Fund rates started falling, July 8, 2019.
However, treasury yields had been falling since they peaked on November 8, 2018. Treasury yields started declining just before the Fed peaked its monetary tightening and continued falling while Fed Funds remained flat for several months.
TradingView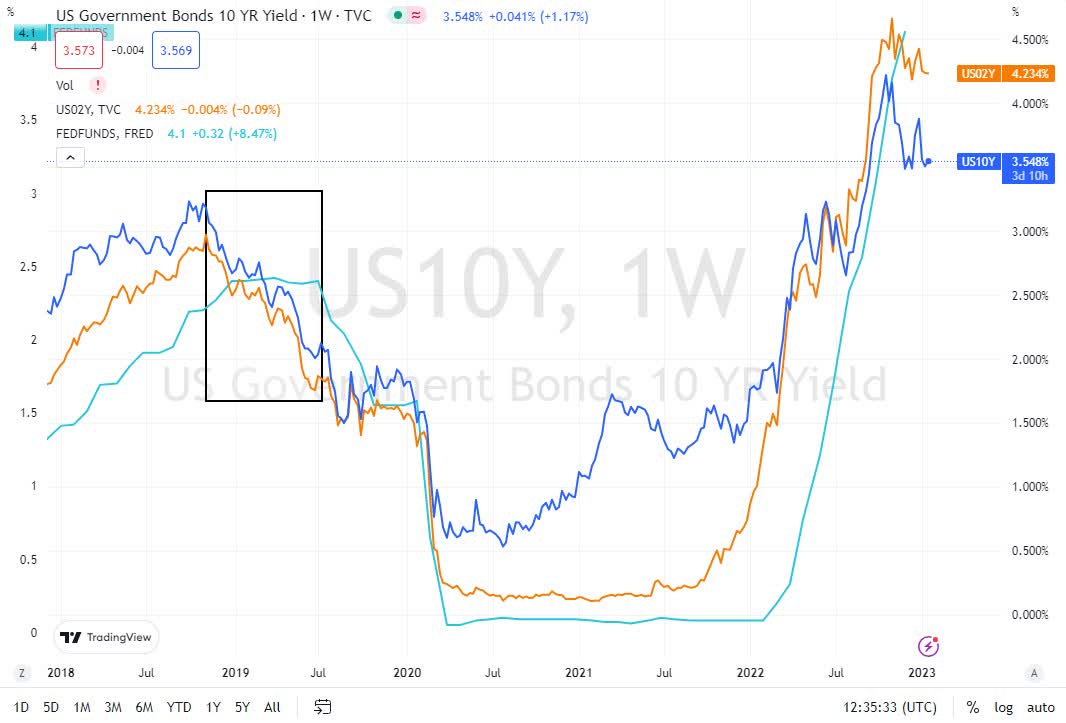
Expectations push all markets and bonds are no exception. The chart above shows how treasury yields are experiencing lower highs and lows since late October 2022. Whereas Fed Funds still haven’t peaked and are expected to rise at least to the 4.75%/5% target range.
However, just as in 2018, the treasury market may be anticipating the Fed, and yields may continue declining. As an indicator of how the Fed is likely to act, we can look at the Fed Fund futures market. The CME’s Fed watch Tool.
CME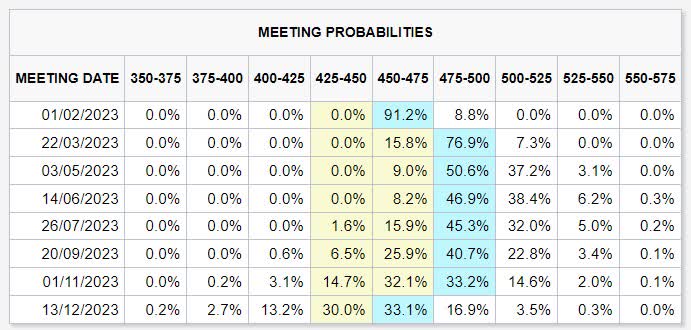
From the above table we can see that the market sees a very high chance, 91.2%, of another hike of the target rate to 4.50%/4.75% for the February meeting. The expectations then show a high likelihood of the Fed keeping that target or lower towards H2.
A cut in the target rate of 25 or 50 bps is then the most likely scenario for the December 2023 FOMC meeting. The timing of the decreasing treasury yields seems to mimic previous turning points, especially the latest we saw in 2018/2019.
As the Fed gets closer to reaching a plateau for its target rate, I expect treasury yields to continue falling. Once the Fed pivots, or indicates a pivot, I would expect yields to fall further. As the 2-year yield is usually below the 10-year yield I would expect the current spread to turn positive again.
As of writing, the spread between 2-year and 10-year notes is negative 0.686% (10-year minus 2-year yields). I would see that gap closing and eventually turning positive once the yield curve adjusts to discount falling inflation and monetary policy.
Spread Past Performance
Exactly how far that spread widens will depend on many factors, but historically we are at a level that doesn’t last very long. Once the monetary policy turns dovish again, the 2-year/10-year spread is bound to turn positive again.
St. Louis Fed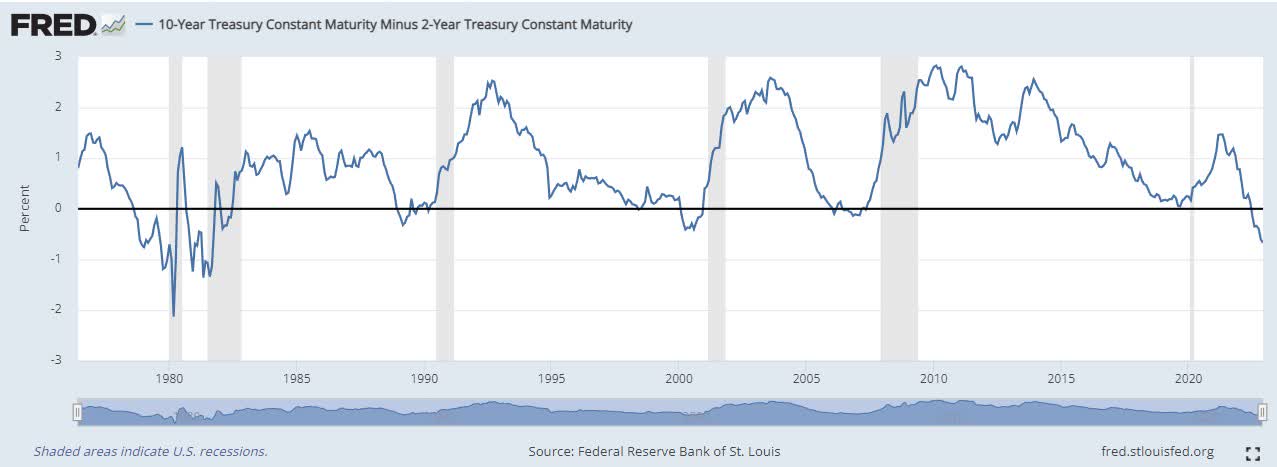
The chart above shows the spread between the 2-year and 10-year treasuries. We can see how the dips into negative territory are short-lived and are followed by corrections that bring the differential back up.
I haven’t run statistics on the average spread or the standard deviation, but we can see visually how this spread spends most of its time in positive territory.
Inflation Expectations
A lot depends on inflation expectations as to where yields are heading. And that is what the Fed is looking at closely also. We could say that the treasury yields will act as the Fed implements its policy. However, treasury markets, as mentioned, are forward-looking.
This means that they will react more closely to inflation data and expectations. Then the Fed will have time to catch up. Or at least that’s how I explain the dynamics.
Tradingeconomics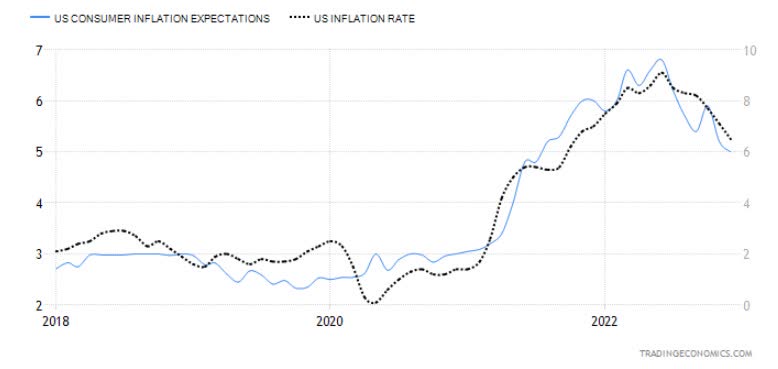
Actionable Example
A view of declining yield is easy to take action on, you simply pick a maturity and buy the bond. Falling inflation and Fed action will eventually send prices higher. However, if you want to get an axe in the 2-year/10-year spread, you need to take into consideration a couple of things.
-
Not all bond prices react the same for a 0.01% change in yield. What I mean is a 10-year note will change in price considerably more than a 2-year note. This concept is known as dollar value per 01 (DV01). Or the change in price in dollar terms for a change of 0.01% in yield.
-
Due to the above, if you want to take a position long spread. That’s long 2-year notes, and short 10-year notes. You will need to calculate the DV01 of each bond and then use the ratio to determine the size of your position for each maturity.
CME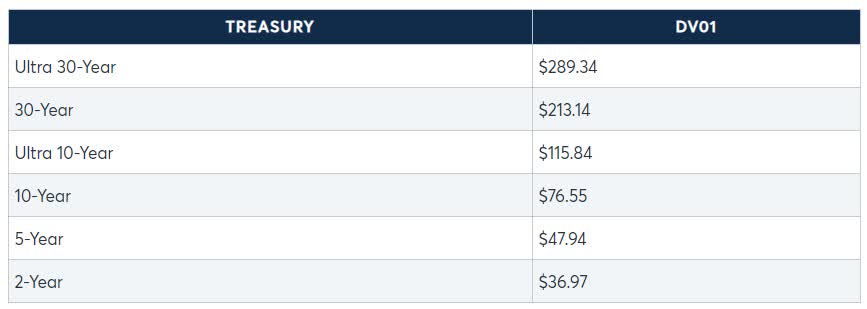
The table above shows examples of DV01 values for a variety of maturities for treasury futures. Each contract is per $100,000 of nominal value, except the 2-year which is $200,000. Each cash bond may have a different DV01 as many factors come into play such as days till maturity and coupon.
You can check with your broker, or if you are looking at futures you can check the CME website.
Although the example above is for futures contracts, the process is the same for cash bonds. Let’s say you want to buy the CTD 2-year note and sell the CTD 10-year note. The DV01s are $18.45 and $76.55 respectively.
Then for every $100,000 of 10-year notes you sell, you will need to buy a greater quantity of 2-year notes. If not, you will be exposed to the direction of the interest rates and yields, and not just the spread between the two maturities.
The amount of dollars of 2-year bonds is calculated by dividing the DV01 10-years by the DV01 2-years and multiplying by the 10-year amount which is $100,000. This gives 4.149 times $100,000 which equals $414,900.
Be the first to comment