

US Dollar (DXY) Price and Chart Analysis
- The US dollar weakens as rate expectations fade.
- Short-dated US Treasury yields offer a supportive backdrop.
Recommended by Nick Cawley
Get Your Free USD Forecast
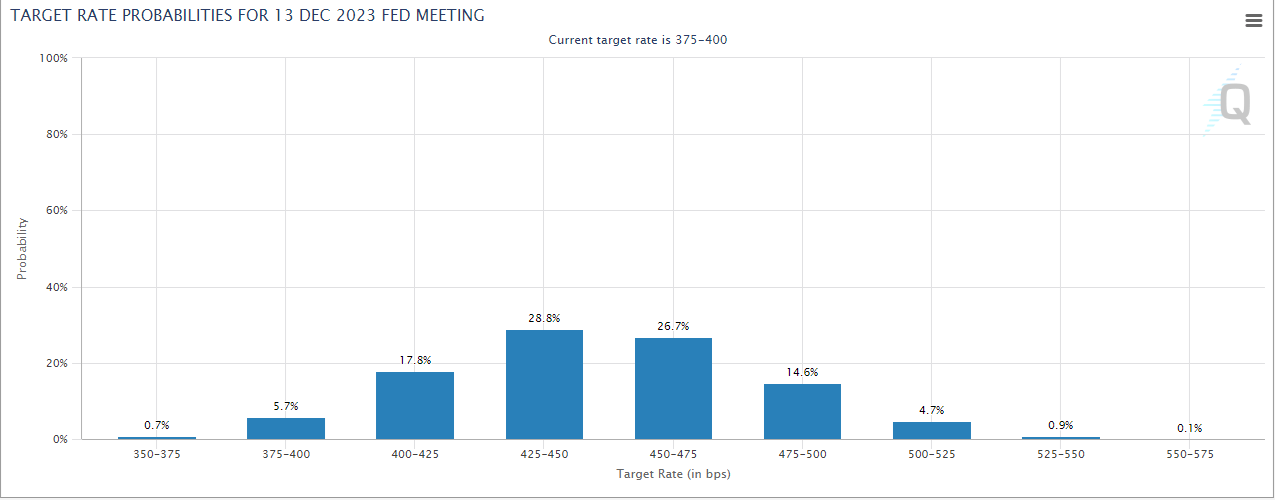
The Federal Reserve is expected to raise interest rates by another 100 basis points over the coming months, to 475-500bps, and then pause their tightening cycle, according to the latest 30-day Fed Fund futures pricing data. The Fed is expected to raise rates by half of this amount at the December 14 meeting with the remaining 50bps priced in for Q1 2023. The latest CME rate probabilities also show that the Fed may cut rates by 25 basis points at each of the last two meetings of 2023. The pulling back by the Fed from super-sized rate hikes – there have been 75bp rate hikes at the last four FOMC meetings – has left the US dollar vulnerable and this may continue going forward.
Chart via CME Group
For all market-moving data releases and economic events see the real-time DailyFX Calendar.
Recommended by Nick Cawley
Traits of Successful Traders
The short end of the US Treasury market remains reasonably well supported despite fading interest rate market expectations. The one-year UST offers a yield of 4.60%, while the two-year trades around 4.36%. These yields are unlikely to move appreciably lower in the coming weeks and will offer underlying support to the US dollar.
US Treasury Two-Year Yields – November 16, 2022
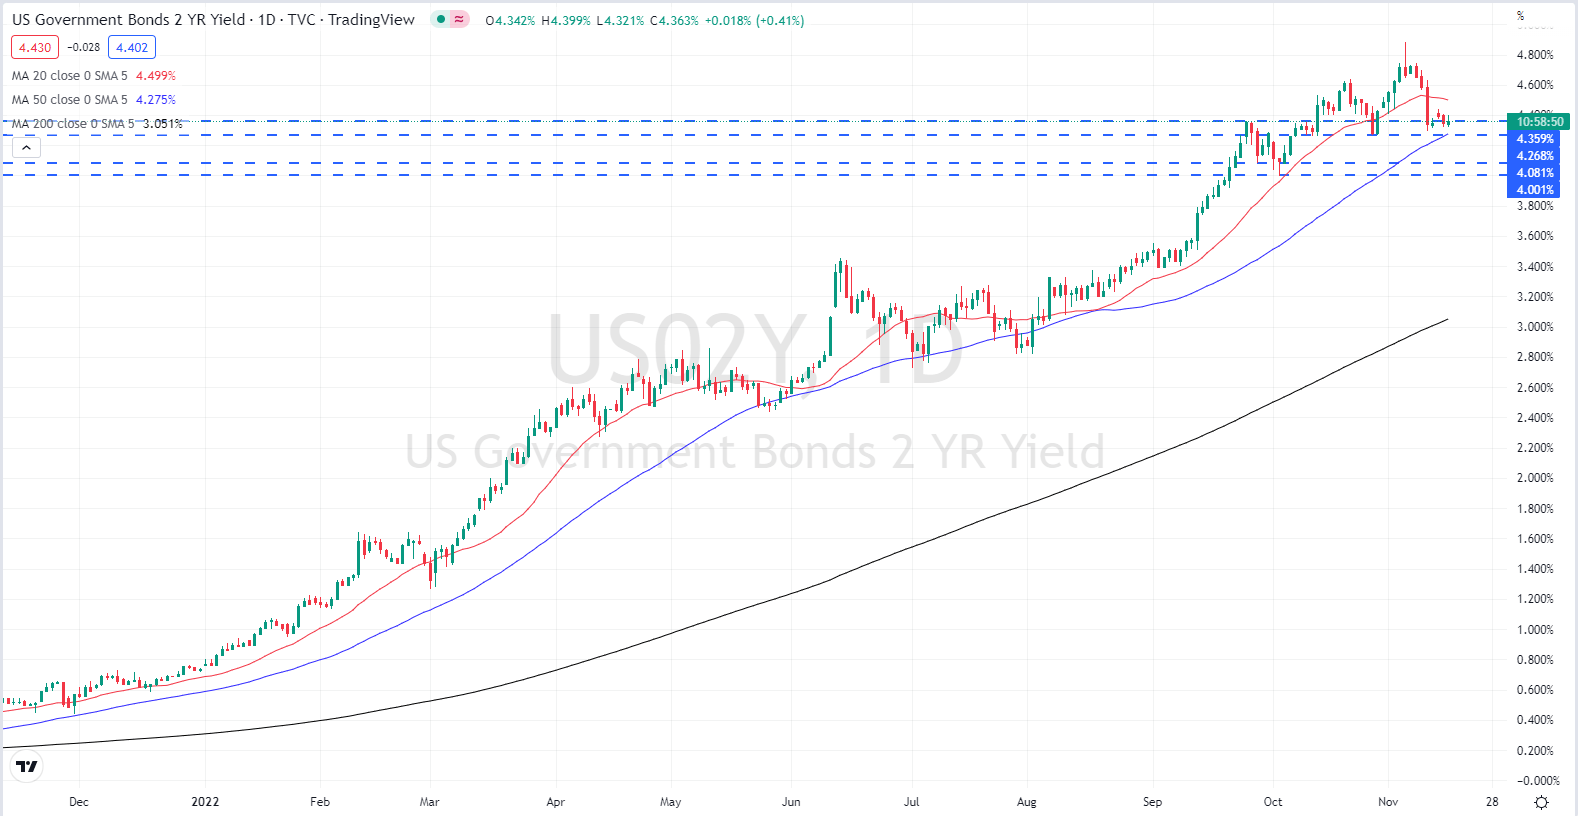
Chart via TradingView
This pairing back of rate hike expectations has weighed on the US dollar over the past weeks with the DXY falling by over 6% this month on a high-to-low basis. A prior zone of support was broken convincingly on November 10 and this level – 109.31 – now turns to resistance. The next area of support for the dollar is between 104.68 and 105.78 consisting of a cluster of prior highs and lows with the 200-day simple moving average in the middle at 105.00. This longer-dated sma has provided support for the greenback since June 2021.
A Complete Guide to Moving Averages and How to Use Them
US Dollar Currency Index Daily Price Chart – November 16, 2022
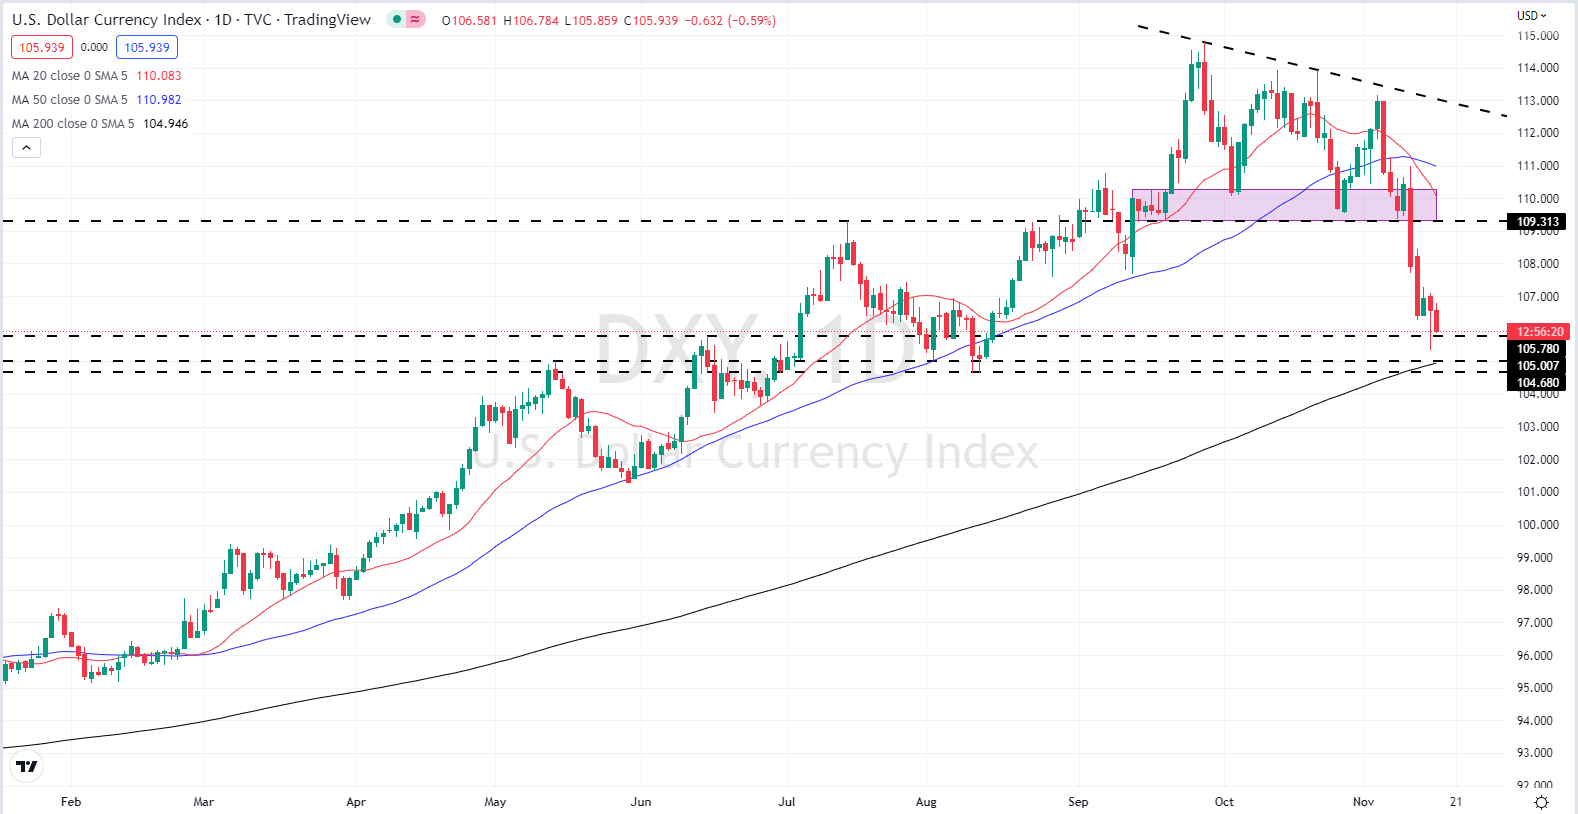
Chart via TradingView
What is your view on the US Dollar – bullish or bearish?? You can let us know via the form at the end of this piece or you can contact the author via Twitter @nickcawley1.
Be the first to comment