

carterdayne
Introduction
Citigroup is one of the USA’s most prominent commercial and retail bankers. Based on last year’s weak stock price performance, it is pretty muted at all levels. However, forward-looking estimates show conservative growth, meaning the stock price may underperform against all major US stock indices.
Fundamentals Indicate Tiny Growth
Growth
Citigroup‘s revenue growth was pretty weak in the last five years, including a negative result from the previous year. Net income growth was negative in 2017, followed by the strongest year in 2018. This net income growth is all over the map showing no solid trend for Citigroup.
|
Metric |
2017 (%) |
2018 (%) |
2019 (%) |
2020 (%) |
2021 (%) |
|
Period |
FY |
FY |
FY |
FY |
FY |
|
Revenue growth |
0.024 |
0.018 |
0.014 |
0.006 |
-0.048 |
|
Gross profit growth |
0 |
0 |
0 |
0 |
0 |
|
Ebit Growth |
0 |
0 |
0 |
0 |
0 |
|
Operating income growth |
0 |
0 |
0 |
0 |
0 |
|
Net Income growth |
-1.456 |
3.654 |
0.075 |
-0.431 |
0.987 |
|
Eps Growth |
-1.445 |
4.148 |
0.192 |
-0.368 |
0.981 |
Source: Financial Modelling Prep
Data
One positive aspect is the recent simple moving average periods of 20 and 50 days which were positive versus the last 200 working days. Comparatively to other stocks in the same field, Citigroup appears to be an average performer for its sector. However, it is an underperformer compared to other companies with stronger momentum that impacts its stock price.
|
Metric |
Values |
|
SMA20 |
2.46% |
|
SMA50 |
6.51% |
|
SMA200 |
-4.85% |
Source: Finviz
Enterprise
As one can see, the highest stock price for Citigroup was set in 2017, while it declined even into last year. Moreover, market capitalization has been reduced in half as it has started to focus on more profitable divisions.
|
Metric |
2017 |
2018 |
2019 |
2020 |
2021 |
|
Symbol |
C |
C |
C |
C |
C |
|
Stock price |
78.620 |
64.220 |
77.430 |
57.990 |
64.690 |
|
Number of shares |
2.699 B |
2.493 B |
2.249 B |
2.086 B |
2.033 B |
|
Market capitalization |
212.156 B |
160.120 B |
174.156 B |
120.956 B |
131.515 B |
|
Enterprise value |
312.801 B |
236.360 B |
274.046 B |
112.541 B |
151.829 B |
Source: Financial Modelling Prep
Estimate
Forward guidance shows revenue to grow roughly 10% over the next three years. That is relatively weak or conservative compared to more prominent technology companies where net worth will increase. The dividend yield is expected to grow roughly 1%. Earning price per share may grow approximately 25% over the same time. Earnings Before Interest and Tax will increase by 29%. As you can imagine, this might not considerably impact the stock price over the next few years.
|
YEARLY ESTIMATES |
2022 |
2023 |
2024 |
2025 |
|
Revenue |
75,226 |
76,884 |
77,388 |
81,580 |
|
Dividend |
2.04 |
2.08 |
2.18 |
2.50 |
|
Dividend Yield (in %) |
4.23 % |
4.32 % |
4.51 % |
5.18 % |
|
EPS |
7.14 |
6.74 |
7.47 |
9.01 |
|
P/E Ratio |
6.76 |
7.16 |
6.46 |
5.36 |
|
EBIT |
24,596 |
23,471 |
24,525 |
31,850 |
|
EBITDA |
– |
– |
– |
– |
|
Net Profit |
14,280 |
13,334 |
14,180 |
17,274 |
|
Total Assets |
2,393,945 |
2,416,404 |
2,436,155 |
– |
Source: Business Insider
Technical Analysis Hints at Underperformance
Fibonacci
The stock price for Citigroup has fallen so much that it is below the 0.618 level, showing minimal momentum in the stock price. In terms of pricing, market entries will only be able to occur once it hits the 0.5 Fibonacci level, which is just below $60. Therefore, taking these entries is only recommended if there appears to be sufficient momentum in the stock price. In addition, the recent simple moving average returns show relative weakness in the stock price.
fibonacci c (custom platform)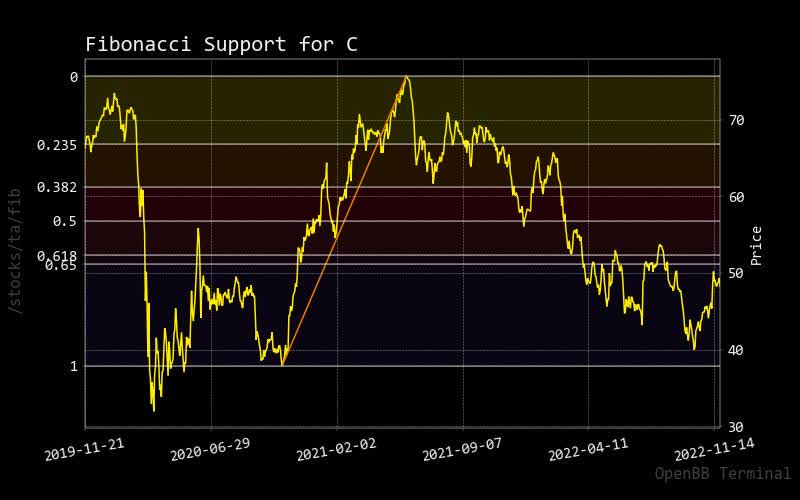
MACD
If one followed the direction of the current MACD signal line in the lower chart panel, one would think to take market entries on Citigroup stock. However, as said, relying on the Fibonacci levels is a reliable way to mark an entry point for market orders.
macd c (custom platform)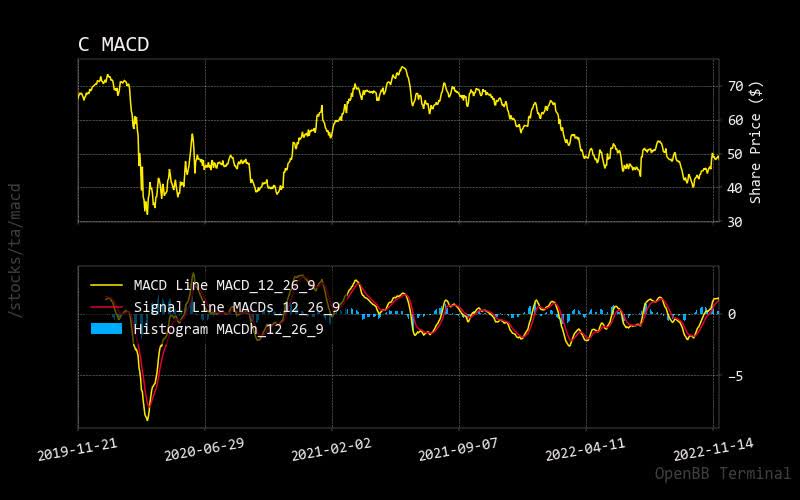
RSI
Surprisingly, Citigroup‘s stock price has already hit an overbought market condition in its RSI. This should tell investors to expect to pull back on this stock price. That said earlier, more than that might be needed for any momentum based on the recent weakness, simple moving average returns.
rsi c (custom platform)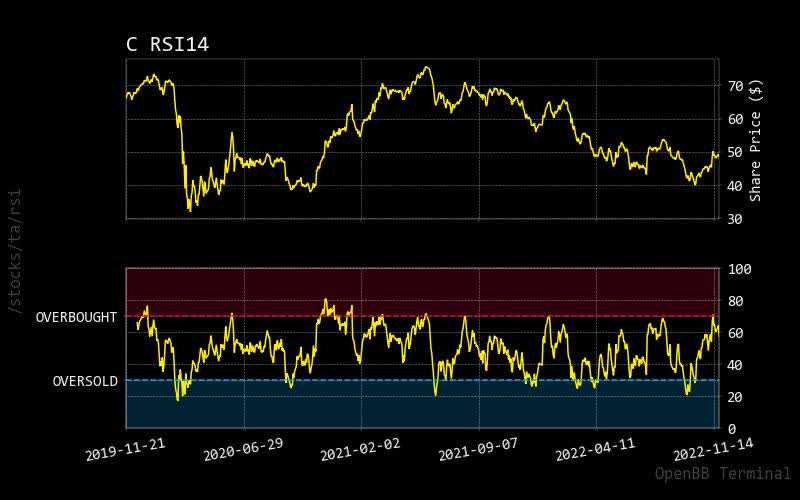
Monte Carlo
The Monte Carlo simulation shows higher predictive paths leading to upward momentum. This can also be confirmed in the normalized distribution chart, but a higher concentration of immediate price weakness is left of the last value in stock price.
monte carlo c (custom platform)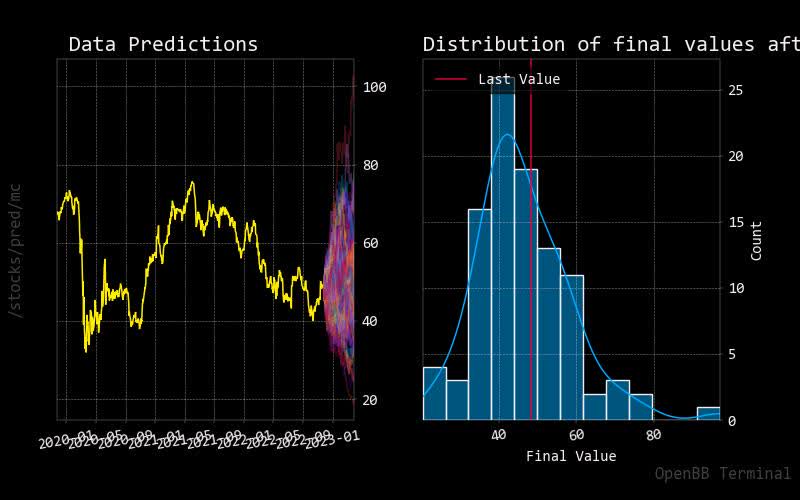
Regression
The red regression red line, a forecasted 30-day prediction, shows relatively no direction. This is more realistic based on the weakness of the stock price over the last year. It will remain positive and grow but at a slower pace as compared to other competitors in the banking sector.
regression c (custom platform)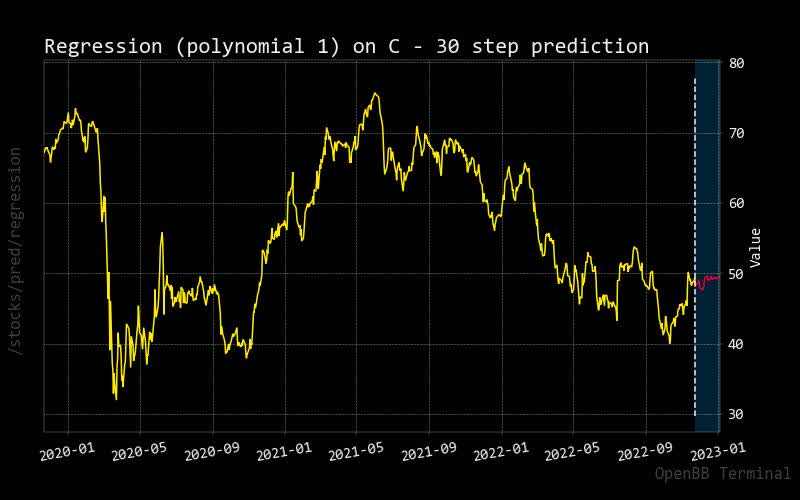
Neutral Risk is Subdued
Sustainability
According to this chart, the sustainability reading for Citigroup is only set at average with four controversies. This may be a concern for many activist pension funds as they like to focus on higher-rated companies. Therefore, this may be another factor that will hold back Citigroup‘s stock price.
|
Metric |
Value |
|
Social score |
13.11 |
|
Peer count |
172 |
|
Governance score |
11.82 |
|
Total esg |
26.68 |
|
Highest controversy |
4 |
|
ESG performance |
AVG_PERF |
|
Percentile |
50.69 |
|
Peer group |
Banks |
|
Environment score |
1.75 |
Source: Yahoo Finance
Recommendation
Despite any real direction set for Citigroup, I agree with the neutral rating from these other analysts. I think it will be long before there is any outperformance in this stock price as Citigroup appears to be a very conservative company.
|
Interval |
RECOMMENDATION |
BUY |
SELL |
NEUTRAL |
|
One month |
BUY |
12 |
4 |
10 |
|
One week |
NEUTRAL |
9 |
8 |
9 |
|
One day |
SELL |
3 |
13 |
10 |
Source: Trading View
Insider Activity
When you see other executives within Citigroup‘s upper management who sell their stock, this only confirms future stock price direction. It just signals back to the financial community that they’re taking profit from their stock options while they can. These likely hints that they expect an imminent drop in the stock price.
|
Date |
Shares Traded |
Shares Held |
Price |
Type |
Option |
Insider |
Trade |
|
2022-10-19 |
4,404.64 |
147,318.23 |
43.34 |
Sell |
No |
James Renee Jo |
-4404.64 |
|
2022-10-26 |
15,000.00 |
15,000.00 |
nan |
Buy |
No |
James Renee Jo |
15000.0 |
|
2022-10-26 |
15,000.00 |
123,987.65 |
nan |
Sell |
No |
HENNES DUNCAN P |
-15000.0 |
|
2022-11-19 |
11,617.99 |
310,881.40 |
48.66 |
Sell |
No |
HENNES DUNCAN P |
-11617.99 |
Source: Business Insider
Conclusion
Citigroup is a reasonably conservative bank with a tight-range bound forecast set of estimates. This company will have little growth over the next three years, so don’t expect a significant boost in its stock price. Additionally, the dividend appears to be underperforming relative to other value-based companies. They continue to show some growth over their stock price but will underperform the general market. As a result, it might be wise to set this company’s stock price outlook to hold.
Be the first to comment