

Introduction
For the past two years, I have been warning investors about the dangers of overvalued, high-quality stocks and sharing a long-only rotational strategy to help mitigate the dangers of these highly-priced stocks. The basic idea is that when the expected 10-year forward returns of the target stocks (in this case Starbucks (NASDAQ:SBUX)) get low enough, one rotates out of the stock and into a pair of ETFs with the goal that the ETFs will be more defensive during a downturn. Then, when the price of the target stock falls more than the defensive ETFs, the investor who likes the target company can rotate back in and own more shares than they would have had if they just held the stock the entire time.
In my September 13th, 2019 article, “Starbucks: A 10-Year, Full-Cycle Analysis”, I made the case that Starbucks was a Sell. At the time, my two standard alternative “default ETFs” were the Invesco S&P 500 Low Volatility ETF (SPLV) and Invesco Equal-Weight S&P 500 ETF (RSP). I tracked the results of my strategy (along with what would eventually become 42 other stocks I suggested selling due to high valuation this past year). The goal was to rotate half the funds back into Starbucks once one could achieve a 20-25% “free share gain” and to rotate the other half of the funds back into Starbucks once the stock was trading at fair value again. (For me, fair value, in this case, was an expected 10-year CAGR of 8%).
In this article, I’m going to examine whether it is time for investors who were bullish on Starbucks’ long-term prospects who rotated out of Starbucks back in September to now rotate back in.
Rotational Returns
Normally, this is a fairly simple process of checking the results of the default ETF versus the target stock, but we had a rare event take place at the end of February where it became clear we were headed for a recession. When that happens, we move all of our “default ETF money” into cash. I meticulously documented that in my last update article, “Going To Cash: Rotational Strategy Update (February 2020)”. The way I’m tracking the results now that the money has been moved to cash is to calculate the returns on a theoretical $10,000 up to the point it was moved to cash, and then to compare that cash amount (which does not grow when it is held in cash) to the theoretical growth of $10,000 kept in the target stock.
In this case, when the money from SPLV and RSP was moved to cash, it would have been worth $9,463, so it would have lost money (about -5%) over the holding period. But the primary goal of this strategy was to increase our shares in Starbucks for free, so let’s see what Starbucks would have returned.
 Data by YCharts
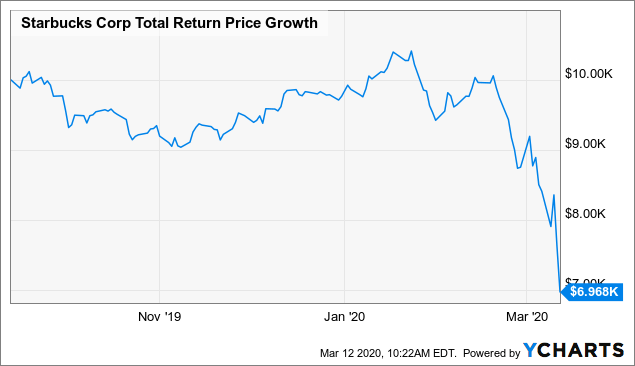 Data by YCharts
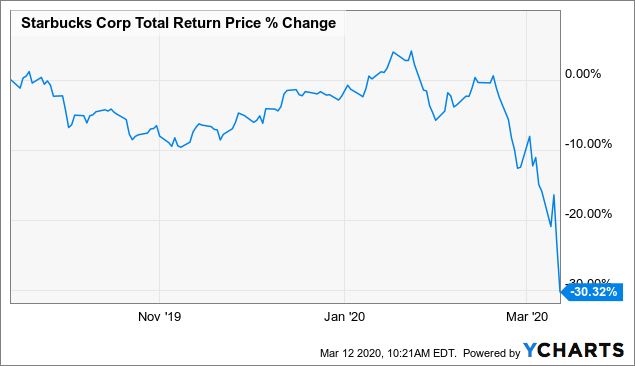
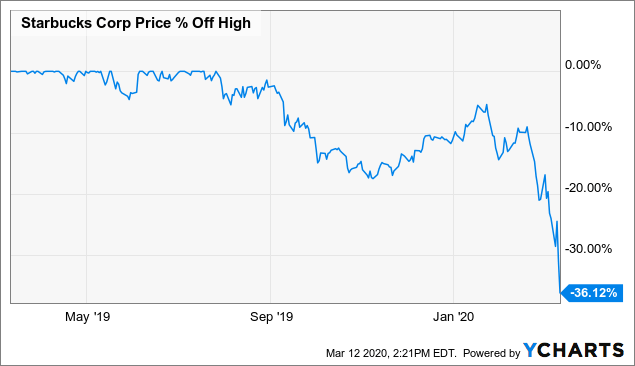
Starbucks stock has fallen about -30% since my warning article and a $10,000 investment would now be worth $6,968. The money that was first put in SPLV and RSP, then into cash, would now be worth $9,463. An investor who followed this strategy could now take that $9,463 and buy +35.81% more Starbucks stock than they owned back in September. In other words, an investor who owned 100 shares of Starbucks stock on September 13th, 2019, could now buy 135 shares of the stock without spending any more money. This exceeds our 20-25% “free share gain” goal for the first part of the strategy, and so this part of the rotation is now complete.
Starbucks now joins six previous “free share gain” winners in the series so far.
What about the second half of the money?
We are using what I describe as a “simple mixed strategy” as a way to demonstrate my overall rotational approach. You can read about the strategy in these three articles: Part 1 “Ignore Sentiment Cycles At Your Own Risk,” Part 2 “Mitigating Sentiment Cycles” and Part 3 “Sentiment Cycles: When To Sell And When To Buy Back Again.”
The first part of the approach was to rotate back in after a 20-25% “free share gain” was possible. The second half of the money is to be rotated back in when the forward 10-year full-cycle CAGR estimate is near fair value at about 8%. So, next, I’m going to run what I call a “Full Cycle Analysis”, which is the same analysis I performed back in September in order to see if Starbucks stock is now trading near fair value. As part of the analysis, I calculate what I consider to be the two main drivers of future total returns: Market Sentiment returns and Business returns.
In order to estimate what sort of returns we might expect over the next 10 years, let’s begin by examining what return we could expect 10 years from now if the P/E multiple were to revert to its mean from the previous economic cycle. I start the previous cycle around 2007, about a year before the last recession.
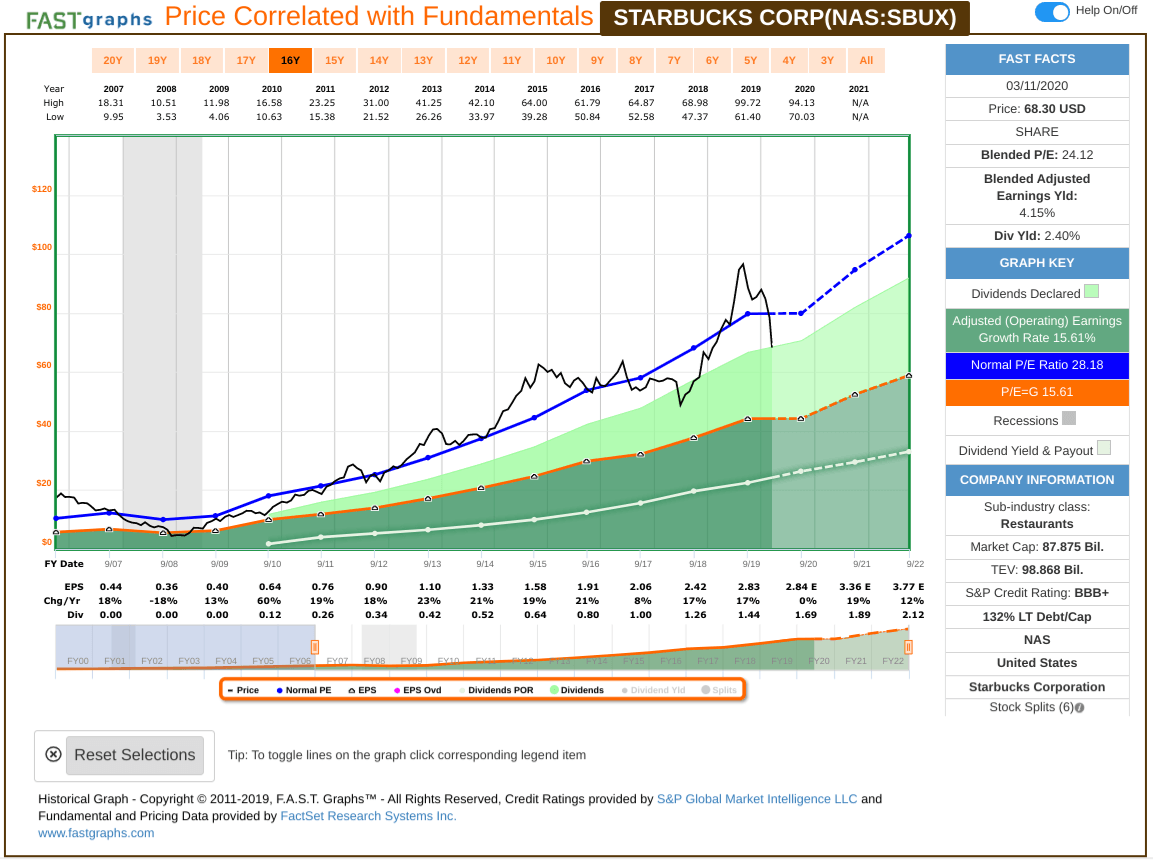
As I write this, Starbucks’ forward PE is 21.10 while its normal P/E this past cycle has been 28.18 (the F.A.S.T. Graphs above is a day behind on the current P/E). With most stocks, unless there is a dramatic change in their business over time, the P/E will fluctuate up and down around their long-term mean, which F.A.S.T. Graphs labels “normal” P/E in blue. If, over the course of the next 10 years, Starbucks’ P/E were to revert to its normal 28.11 level and everything else was held equal, it would produce a 10-year CAGR of about +2.94%. (At the time of my original analysis, this return was expected to be -1.54%.)
Current and Historical Earnings Patterns
We previously examined what would happen if market sentiment reverted to the mean. This is entirely determined by the mood of the market and is quite often disconnected, or only loosely connected, to the performance of the actual business. In this section, we will examine the actual earnings of the business. The goal here is simple: We want to know how much money we would earn (expressed in the form of a CAGR %) over the course of 10 years if we bought the business at today’s prices and kept all of the earnings for ourselves.
There are two main components of this: the first is the earnings yield, and the second is the rate at which the earnings can be expected to grow. Let’s start with the earnings yield.
 Data by YCharts
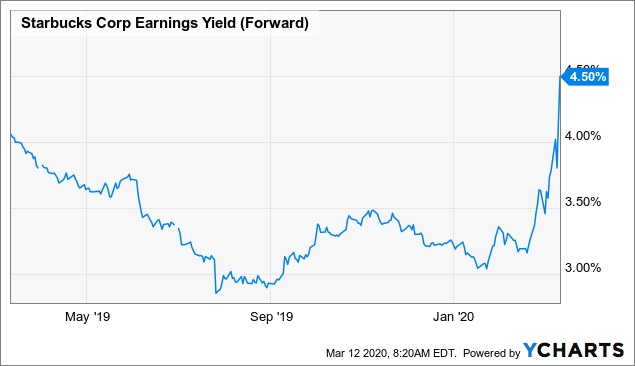
Starbucks’ forward earnings yield is currently +4.50%. The way I like to think about this is, if I bought the company’s whole business for $100, I would earn $4.50 per year on my investment if earnings remained the same for the next 10 years.
Business earnings do not typically stay the same every year, however. Sometimes earnings grow, sometimes they shrink, and sometimes they fluctuate both up and down. So, in order to estimate how much money the business might earn over 10 years, one needs to estimate how the annual earnings might change over that time period.
My approach for businesses whose earnings are not highly cyclical is to base my forward expectations on the earnings of at least one full previous economic cycle (so that at least one recession is included in the estimate). For businesses whose earnings are highly cyclical, earnings history is not very reliable, so I use the price history from at least two previous economic cycles for those highly cyclical stocks. Starbucks’ earnings are moderately cyclical but do not fluctuate enough for me to consider the earnings “highly cyclical.” For that reason, it is appropriate to use historical earnings and P/E ratios as a guide to future returns, so long as the fluctuations in earnings that do exist are taken into account.
Earnings Growth
Now we know what Starbucks is currently earning. The next step is to estimate its earnings growth during this time period. I do that by figuring out at what rate earnings grew during the last cycle and applying that rate to the next 10 years. This involves calculating the EPS growth rate since 2007, taking into account each year’s EPS growth or decline, and then backing out any share buybacks that occurred over that time period (because reducing shares will increase the EPS due to fewer shares).
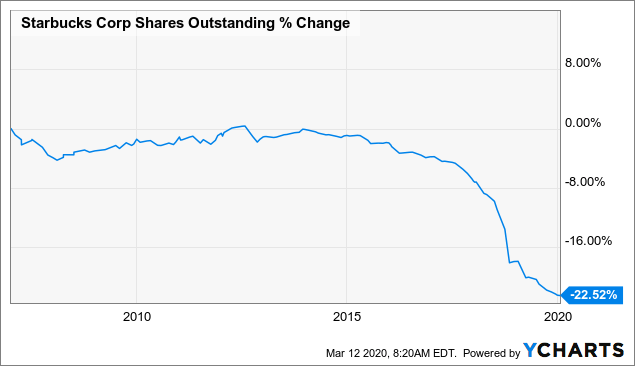
Let’s start by looking at how much shares were reduced since 2007.
 Data by YCharts
Starbucks has reduced its shares outstanding by over -22% over the course of this cycle. I’ll back these out for earnings growth estimates. When I go back to 2007 through today, I get a cyclically adjusted earnings growth rate for Starbucks of +14.99%, which is a fantastic growth rate.
Next, I’ll apply that growth rate to current earnings looking forward 10 years in order to get a final 10-year CAGR estimate. The way I think about this is, if I bought Starbucks’ whole business for $100, it would pay me back $4.50 the first year, and that amount would grow at +14.99% per year for 10 years. I want to know how much money I would have in total at the end of 10 years on my $100 investment, which I calculate to be about $210.84. When I plug that growth into a CAGR calculator, that translates to a +7.74% 10-year CAGR estimate for the expected earnings returns.
10-Year, Full-Cycle CAGR Estimate
Potential future returns can come from two main places: market sentiment returns or earnings returns. If we assume that market sentiment reverts to the mean from the last cycle over the next 10 years, it will produce a +2.94% CAGR. If the earnings yield and growth are similar to the last cycle, the company should produce somewhere around a +7.74% 10-year CAGR. If we put the two together, we get an expected 10-year, full-cycle CAGR of +10.68%. Since this expected forward 10-year return is more than 8%, Starbucks is now trading near “fair value”, and for the purposes of this demonstration of the rotational strategy, an investor could now rotate the second half of the money back into Starbucks. Next, let’s see how the rotational strategy performed.
Rotational Returns
Sometimes, the “free share gain” portion of the rotation and the “fair value” portion of the rotation meet their goals at different times, and so the returns are different. In this case, the stock price has moved so much, they met their goals at the same time, thus producing identical gains for both parts of the rotation at +35.81%.
Starbucks will now join four previous rotational “fair value” winners.
| Ticker | Free Share Gains from Full-Cycle Analysis |
| UNP | 19% |
| EXPE | 41% |
| CSX | 21% |
| NSC | 21% |
| SBUX | 35% |
And now, this completes the demonstration of the rotational strategy with Starbucks. The first half of the rotation gained about 35% more free shares, and the second half also gained about 35% more free shares. I have 38 additional high-quality stocks I’m still tracking, though, so we should have a fairly large sample from which to judge and analyze the strategy in the future.
Additional notes
There are several goals of this series of articles. The first goal is to warn investors when I think certain stocks are overvalued enough to sell. The second goal is to provide a simple, long-only strategy that an average retail investor could use to address the problem of high-quality, overvalued stocks in their portfolio. And the third goal is to test these approaches in real-time to see what we can learn, thereby making the strategy even better.
Even though this part of the demonstration is complete and the goal of gaining 20-25% worth of free shares was a success, I am not actually buying Starbucks’ stock yet because I prefer to have a margin of safety along with high expected future returns. So, personally, I will wait until SBUX has an expected 10-year CAGR over 12% before I consider buying the stock. In the Cyclical Investor’s Club, I now have 200-300 stocks I track using this approach, and another 100 or so more cyclical stocks I track using a different method. The data for these now updates in real-time, which is quite handy in volatile times like we are currently experiencing.
Before potentially buying the stock, I will also examine previous declines to see how deep the stock price could potentially fall in a recession scenario. Those readers familiar with my research will recognize the table below. It contains historical data on all of the downturns deeper than -30% Starbucks’ stock has experienced since it was a publicly traded company. The table shows the approximate year the downturn started, how long the stock took to bottom, how long the entire downturn lasted before the stock fully recovered, and how deep the drawdown was from peak to trough. While it’s important to keep in mind that companies change over time, I’ve found that past price cyclicality, when placed in the proper context, can be a good guide for what to expect in the future. At the very least, it lets investors know what sort of downside is possible for a stock.
| ~Year | ~Time Until Bottom | ~Duration | ~Depth |
| 1998 | 3 months | 12 months | 47% |
| 1999 | 3 months | 12 months | 48% |
| 2000 | 2 months | 7 months | 37% |
| 2001 | 10 months | 18 months | 43% |
| 2007 | 2 years | 4 years | 78% |
The 2007 decline is probably the most relevant in this case. Going into the 2007 decline, Starbucks’ P/E was about 50 and it bottomed about 12-13. Going into the current decline, Starbucks’ P/E was about 35. So, we probably shouldn’t expect a near -80% decline in the stock price. However, at least waiting for a -50% to -60% decline seems reasonable, or for the P/E ratio to get close to 15.
 Data by YCharts
We still have a little way to go before we get there, at which point I will get interested in buying.
If you have found my strategies interesting, useful, or profitable, consider supporting my continued research by joining the Cyclical Investor’s Club. It’s only $29/month, and it’s where I share my latest research and exclusive small-and-midcap ideas. Two-week trials are free.
Disclosure: I/we have no positions in any stocks mentioned, and no plans to initiate any positions within the next 72 hours. I wrote this article myself, and it expresses my own opinions. I am not receiving compensation for it (other than from Seeking Alpha). I have no business relationship with any company whose stock is mentioned in this article.
Be the first to comment