

Metha Andreasen/iStock via Getty Images
Inflation data was front and center once again this week. On Wednesday, the Department of Labor (DoL) released its July Consumer Price Index (CPI) report. The report showed an increase in consumer prices at an annual rate of 8.5%.
The good news is that the 12-month increase for July was down from June’s 9.1% and below economists’ expectations. Core-CPI, excluding volatile food and energy, rose 5.9% annually and 0.3% month over month, also below expectations. Gas prices fell 7.7% from June, helping energy prices down 4.6% overall. Food prices increased 1.1% from last month and 10.9% over the last 12 months, marking the largest annual increase since May 1979.
Yesterday, we received the Producer Price Index (PPI) report for July which highlighted a decrease in final demand prices. The PPI fell 0.5% during the month following increases in both June (+1.0%) and May (+0.8%) – the index advanced 9.8% on an annual basis. Core-PPI – excluding food, energy, and trade services – increased 0.2% in July and 5.8% over the previous 12 months.
Both CPI and PPI readings were viewed as positive signals by market participants which could lead the Federal Reserve to cool down its rate hiking cycle. Wednesday saw a strong day from equity markets, while yesterday’s markets traded flat to mixed.
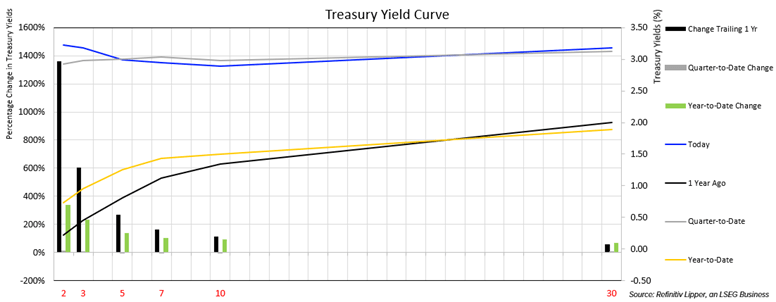
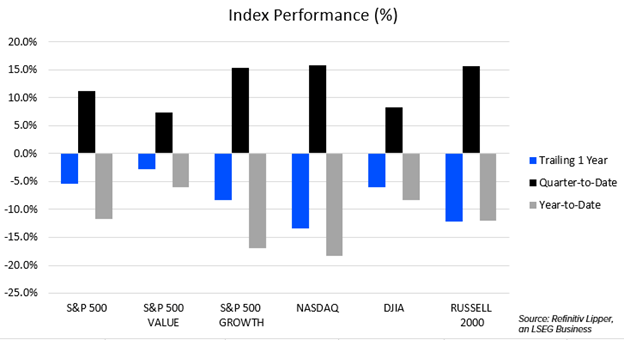
Despite the 10-year Treasury yield increasing 3.66% on Thursday, the 10-two Treasury yield spread remained negative for its twenty-eighth straight session. We find ourselves in a period with an inverted yield curve and drastically different than the beginning of the year. While there has been a lot of doom and gloom recently in the markets, quarter-to-date returns for broad-based equity markets have been quite strong.
Looking at flows, equity funds (including both mutual funds and ETFs) attracted $4.4 billion over this past Lipper fund-flows week, marking only the third week in 10 seeing net positive flows.
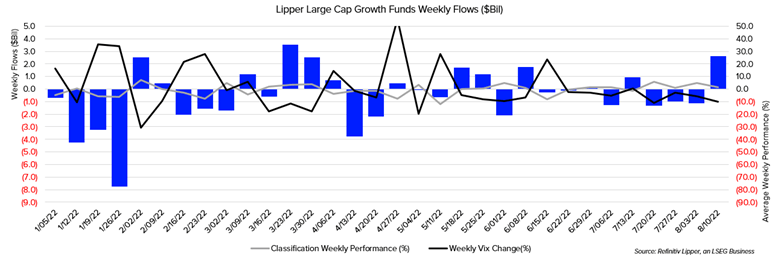
Digging into our Lipper Large-Cap Growth and Lipper Large-Cap Value classifications, we see investors preferring value over growth during the first half of 2022. Lipper Large-Cap Value Funds realized $13.3 billion of net inflows, their largest first-half figure since 2004.
Lipper Large-Cap Growth Funds suffered $18.5 billion in net outflows during the first six months of this year. While not surprising, as growth tends to do poorly during rate hiking and fiscal tightening cycles, are we starting to see the tides turn?
If the market prices in more dovish moves from the Fed, growth funds may be in store for new capital. Lipper Large-Cap Value Funds have seen seven consecutive weeks of outflows, whereas Lipper Large-Cap Growth Funds reported their first weekly inflow in four and the second largest of the year.
According to Refinitiv Proprietary Research, of the 456 companies in the S&P 500 that have reported second-quarter earnings, 77.6% have reported earnings above analyst estimates. After a tough start to the year, growth funds may be in a position to log a strong second half.
Editor’s Note: The summary bullets for this article were chosen by Seeking Alpha editors.
Be the first to comment