

Kwarkot
Astute retirees fear “sequence of returns” risk. One aspect of such risk is that your portfolio can be disproportionately depleted when withdrawals occur during bear markets.
Another, less-discussed aspect is that the monetary value of your portfolio can work its way downward when there is a secular decrease in earnings multiples over time. That is my focus today.
The market value of a firm has three components. What I call the “Midcycle Value” reflects two of them. First is the economic returns, the sum of the dividend yield and the earnings growth (using whatever version of earnings makes sense). Second is the midcycle earnings multiple, reflecting the current long-term trend in discount rates.
The third component is the “voting deviation” as the market goes through its emotional cycles. As one can see in the first plot below, this deviation suppresses the market price during some periods and inflates it in others.
As retirees who invest, we can seek to ameliorate the impact of the suppressed periods and enhance the impact of the inflated ones. This may involve various actions.
For example, one may retain liquidity to spend during suppressed periods. And/or one may seek to diversify into more stable stocks or other stores of value during inflated periods, providing funds to invest when prices are low.
If you execute them successfully, such actions can improve the performance of your portfolio. But they are not my concern today.
My question today is whether some portfolio strategy can better resist a long-term downward trend in discount rates while one is steadily withdrawing to support spending.
Historical Context
We can get useful context from the history of the ratio of price to earnings, or P/E. This next plot shows a 90-year chart of P/E for the S&P 500. This is from Macrotrends and based on GAAP earnings.
Mactrotrends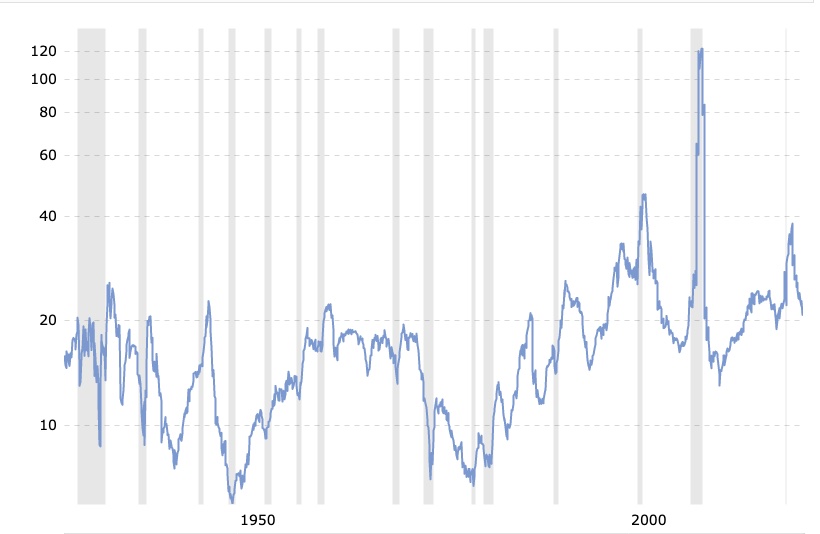
You can see many sharp oscillations lasting a small number of years. These are only sometimes associated with recessions.
Since the all-time low in 1949, I count 18 significant dips in the index but only 11 recessions. It still seems very unclear to me whether we will have a recession now, and in many ways it does not matter.
Most of the short-term drops are not associated with big changes in earnings either. My view is that the short cycles follow the psychology of the market as it swings from euphoria to depression and back again.
And note that this index is dominated by large caps. The small cap stuff was no doubt a lot more volatile. As to timing what will happen against the Fed or other triggers, a lot of people are trying. Some will succeed. I’m not trying.
We are in a bear-market dip at the moment, and it is highly likely that the market will rebound from here at some point. But the P/E ratio may not go back near 40. How high will it go?
The history is one of long-term cycles lasting decades. The successive short-term cycles make higher or lower highs as one works through their ups and downs.
These long-term cycles are tied to interest rates and inflation, which are tied together. Most explicitly, they represent changes in the rate at which future earnings are discounted. And the strongest influence on discount rates is interest rates.
The 35-year bull market in bonds that began in 1980 saw a secular, long-term decrease of discount rates. You can see that the midcycle value of P/E increased steadily until we encountered the turbulence of the early 21st century.
What concerns me, and should concern you, is that this plot suggests that midcycle P/E ratios are likely to work their way downward from here. This could devastate the value of your portfolio and your ability to withdraw from it.
Perhaps this will be delayed a decade. Perhaps this time is genuinely different, and discount rates will never go back up, as some (mostly youngsters) argue.
There is also always a question of how defensive to be. Cash under the mattress? A Treasury bond ladder? Or what?
None of those choices make a lot of sense to me right now; most companies create and grow earnings across economic cycles. Besides, going to cash would not support the spending I hope for. So it seemed worthwhile to work out some consequences of various strategies in the face of a period of decreasing earnings multiples.
The Choices We Face
Simply put, there are two limiting choices. We can put funds in companies that pay little or no dividend and seek to maximize growth. Or we can put funds in companies that pay the maximum feasible dividend and grow slowly as a result.
There is an important difference in how our returns from these limiting cases vary as the discount rate does. The key is that earnings and earnings growth are usually not closely tied to the discount rate.
The focus here is “blue-chip” companies or those with similar levels of security. Earnings before distributions generally grow, save perhaps briefly during recessions. Dividends are generally sustained and grow. What changes is the market value of the earnings.
As a result, during the downward portions of the long-term cycle of price to earnings, income from dividends is better sustained than income from price appreciation. Counterbalancing that, companies growing more strongly can more easily make up for decreases in price-to-earnings ratios as time goes on.
This sets up the following question, for a retiree who needs to take some real income from their portfolio. What choices of dividend yield and growth rate enable the best long-term survival of one’s portfolio when price to earnings ratios are in a long-term decline?
The qualitative tradeoff is clear. A position in a stock that pays a higher dividend requires the sale of a smaller fraction to produce a specified income. The remainder can still grow.
But a stock with a lower dividend and higher growth rate might still produce more total growth. Faster growth from a slightly lower base might still turn out to win.
Let’s see.
REITs as the Example
We will look at this question in the context of REITs, where a substantial portion of my own portfolio is invested. The general conclusions will be applicable to a wider range of stocks.
We can use two REIT sectors to illustrate the tradeoffs and inform our choices below. One is the Net Lease sector, who lease free-standing properties on terms under which tenants pay for all maintenance, taxes and insurance. The other is the Multifamily sector, who rents apartments to residents.
Here are the dividend yield (as of Oct. 10) and the ratio of Price to FFO (adjusted) for nearly all the REITs in these two sectors:
RP Drake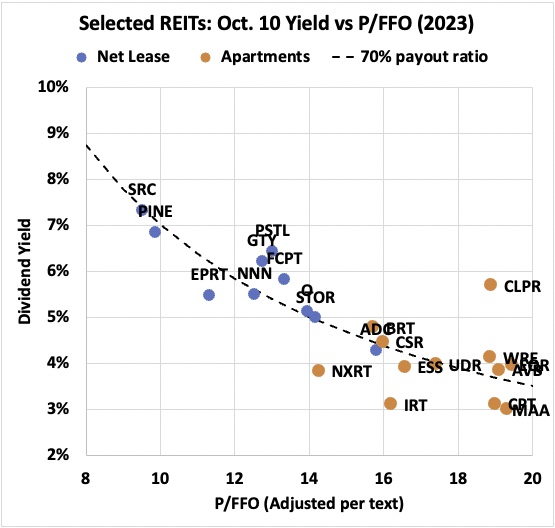
[Some technical notes: Ideally one would plot the ratio of price to Adjusted Funds From Operations, or AFFO. But AFFO is complex, as discussed here, and it is Funds From Operations, or FFO, that is more readily determined and easily obtained. Here I left P/FFO unchanged for the Net Lease REITs, although for some of them P/AFFO is up to 10% higher. In contrast, I pushed the value of P/FFO up by 13% for the Apartment REITs, which is the average ratio for a collection of REITs from REIT/base. (Apartment REITs have a larger ratio because of their maintenance capex.)]
These data points lie along the dashed curve because the ratio of the two variables plotted is the payout ratio. The curve itself is for a payout ratio of 70%. Higher payout ratios lie above it.
The only real outlier here is Clipper Realty (CLPR), whose growth has little to do with AFFO. I discussed their business model here.
Dividend yields are up 1% to 2% this year across all these REITs. Their stock prices have fallen even as they all have modestly increased dividends.
A year ago, P/AFFO was larger for all these REITs but much larger for the apartment REITs. For example, Camden Property Trust (CPT) was above 30x. Now not only is the price lower but also the 2023 FFO used as the basis here is substantially higher.
You may find this graphic depiction of the relationships useful for thinking about trends. It relates the AFFO/share growth rate to yields and earnings ratios, for a 10% economic total return.
RP Drake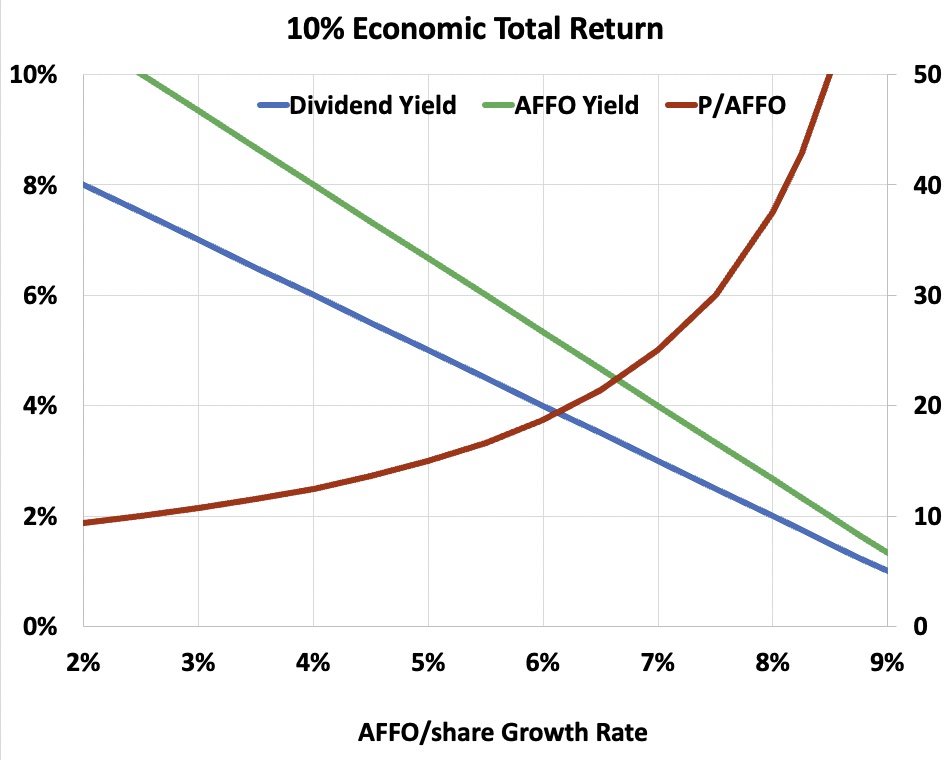
The economic returns of REITs in general run in the high single digits. I discussed why here. This was true for example in mid 2019 and mid 2021. There is, of course, variability amongst individual REITs.
My conclusion in the linked article was that, for about 20 years, REITs had been experiencing additional market returns of about 4% per annum as a result of increasing earnings multiples. Actually I lowballed that a bit because I had trouble believing it could be much larger. This is how successful REITs have produced their total market returns in the low teens over that interval.
If you look at the S&P 500 plot above, the mid-cycle P/E increased about 4% per annum from 1982 through the early 2000s. It decreased at about 7% per annum from the early 1970s through 1982.
The point here is that changes this rapid are present in the historical record. They are plausible. What’s more, it is sensible that we will soon see an extended decline in price-to-earnings ratios.
One can hope that inflation of rents and property values will counter this for REITs. One can hope similarly that price inflation will counter it for energy and commodity companies. But these tailwinds may well fail to completely counter the drop in earnings multiples, and may not be present at all for some potential investments.
What to Model for Retirees
The following models are pessimistic in two ways. First, they are based on the assumption that the ratio of price to earnings changes at rates of rise or fall seen in the historical record for the S&P 500. The tailwinds mentioned above may well make any decline more mild for some sectors.
Second, prices are assumed to fall from their present values. But actually they should bounce upward, even if we are at the start of a long-term downward cycle in midcycle price to “earnings”.
The models inflated the expenses at 3% per annum but did not increase AFFO/share growth in response to inflation. As a result, what that 3% really represents is the difference between price inflation and the additional increase in AFFO/share resulting from it.
At the moment, price inflation is higher than 3%, but it won’t stay that way. If inflation were to average far enough above 3% over the next 20 years to more than offset the inflation-driven increases in AFFO/sh, then the models would prove optimistic. This seems very unlikely to me.
Based on all the above, here are the cases made sense to model:
RP Drake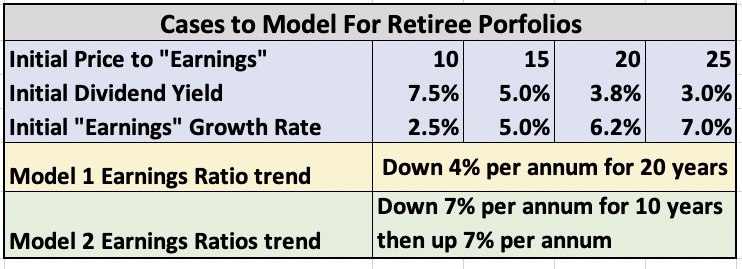
The Model Details
The models started with a “Position Market Value” of 100%. Assign any number you wish to this.
The initial value of AFFO is based on the selected earnings multiple. The initial income (dividend plus withdrawals) is 8%.
(The 8% is a fraction that my past Monte Carlo studies of statistical sequence of returns risks found to be safe on average. There is a big difference between insisting on near certainty of success vs good probability of success.)
For each of 20 years, the models:
- Find the dividend using a 75% payout fraction
- Find the reduction in position value after withdrawals
- Then for the next year they
- Find AFFO accounting for its rate of growth and the withdrawals
- Reduce or increase the earnings multiple according to the model
- Find the new position value from the new multiple and new AFFO
- Increase the mandated income according to the 3% inflation assumption
The models limit the decrease in earnings (AFFO) multiple to 7.5. This corresponds to a discount rate above 13% for a firm whose income is steady but not growing. It also corresponds to a 10% dividend yield at the 75% payout ratio.
I just can’t see the markets pushing midcycle values below that level for growing REITs. If you can, it is fairly evident in the plots below how that would go.
The models evaluated 8 total cases, shown in the above table. This is the four initial earnings multiples (10, 15, 20, and 25) and two histories of how they changed.
The first history was to decrease the earnings multiple by 4% per year for the 20 years. This would be a direct reversal of the period from 1980 to 2000 for the S&P 500.
The second history was to decrease the earnings multiple by 7% per year for 10 years, then increase it by 7% a year for the next 10 years. This mimics the 1970s and 1980s.
Results for 10% Total Economic Returns
Here is what the models do for the two cases of future earnings multiples and 10% total economic returns. First we look at dividend yields. For the case with a decrease of 4% per annum, the results look like this:
RP Drake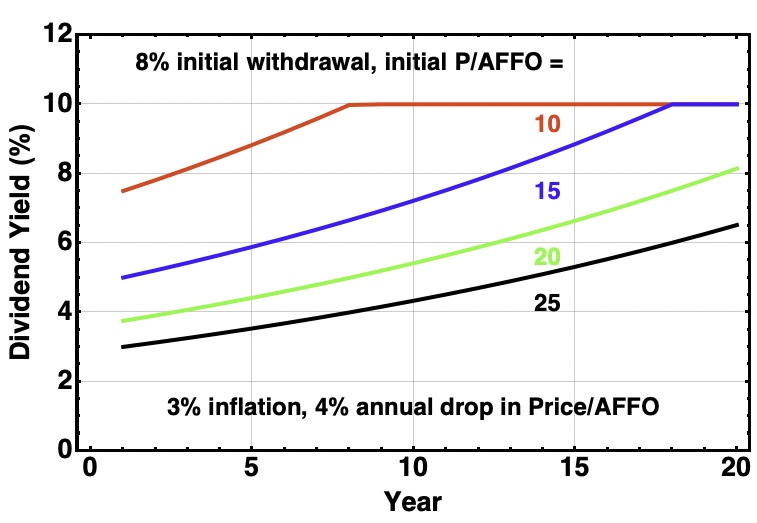
On this plot and the next three, the four curves correspond to the four initial values of P/AFFO from the table above. Each curve is labeled and has a consistent color across all related figures.
For this case, the dividend yield steadily increases with time unless it reaches the limiting value assumed by the model. Earnings grow even as the earnings multiple decreases.
In the case that mimics the 1970s, dividend yields grow and then shrink as the earnings multiple goes down then up:
RP Drake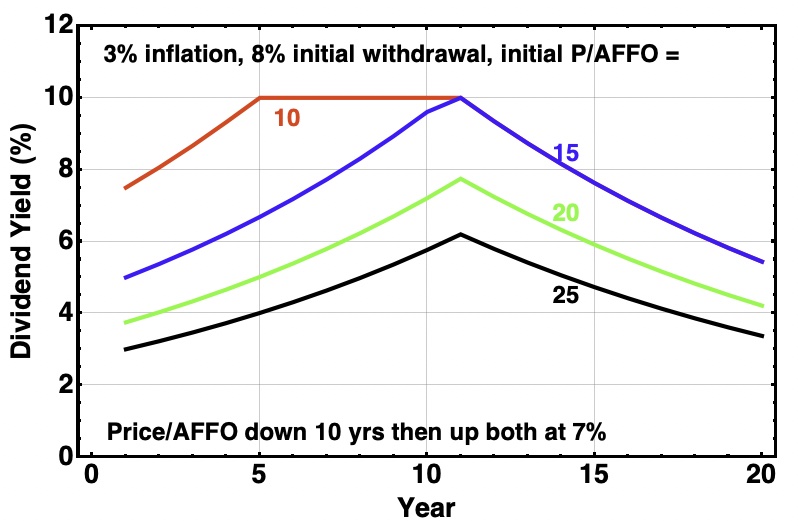
Of course what matters more is how the value of the position (or portfolio) evolves. For the first model with 4% declines in earnings multiple, we get this:
RP Drake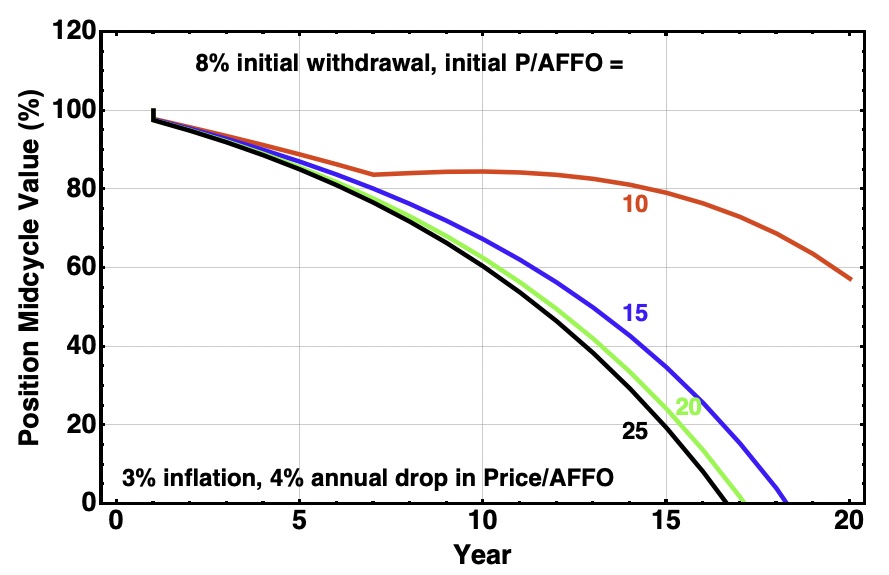
We see that the lower the initial earnings multiple, the less depletion there is of the initial funds. The funds are depleted in less than 20 years, except in the case that bumps up against the assumed minimum earnings multiple of 7.5.
The behavior for a steep drop in earnings multiple followed by a recovery is more interesting:
RP Drake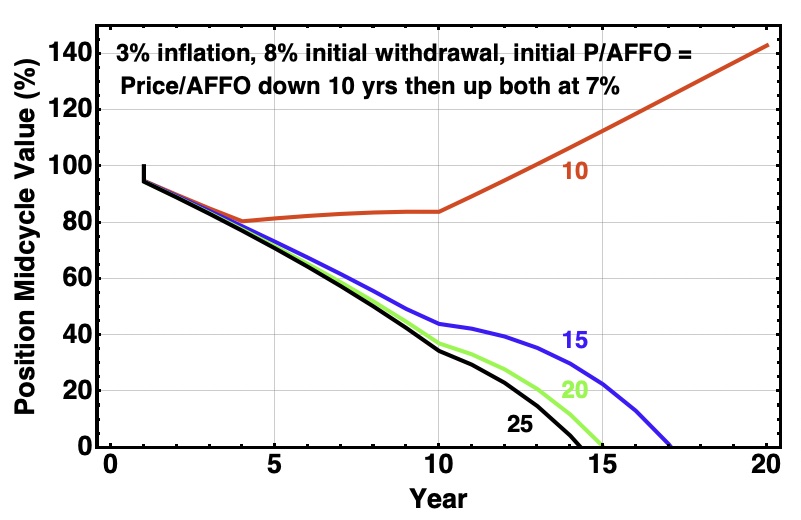
Again lower initial earnings multiples perform better. Even so, the positions with higher earnings multiples go to zero a bit sooner than they did in the previous case.
The case with an initial earnings multiple of 10 (shown in red) takes a very different path. As soon as the earnings multiple stagnates, the growth of AFFO is sufficient to stay ahead of the withdrawals. Then value starts to accumulate rather than drop.
If reality proves a bit more positive than what is assumed for these models, there is a real potential for growth of value rather than decline, for some of the lower earnings multiples. This is true despite the 8% initial withdrawal rate.
Results for Present Total Economic Returns
The cases above all correspond to a forward (economic) total return of 10%. At the moment, though, this may be too pessimistic.
At today’s depressed prices the dividend yields are larger and more often correspond to higher economic total returns. Let’s look at that, for three cases.
AvalonBay (AVB) has one of the best track records amongst REITs regarding the growth of AFFO/sh. They have done over 7% for extended periods and seem poised to continue that.
But AVB is appreciated by the market and pays a low dividend, well below 3% in high markets. So their economic yield often has been a bit below 10%.
Even in today’s low market the yield has only risen to 3.5%. This pushes the economic yield just above 10%.
Using 2023 AFFO, the ratio of AFFO/P is 5.8% and P/AFFO is 17. Running the above model for the current earnings multiple and dividend gets you this, for three forward growth rates:
RP Drake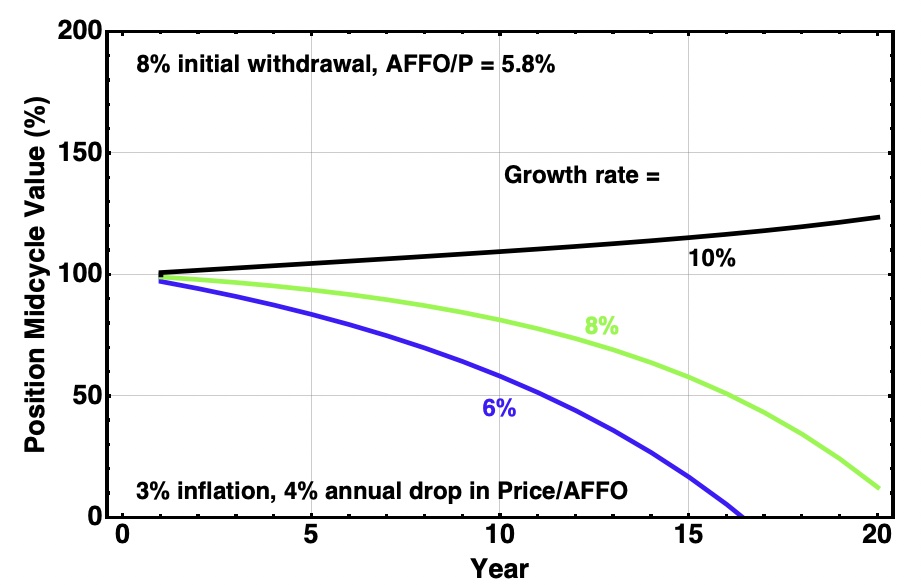
We see that AVB needs to produce earnings growth above their historical average to sustain the nominal market value of the position against the assumed withdrawals. This seems to make them unattractive, compared to the examples below. But it is worth remembering that apartment REITs have the best ability to convert inflation into shareholder value, thanks to their short leases.
Moving on, today several blue-chip REITs are producing a dividend yield near 4.5%. One example that I own is Federal Realty Trust (FRT), whose dividend yield is now 4.8%.
Using 2023 AFFO, the ratio of AFFO/P is 5.5% and P/AFFO is 18. The AFFO payout ratio is high at 87%. Running the above model for the current earnings multiple and dividend gets you this, for three forward growth rates:
As discussed here, I see FRT as likely to exceed its past AFFO growth rate of 5.5% over the next decade. So there is a good chance that funds placed there will sustain withdrawals at 8% for 20 years, even under the pessimistic assumptions used here.
The two cases just considered differed mainly in dividend yield. Yet that higher yield for FRT means that spending can be sustained at a significantly lower growth rate of AFFO/share.
RP Drake
There are today a small number of blue-chip REITs priced with lower earnings multiples and higher dividend yields. Naturally, they are all controversial.
My own largest position is Simon Property Group (SPG). I believe this stock to be very substantially undervalued. SPG has grown FFO/sh at an average rate over many years that is above 5%.
The current ratio of price to FFO for SPG is 8x. It is difficult to pin down an AFFO for them or any mall REIT; the estimate used here is that the current price is 10x AFFO. The dividend yield is 7.3%. Running the model with these parameters gives this:
RP Drake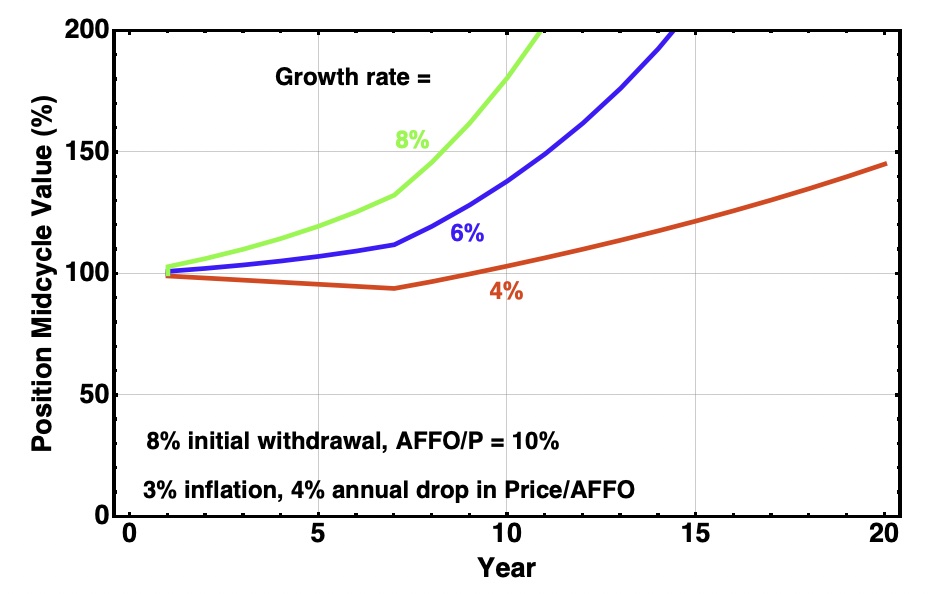
On the assumptions of the model this looks really good. Even if SPG grows earnings at a slower rate than their historical average, a position taken there today looks more than able to sustain an 8% withdrawal rate.
The Answer and Its Limitations
We have the answer to our initial question. It is this:
When income in excess of dividends must be drawn from a portfolio, higher dividends lead to improved portfolio survival.
It turns out that the higher growth one gets by paying a smaller dividend is not enough to compensate for the need to withdraw a larger fraction each year.
However, the models above ignore the risk of dividend reductions. This is why it matters a lot to not just select stocks based on high yields.
A high yield may reflect a likelihood that the specific security will lose value. A case in point historically has been mortgage REITs. Another is most equity REITs with external management.
Alternatively, a high yield may reflect an unreasonably low market valuation, whether of all stocks, some sector, or a specific firm. Such yields are good things to buy.
But still there is judgement and scope for disagreement. Examples:
- The future of brick and mortar retail impacts whether SPG or FRT will sustain and grow their dividend.
- The future of cinemas impacts whether EPR Properties (EPR) will sustain and grow their dividend.
- The future of trophy, Class-A+ office properties impacts whether Boston Properties (BXP) will sustain and grow their dividend.
- The future of logistics demand in areas they serve impacts whether STAG Industrial (STAG) will sustain and grow their dividend.
- And so on…
In addition, judgement is needed about other aspects of each REIT. In the list just given, for example, my view is that STAG flies too close to the sun with their management of their debt maturities. I avoid STAG for that reason.
There are other issues to consider as well. For one, author JoeX believes that the fraction of dividends distributed as ordinary income for a REIT represents the legal minimum payout. I am not 100% sure of that, but it is comforting that the fraction of the dividend paid as ordinary income is typically high for the REITs listed above.
The models above also assume that the dividends actually do grow with AFFO/sh and that AFFO/sh will keep growing. In the long run both will be true for quality REITs but there may be periods when it is not.
The bottom line for me here is that one should not try to run a strategy involving high dividends and low earnings multiples on autopilot. Things can and will go wrong. There will be times to adjust.
Impact on My Plans
On the assumption that further thinking and discussions do not reveal flaws in the reasoning and models shown here, my investing plans will adjust. I will need to withdraw few if any funds from my investments in 2023, but may well need to start pulling that 8% of today’s market value in 2024.
By pure accident, the recent history of what fell fastest and farthest was that the higher-dividend plays fell first this year. That led me to sell out of some low-yield, growth-oriented REITs to add to holdings of the higher-yield ones.
I’m likely to buy fewer if any of the low-yield REITs as we come out of this bear market. I’m likely to continue to favor higher dividends that are positioned to grow.
In addition, perhaps I will broaden into another area beyond REITs and energy. But it will have to be one I can sufficiently understand. That might be mining.
Perhaps you are a retiree who is also dependent on 9from your portfolio. If so, it would seem a good idea to spend some time thinking about how declining earnings multiples would impact your own portfolio.
Be the first to comment