

PeopleImages/E+ via Getty Images
Those who regularly read my work have probably picked up on the fact that I’m running further behind than I would usually like when it comes to John and Jane’s portfolio updates. Recently I’ve been spending my evenings completing a major renovation of our family room (I can tell that my wife is ready to have this room back to normal), spring yard cleanup, and getting my woodshop/auto shop organized as I combine my father’s tool collection with my own.
When the family room became usable again all of my efforts went to my shop space tearing out old shelving units in favor of a French cleat storage system. If you are curious there are hundreds of French cleat videos on YouTube that described many of the benefits of using the storage system. Below is a recent picture of the cleats I built and the tool holders that I custom-designed to make my shop space look good and increase the efficiency of my work environment.
French Cleat Tool Wall (Consistent Dividend Investor) French Cleat Tool Wall – 2 (Consistent Dividend Investor)

It can be pretty easy to tie aspects of woodworking into an activity such as investing but the French Cleat (FC) wall seems particularly relevant. My motto over the last few years (even before I had a large dedicated shop space) was that I could choose to purchase many inexpensive tools and be disorganized or I could be very organized and justify purchasing higher-end tools. If I chose to focus on inexpensive tools (which for the record, tools that don’t work when I need them to is a huge pet peeve of mine) I would need to replace them often (potentially because I misplaced them or they won’t work). Expensive tools work 99.9% of the time that I need them but I can’t afford to be disorganized or misplace tools because they would be too expensive if I need to constantly buy new ones.
The FC storage system became the best option for me because it requires that I designate a spot for each tool that prevents me from putting anything in that spot other than the tool it is designed to hold (see picture #2). In short, the FC system may not allow me to store the most stuff but it will allow me to make the best use of the stuff that I have so that I don’t need to go buy more stuff.
So how does this relate to investing exactly? For my retirees, it all comes down to whether or not we are putting our faith in sustainable investments (AKA expensive/quality tools in an organized shop) or if we are reaching for unsustainable yield (AKA inexpensive/lower-quality tools in an unorganized shop). Unfortunately, the investors that are at the highest risk of reaching for an unsustainable yield are those that have not saved enough money to comfortably meet their needs in retirement. In other words, an investor with $500,000 in assets would need an average dividend yield of 8% ($40,000 per year) to achieve the same annual income as an investor with $1 million in assets who is pulling an average dividend yield of 4% ($40,000 per year).
Now, it is also possible to find investments that have a high dividend yield that is also sustainable. This scenario is fairly common and the best example would be in preferred shares that can offer safe yields in the high single-digit range (8%). My tool comparison for this kind of investment would be like buying sockets from Harbor Freight because the chances of a socket snapping or breaking are practically zero. Sockets from Harbor Freight are likely to cost significantly less while providing the same results as a more expensive quality tool brand. For this reason, there is a time and place for high-yield investments but we must be selective in the same way I am selective about my tools.
I have spent years obsessing over how I would make this FC wall work because I didn’t want to miss any of the fine details that would bother me a few years from now. After all, what would be the point of building an investment portfolio that is 50% top-notch investments while the other 50% represents low-quality investments with significantly higher risk? At the end of the day, we can only boost the yield of a dividend portfolio by so much by using high-yield investments as the tool to make this happen. We all need to understand the kind of risk we are willing to take in pursuit of the goals we have.
For me it’s an easy answer – I will be tearing out cabinets and shelving that promote clutter and are bound to result in a disorganized environment in favor of FC walls that prevent me from building up clutter and emphasize the quality tools that I already own. Even though this has more upfront costs it is the kind of investment that will pay off many years down the road.
Background
For those who are interested in John and Jane’s full background, please click the following link here for the last time I published their full story. Here are the key details about John and Jane that readers should understand.
- This is a real portfolio with actual shares being traded.
- I am not a financial advisor and merely provide guidance based on a relationship that goes back several years.
- John retired in January 2018 and his only consistent source of income is Social Security.
- John has begun drawing $1,000/month from his Traditional IRA to supplement his retirement income.
- Jane officially decided to retire on December 31, 2020. She is now collecting social security as her primary source of income.
- John and Jane have other investments outside of what I manage. These investments primarily consist of minimal risk and minimal yield certificates.
- John and Jane have no debt and no monthly payments other than basic recurring bills such as water, power, property taxes, etc.
John and Jane requested my help after we discovered that their financial advisor was charging excessive fees and engaging in trades that appeared to be more favorable to the advisor than it was to John and Jane. I do not charge John and Jane for anything that I do and all I have asked of them is that they allow me to write about their portfolio anonymously in order to help spread knowledge and to make me a better investor in the process.
Generating a stable and growing dividend income is the primary focus of this portfolio and capital appreciation is a secondary characteristic.
Dividend Decreases
No stocks cut their dividend/distribution that was payable during the month of February.
Dividend and Distribution Increases
One company increased its dividend/distribution or paid a special dividend during the month of February in the Traditional and Roth IRAs.
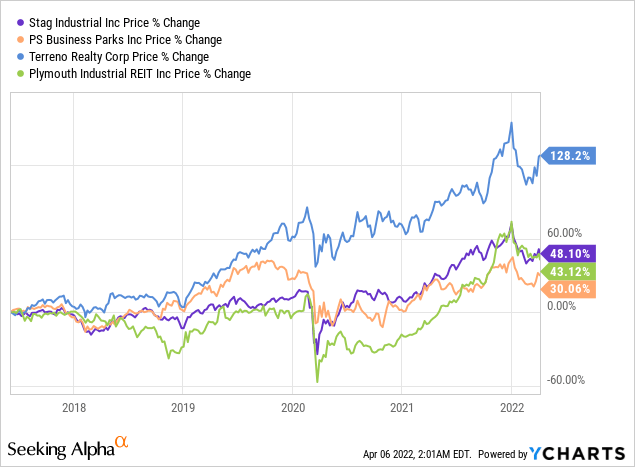
STAG Industrial – Industrial REITs have seen their shares explode on the wave of e-commerce and the increased need for single-tenant industrial properties. Part of what I like about STAG is its focus on secondary markets which offer better real estate value compared with major cities that likely have higher-cost industrial properties and competitors that were able to acquire these properties before they got so expensive. STAG still has room to fall before we would look to add more shares (our price point is $35/share in part because John has a full position in STAG) but the recent price drop has made shares significantly more attractive over the last three months. I agree with fellow author High Yield Investor’s article ‘STAG Industrial Is Getting Compelling Again’ that STAG could very easily be the next company involved in M&A.
The dividend was increased from $.120833/share per month to $.1217/share per month. This represents an increase of .7% and a new full-year payout of $1.46/share compared with the previous $1.45/share. This results in a current yield of 3.50% based on the current share price of $41.26
Retirement Account Positions
There are currently 38 different positions in John’s Traditional IRA and 22 different positions in his Roth IRA. While this may seem like a lot, it is important to remember that many of these stocks cross over in both accounts and are also held in the Taxable Portfolio.
Below is a list of the trades that took place in the Traditional IRA during the month of February.
Traditional IRA – February Trades (Charles Schwab)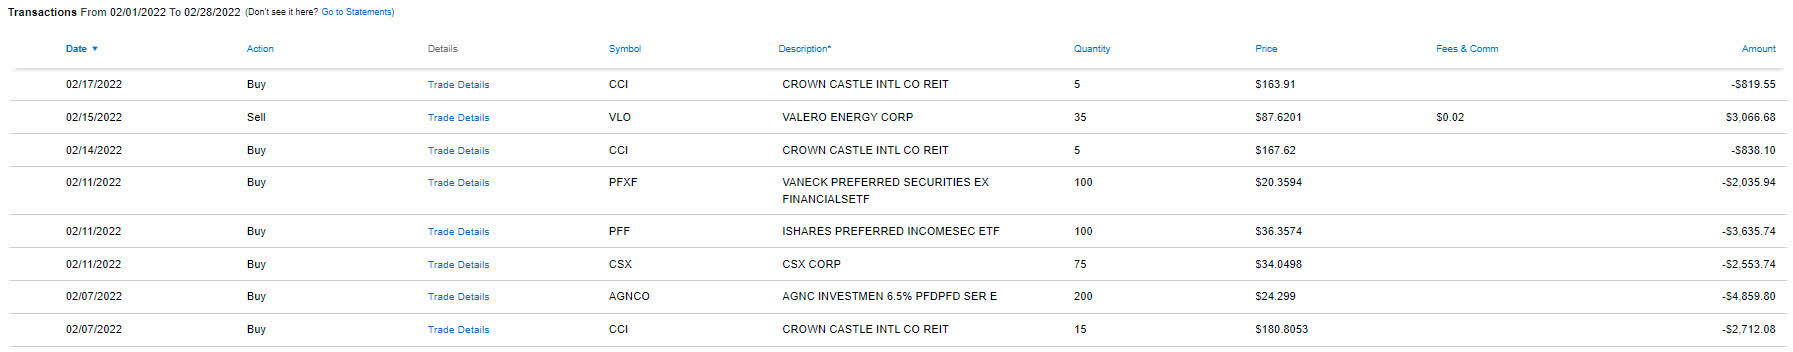
Below is a list of the trades that took place in the Roth IRA during the month of February.
Roth IRA – February Trades (Charles Schwab)
We sold a small number of higher-cost shares of Valero (VLO) to solidify the screaming deal we got on shares over the last 12-18 months that puts John’s cost basis in the low $60/share range. We have no intention of selling more of the VLO position but would definitely consider buying on any weakness. We made multiple small quantity purchases of Crown Castle International (CCI) and those have really paid off in the last couple of weeks with the share price making a strong recovery. We also used price weakness to acquire a large chunk of shares for iShares Preferred Income ETF (PFF) and Vaneck Preferred Securities ETF (PFXF). John was also able to take advantage of improve preferred share pricing that made AGNC Preferred Series E (AGNCO) quite attractive (shares are currently hovering close to the purchase price again). CSX was another opportunistic buy as we look to diversify John’s portfolio.
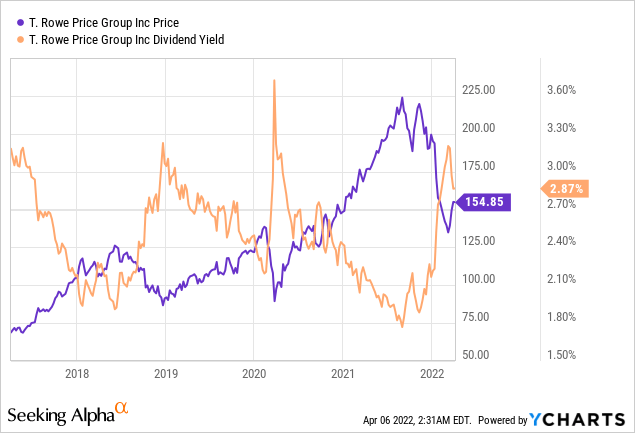
T Rowe Price (TROW) is another stock that has appears to have put its bottom in and is now working its way back up. The dividend yield can be an especially helpful tool when determining that the floor price has been set. In the image below you can see that rarely does TROW’s dividend yield come in at 3.15% over the last five years. With the exception of the start of the pandemic, we can see that TROW’s stock price appears to consistently move higher after hitting this point.
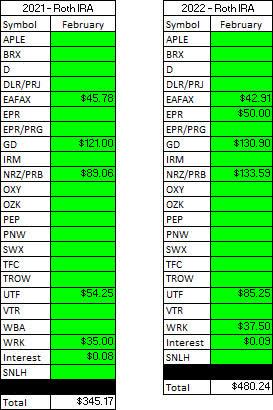
February Income Tracker – 2021 Vs. 2022
Income for the month of February was up considerably year-over-year for John’s Traditional IRA and up considerably in his Roth IRA. The average monthly income for the Traditional IRA is in 2022 is expected to be up about 8.6% based on current estimates and the Roth IRA is looking to grow by 10.8%. This means the Traditional IRA would generate an average monthly income of $1,193.29/month and the Roth IRA would generate an average income of $625.40/month. This compares with 2021 figures that were $1,098.38 and $564.25 per month, respectively.
SNLH = Stocks No Longer Held – Dividends in this row represent the dividends collected on stocks that are no longer held in that portfolio. We still count the dividend income that comes from stocks no longer held in the portfolio even though it is non-recurring.
All images below come from Consistent Dividend Investor, LLC. (Abbreviated to CDI).
Traditional IRA – February – 2021 V 2022 Dividend Breakdown (CDI) Roth IRA – February – 2021 V 2022 Dividend Breakdown (CDI)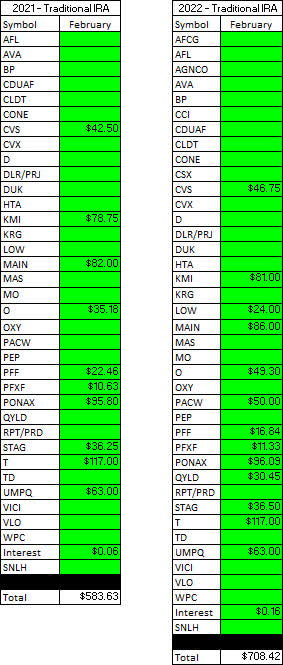
Here is a graphical illustration of the dividends received on a monthly basis for the Traditional and Roth IRAs.
Retirement Account – Monthly Dividends Received – February 2022 (CDI)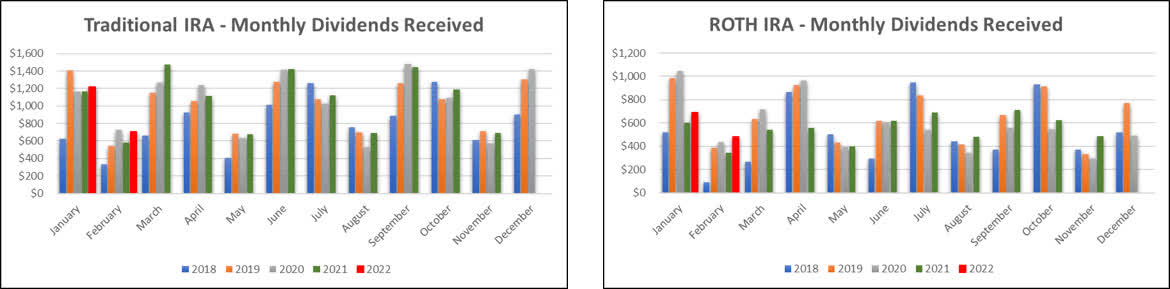
Based on the current knowledge I have regarding dividend payments and share count, the following tables are a basic prediction of the income we expect the Traditional IRA and Roth IRA to generate in FY-2022 compared with the actual results from 2021.
Retirement Projections – February 2022 (CDI)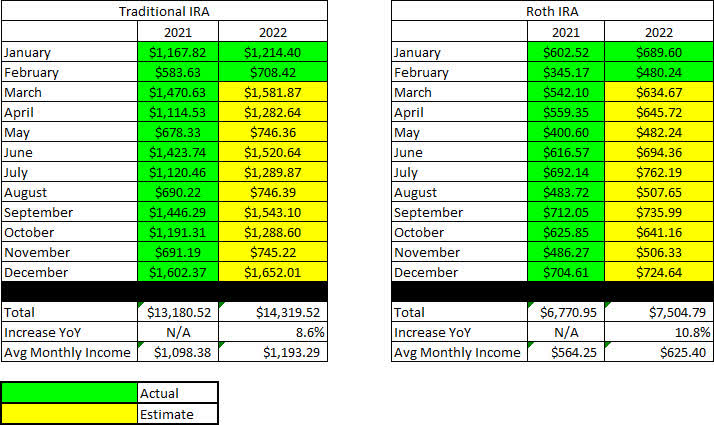
Below is an expanded table that shows the full dividend history since inception for both the Traditional IRA and Roth IRA.
Retirement Projections -February 2022 – Full Dividend History (CDI)
I have included line graphs that better represent the trends associated with John’s monthly dividend income generated by his retirement accounts. The images below represent the Traditional IRA and Roth IRA, respectively.
Retirement Account – Monthly Dividends – February 2022 (CDI)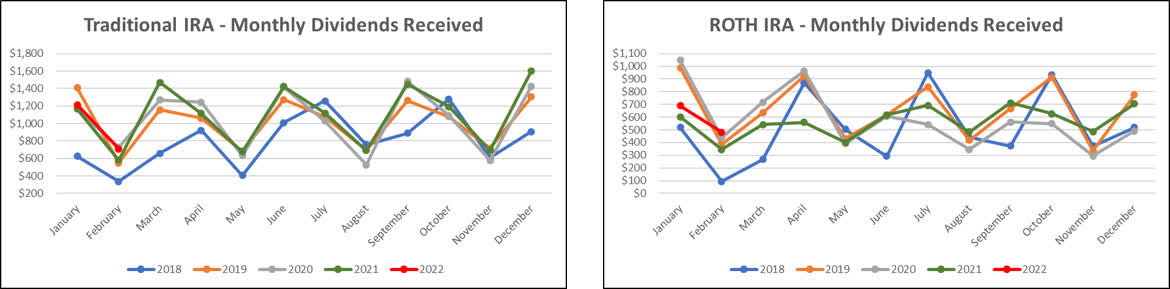
Here is a table to show how the account balances stack up year over year (I previously used a graph but believe the table is more informative).
Retirement Account – Month End Balances – February 2022 (CDI)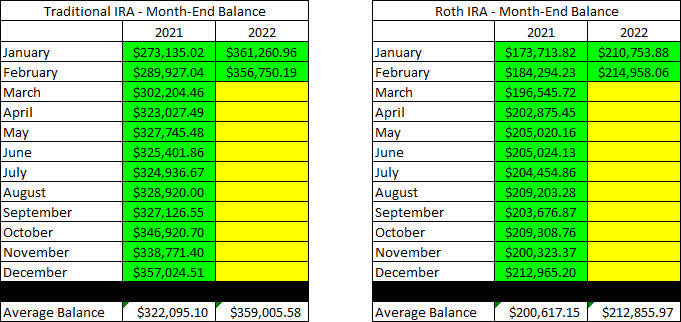
The next images are the new tables that indicate how much cash John had in his Traditional and Roth IRA Account at the end of the month as indicated on his Charles Schwab statements.
Retirement Accounts – February 2022 – Cash Balances (CDI)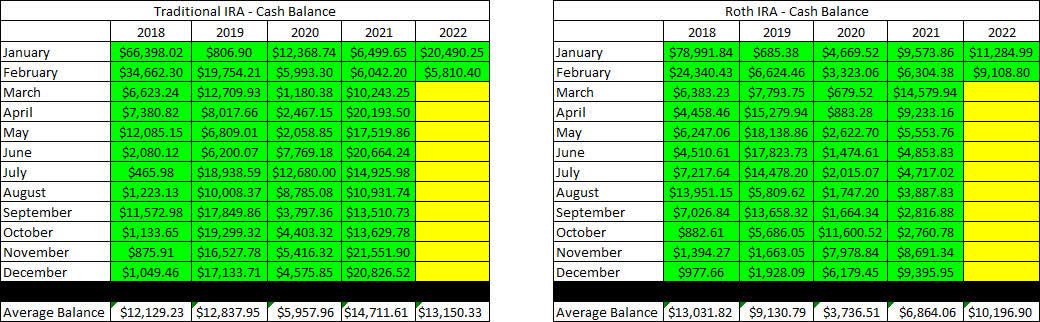
The next two tables provide a history of the unrealized gain/loss at the end of each month in the Traditional and Roth IRAs going back to the beginning of January 2018.
Retirement Accounts – February 2022 – Unrealized Gain-Loss (CDI)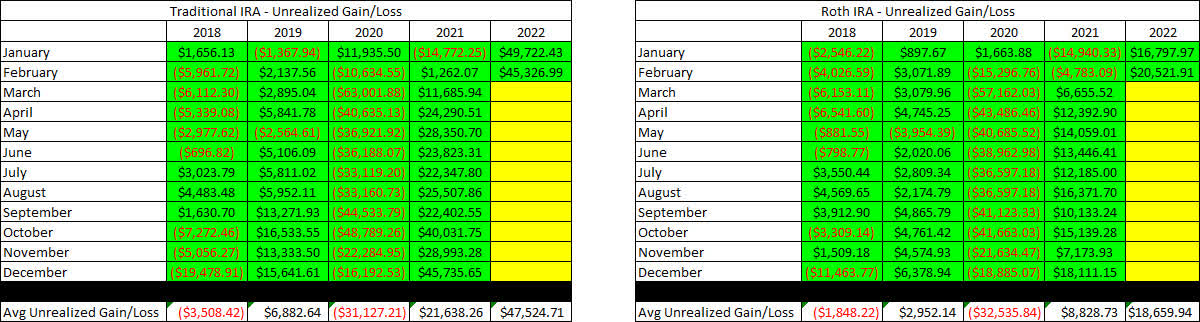
I like to show readers the actual unrealized gain/loss associated with each position in the portfolio because it is important to consider that in order to become a proper dividend investor, it is necessary to learn how to live with volatility. The market value and cost basis below are accurate as of the market close on April 5, 2022.
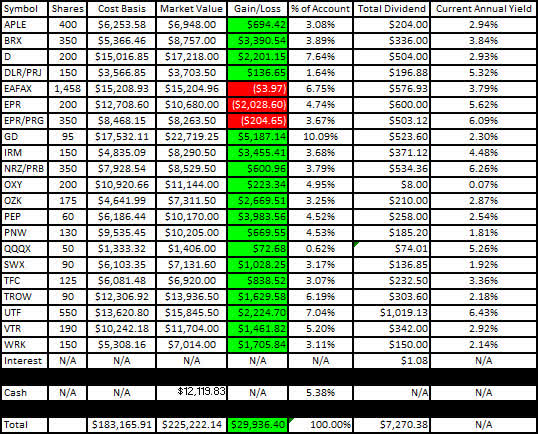
Here is the unrealized gain/loss associated with John’s Traditional and Roth IRAs.
Traditional IRA – February 2022 – Gain-Loss (CDI) Roth IRA – February 2022 – Gain-Loss (CDI)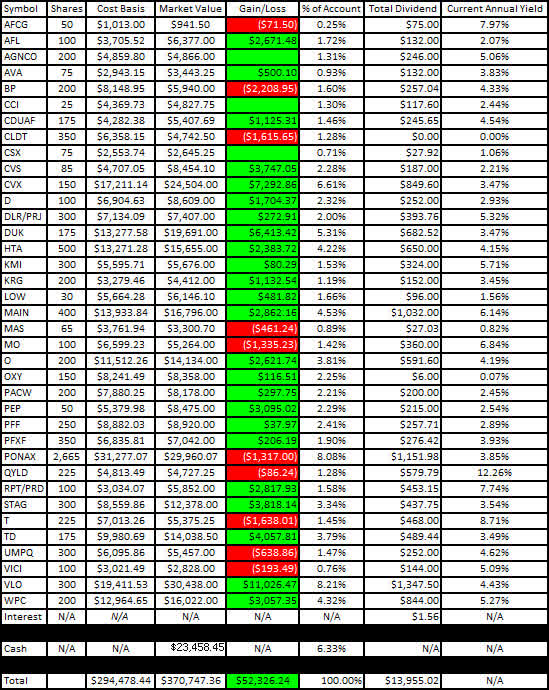
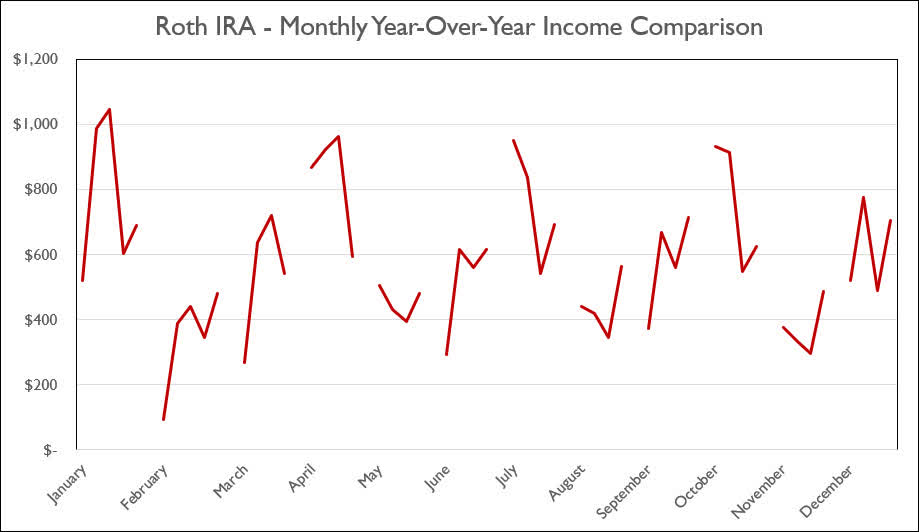
The last two graphs show how dividend income has increased, stayed the same, or decreased in each respective month on an annualized basis. I believe that the graph will continue to become more valuable as more years of data become available.
Traditional IRA – February 2022 – Annual Month Comparison (CDI) Roth IRA – February 2022 – Annual Month Comparison (CDI)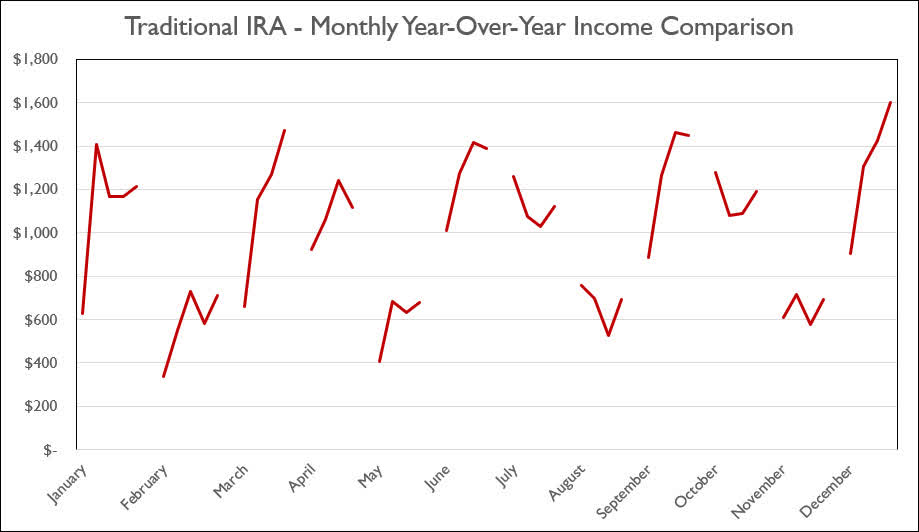
Conclusion
John’s portfolio is quite a bit more established than my French cleat wall but I really do think the parallels make sense from the perspective of a dividend investor. We choose to engage in risk accordingly which is why John holds small quantities of higher-risk stocks because they offer a yield that makes them worth the risk (within reason).
With the degree of uncertainty when it comes to inflation and the real potential of a recession it is becoming all the more important to focus on quality investments for the core of your portfolio with a handful of high-yield investments included. In both retiree’s portfolios, we are concentrating on quality more than ever because many of the high-risk investments of the past aren’t worth the stomach ache that accompanies them.
February Articles
I have included the links for John and Jane’s Taxable Account and Jane’s Retirement Account articles for the month of February below.
- The Retirees’ Dividend Portfolio: John And Jane’s February Taxable Account Update
- The Retiree’s Dividend Portfolio – Jane’s February Update: A Positive Dividend Growth Forecast
Article Format: Let me know what you think about the format (what you like or dislike) by commenting. I appreciate all forms of criticism and would love to hear what I can do to make the articles more useful for you!
In John’s Traditional and Roth IRAs, he is currently long the following mentioned in this article: AFC Gamma (AFCG), Aflac (AFL), Apple Hospitality REIT (APLE), Avista (AVA), BP plc (BP), Brixmor Property Group (BRX), Crown Castle (CCI), Canadian Utilities (OTCPK:CDUAF), Chatham Lodging Trust (CLDT), CVS Health Corporation (CVS), Chevron (CVX), CSX (CSX), Dominion Energy (D), Digital Realty Preferred Series J (DLR.PJ), Duke Energy (DUK), Eaton Vance Floating-Rate Advantage Fund (EAFAX), EPR Properties (EPR), EPR Properties Preferred Series G (EPR.PG), General Dynamics (GD), Healthcare Trust of America (HTA), Iron Mountain (IRM), Kinder Morgan (KMI), Kite Realty Group (KRG), Lowe’s (LOW), Main Street Capital (MAIN), Masco (MAS), Altria (MO), New Residential Investment Corp. Preferred Series B (NRZ.PB), Realty Income (O), Occidental Petroleum Corp. (OXY), Bank OZK (OZK), PacWest Bancorp (PACW), PepsiCo (PEP), iShares Preferred and Income Securities ETF (PFF), VanEck Vectors Preferred Securities ex Financials ETF (PFXF), Pinnacle West (PNW), PIMCO Income Fund Class A (PONAX), Nuveen Nasdaq 100 Dynamic Overwrite Fund (QQQX), Global X Funds Nasdaq 100 Covered Call ETF (QYLD), RPT Realty Preferred Series D (RPT.PD), STAG Industrial (STAG), Southwest Gas (SWX), AT&T (T), Toronto-Dominion Bank (TD), Truist Financial (TFC), T. Rowe Price (TROW), Cohen & Steers Infrastructure Fund (UTF), VICI Properties (VICI), Valero (VLO), Umpqua Holdings (UMPQ), Ventas (VTR), WestRock (WRK), and W. P. Carey (WPC).
Be the first to comment