

Drew Angerer/Getty Images News
Listed real estate is more volatile than private real estate and in a crisis, this means listed REITs underperform private real estate. This creates an opportunity for listed real estate, certainly at the end of a rate hiking cycle.
In the current environment of high inflation and low economic growth, we have a preference for the residential real estate sector in general and the Kelly Residential & Apartment Real Estate ETF (NYSEARCA:RESI) in particular.
But we only expect the end of the rate hikes in March of next year and all REIT sectors are still in a downtrend. So it’s too soon to buy RESI for us. Wait and see!
Inflation hedge in theory
In the past real estate acted as a good inflation hedge.
Figure 1: Real Estate and inflation (Cohen & Steers)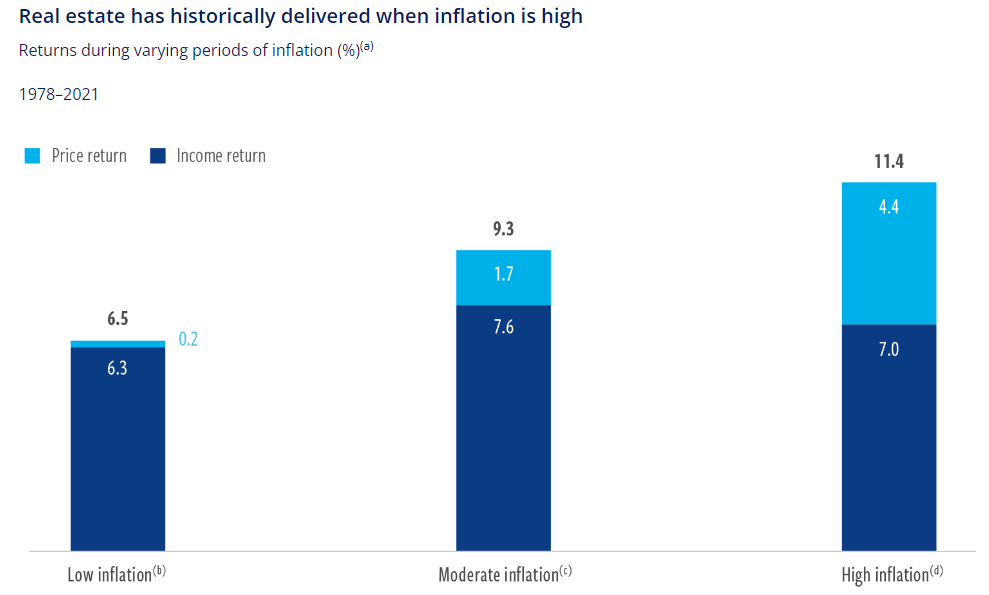
Together with energy, REITs are the best performing equity sector in inflationary environments.
Figure 2: Equity sectors and inflation (Incrementum)
There are several reasons why we can expect REITs to do well when inflation is high.
Some REIT sectors, such as e.g., Hotels and Self-Storage, have short lease durations which means they can adjust rates quickly in response to the high inflation numbers. Sectors with a long lease duration may have built-in rental escalation clauses that lead to higher rents in inflationary periods.
Inflation also brings rising construction and financing costs which puts a break on new developments and hence limits new supply which in turn supports the price of existing buildings.
Inflation hedge in practice
In 2021 both commodities and REITs did their job as an inflation hedge and even outperformed the S&P 500.
Figure 3: Total return chart (Yahoo! Finance, Author)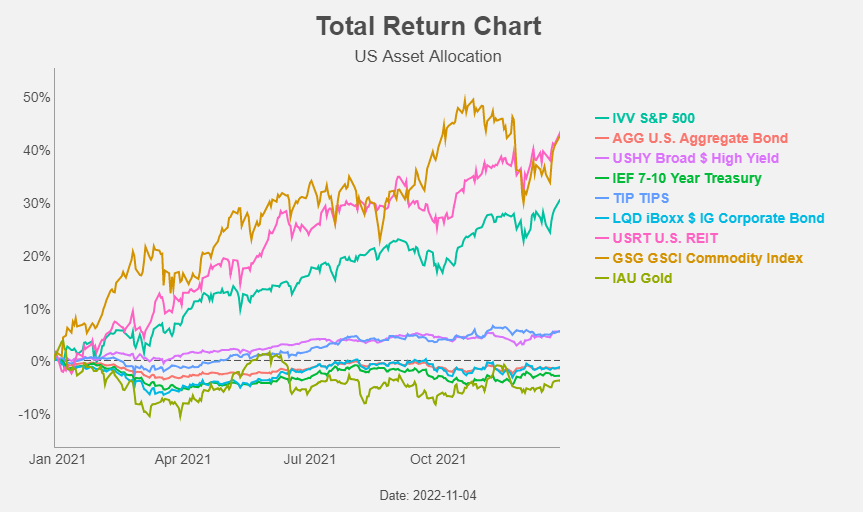
This year the picture looks a bit different. Commodities kept outperforming, but REITs didn’t do that at all.
Figure 4: Total return chart (Yahoo! Finance, Author)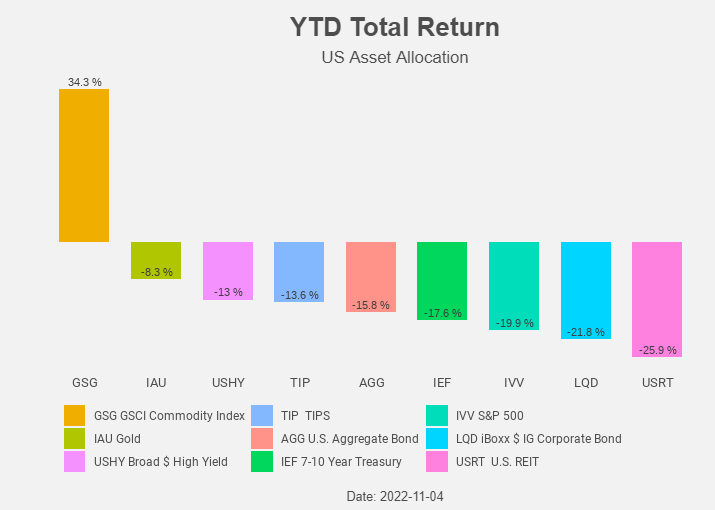
In 2021 inflation started to rise, but interest rates remained low.
Figure 5: Inflation and interest rates (FRED)
In 2022 inflation kept rising and interest rates, both on the short end and on the long end, started to rise and REITs fell together with broader equities and bonds.
Figure 6: Total return chart (Yahoo! Finance, Author)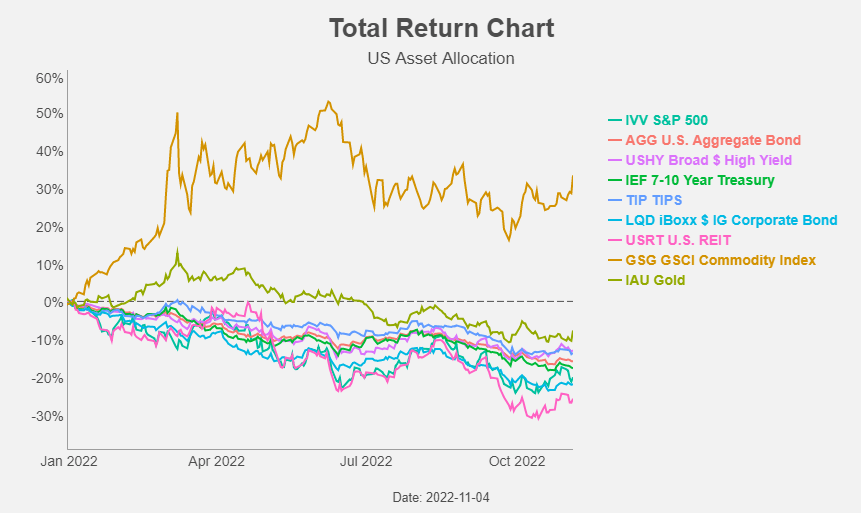
Let’s take a look at the REIT sector performance for some more insight on what happened.
Table 1: REIT performance (Nareit)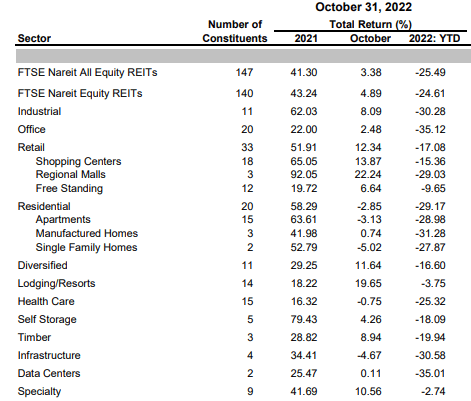
In 2021 the best performing REIT sectors were Industrials, Shopping Centers and Regional Malls, Apartments and Self-Storage.
Figure 7 gives a nice overview of the economic sensitivity and the lease duration of the different REIT sectors.
Figure 7: Economic sensitivity and the lease duration (Cohen & Steers)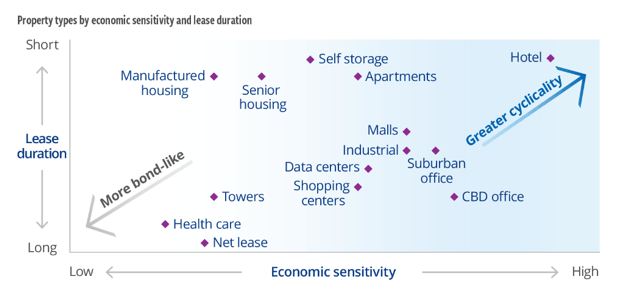
The best performing sectors were those with a high economic sensitivity (with the exception of Office and Hotels who were still struggling after Covid). In 2021 the FED was not yet slowing the economy with rate hikes, so it made sense for those sectors to outperform. Both Apartments and Self-Storage are sectors with a short lease duration which allowed them to quickly adjust rates in response to the uptick in inflation numbers.
This year inflation was no longer “transitory” and the FED started to hike rates in order to slow down the economy and bring inflation back under control.
The best performing sectors this year are Netlease and Hotels. The Netlease sector has a low economic sensitivity and the hotel sector has a very short lease duration.
Listed versus private real estate
REITs are listed real estate equities and in the short term, the performance can be impacted by the performance of equities in general.
Recently the correlation between REITs and equities is indeed high.
Figure 8: Real estate correlations (J.P. Morgan)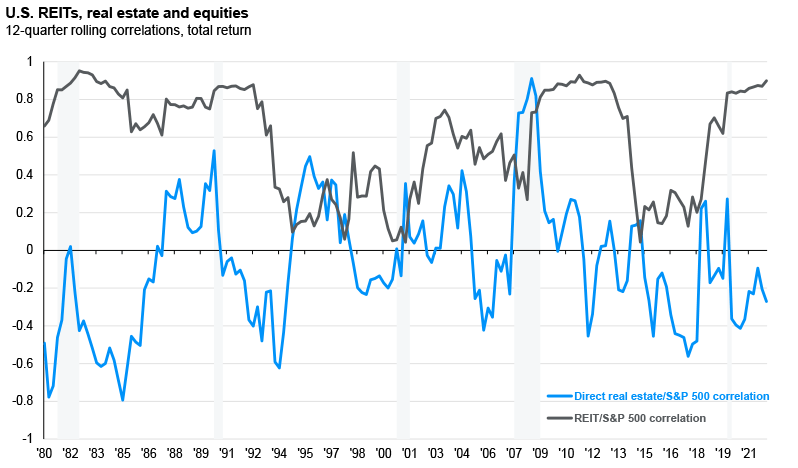
But over time the correlation with private real estate is more important, as both listed and unlisted real estate have the same underlying fundamental drivers.
Figure 9: Listed real estate correlations (Cohen & Steers)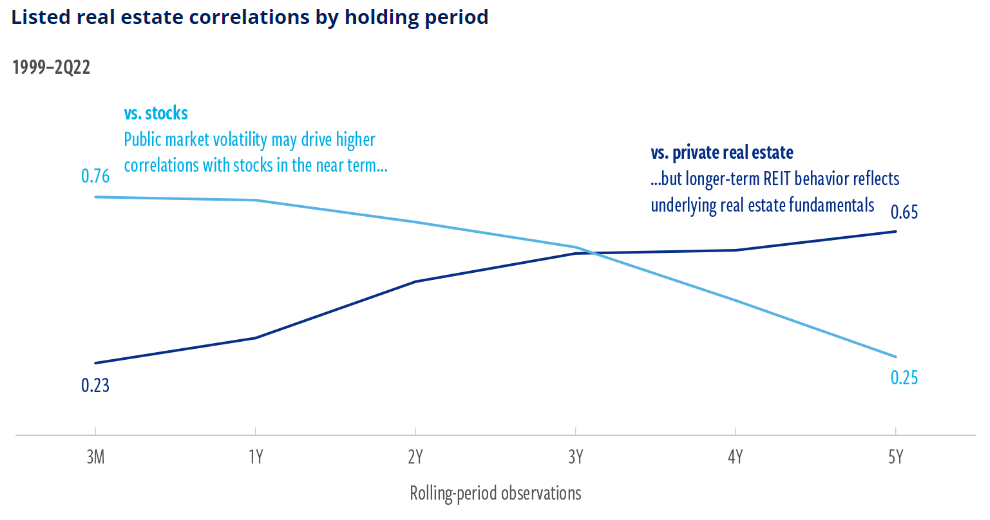
And private real estate performed much better than listed real estate. Figure 10 shows the performance of private versus listed real estate in the first three quarters of this year.
Figure 10: Real estate returns (Nuveen)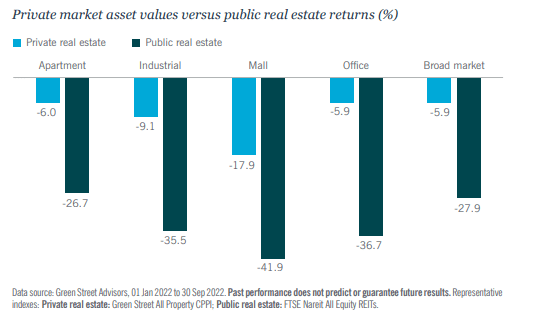
Such difference in performance between listed and private real estate occurred also in previous crisis moments. And on each occasion listed real estate sharply underperformed.
But in the past, such underperformance always created an opportunity for listed REITs to bounce back and sharply outperform private real estate.
Figure 11: Listed vs private real estate (Cohen & Steers)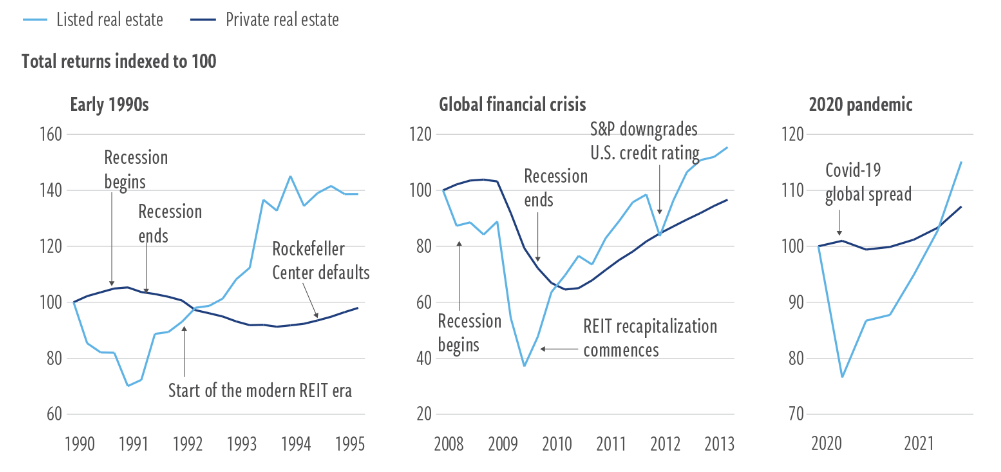
Will this happen again this time? Is an opportunity brewing? Is it time to start looking forward “across the valley”? Are we close to the bottom? It’s always difficult to make that call.
The answer might well depend on the Fed.
Pivot
REITs have historically outperformed broader equities after the end of rate hikes.
Figure 12: Performance after rate hikes (Cohen & Steers)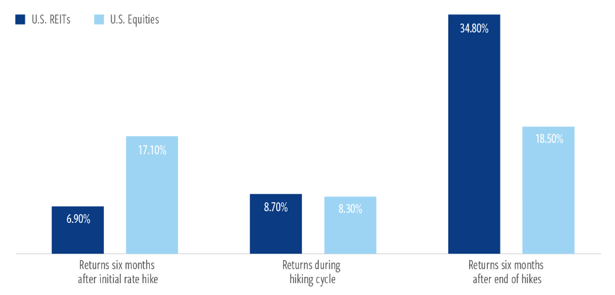
The question is now: when will the Fed end the rate hikes?
Last week the Fed raised rates with 75 bp to 4%. It is expected that the Fed will add another 50 bp in December. What comes after that meeting?
The 2-year Treasury note yield might give us a clue. As the chart below from John Hussman shows there is a close relationship between the 2-year yield and the average fed funds rate over the following 6 months.
Figure 13: 2-year yield vs average fed funds rate (Hussman)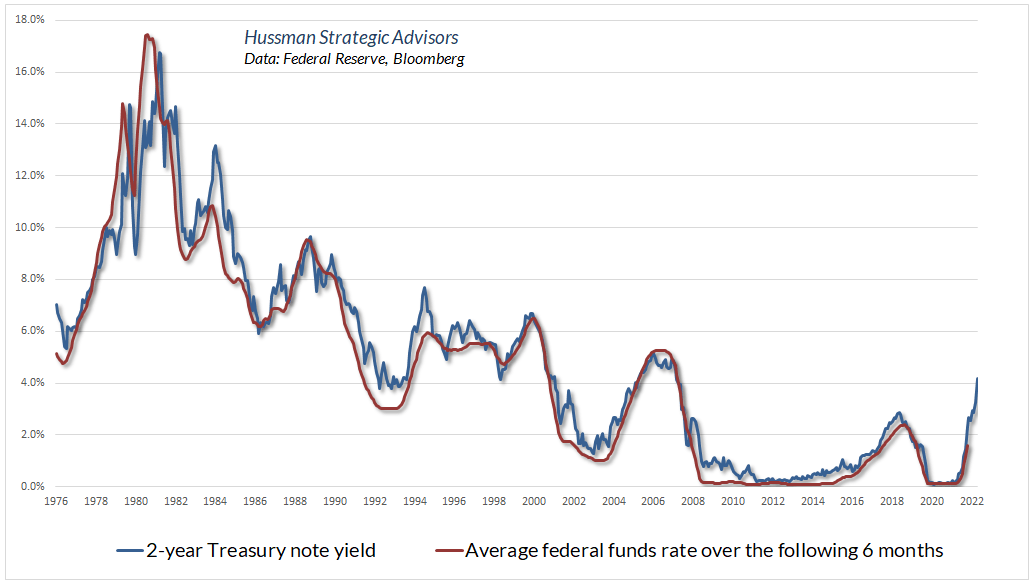
The 2-year yield is now 4.66%. In order for the average fed funds to be in line with this number, we need another 50 bp rate increase at the February meeting, followed by a 25 bp hike in March. This translates into a range of 5 to 5.25% in March.
This is in line with the peak rate that can be deducted from the fed funds futures.
Figure 14: March 2023 target rate probabilities (CME Group)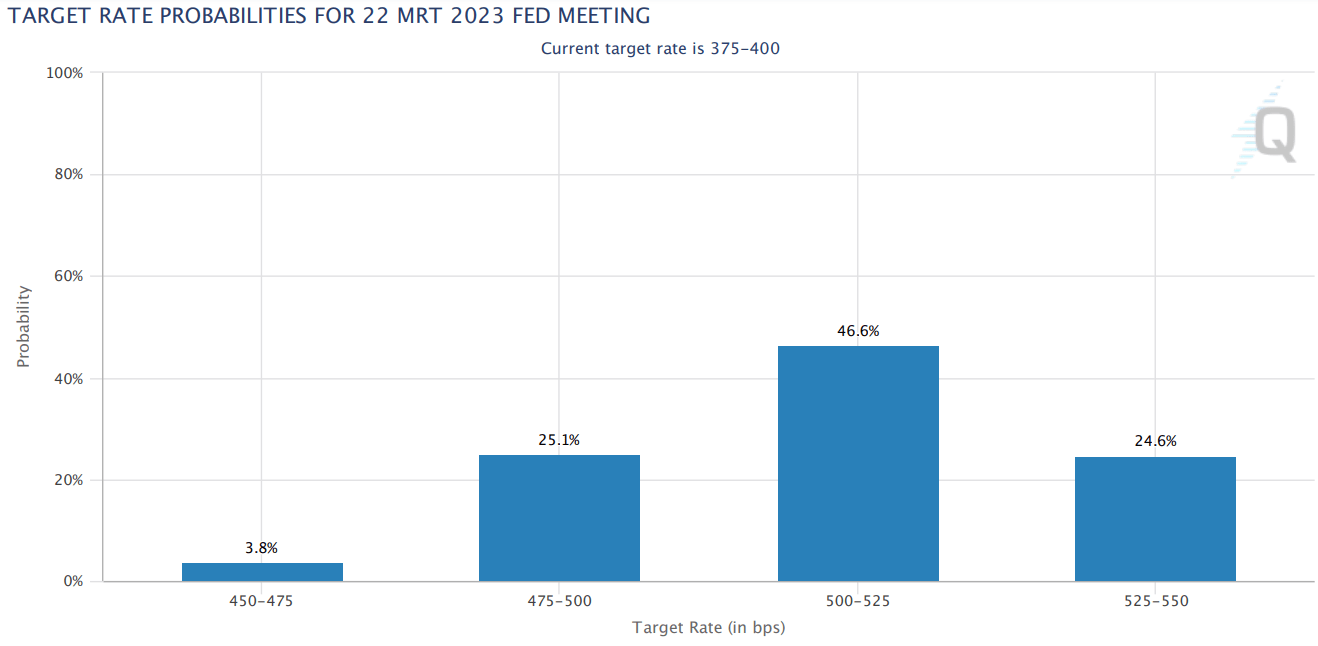
We could double-check this with the FOMC dot-plot, but unfortunately there was no dot plot made available at the FOMC-meeting last week.
The December FOMC-meeting will not be the end of the rate hikes and hence probably not yet the start of the great REIT rebound. Wait and see is the smartest approach here. Our trend analysis confirms this. All the sector REIT ETFs are still in a downtrend.
Table 2: Trends (Yahoo! Finance, Author)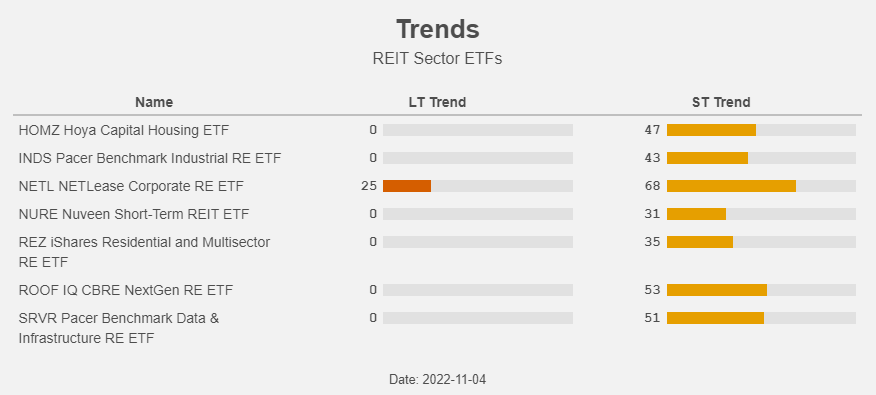
Yet another reason to adopt a wait and see approach.
Which sector?
Inflation might not come down as soon as Powell wishes and this calls for REITs with a short lease duration. Rising rates slow down the economy; so sectors with less economic sensitivity are required.
So we need the sectors in the left upper quadrant of figure 7: Manufactured housing, Senior housing, Self-storage and Apartments. The best-known sector ETF that invests in exactly these sectors is the iShares Residential and Multisector Real Estate ETF (REZ). The latter is partly invested in the Healthcare sector. This is not the case with a new ETF that also invests in our favorite sectors: the Kelly Residential & Apartment Real Estate ETF.
This Kelly ETF started trading in January of this year. Kelly ETFs strives to “create disruptive exchange-traded funds (ETFs) that offers investors the opportunity to capture highly liquid, pure-play exposure to the best-in-class companies identified in each emerging theme or sector”.
Figure 15: Sector breakdown (Kelly ETFs)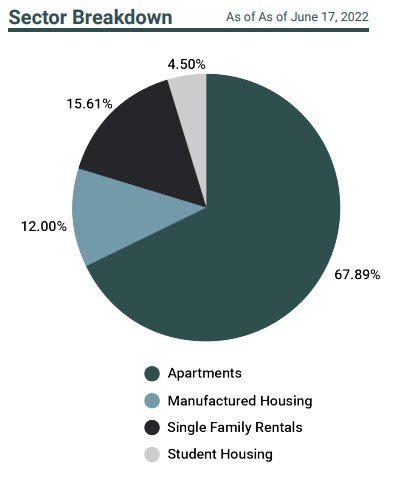
Given that the majority of this ETF is invested in Apartments, it comes as no surprise that the biggest names in the fund are from this sector.
Figure 16: Top 10 holdingsKelly (Kelly ETFs)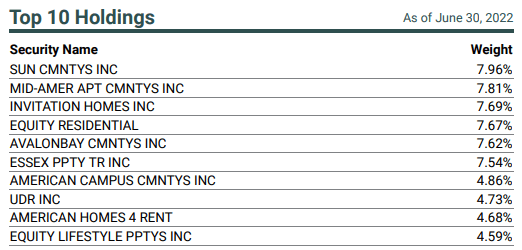
The (gross) expense ratio is quite high at 0.68%, but the net expense ratio is actually 0.00% as fee waivers are in effect until May 1, 2023. We do not exclude that we might encounter a good entry point prior to that date!
Conclusion
REITs were an inflation hedge during 2021, and the sectors with the highest economic sensitivity (like Industrial) or the lowest lease duration (like Residential and Self-Storage) were the top performers.
This year the inflation hedging performance is less stellar as the rising rates are sparking recession fears.
We don’t know if we will get a recession but the rising rates are certainly going to slow down the economy and at the same time, we do not expect inflation to come down fast to the targeted 2%. This environment calls for a preference for REIT sectors with a short lease duration and a low economic sensitivity: Manufactured and Senior Housing, Self-Storage and Apartments. Our preferred ETF in this space is RESI.
But we suggest to adopt a wait and see approach for the following two reasons:
- RESI is – like all other REIT sector ETFs – still in a downtrend.
- REITs tend to outperform after the FED is done hiking rates, but we only expect this to be the case in March next year at the earliest.
Be the first to comment