


will/iStock via Getty Images
In this article, we shall update our view on the economic outlook for South Africa, particularly in light of some important recent developments with regard to the country’s energy sector. The uplift in commodity prices following the Covid-19 pandemic in 2020 provided South Africa with a brief respite from the turbulent and toxic domestic policy cocktail that continues to erode the long-run outlook for the country. The country also seemingly benefitted (at least initially) from the outbreak of hostilities between Ukraine and Russian earlier this year. The outbreak of the conflict provided an uplift to some key commodity exports including coal and Platinum Group Metals (PGMs). As such the currency (Rand) remained relatively resilient for much of 2021 and 2022, while GDP growth recovered in the final quarter of 2021 and first quarter of 2022.
Nevertheless, the return to positive growth has proved to be brief, as a combination of an intensification in rolling blackouts together with rising inflation and interest rates once again helped push the economy back into contraction in the second quarter of 2022.
Q/Q GDP growth – South Africa
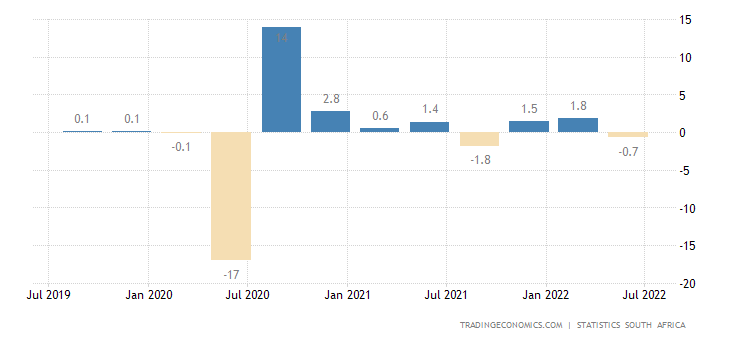
Q/Q GDP growth (Tradingeconomics.com)
Furthermore, the outlook remains bleak and a further contraction in the third and fourth quarters of this year cannot be ruled out. A key leading indicator, the S&P composite PMI for October remained below the key 50 level, signifying an ongoing contraction in economic activity during October.
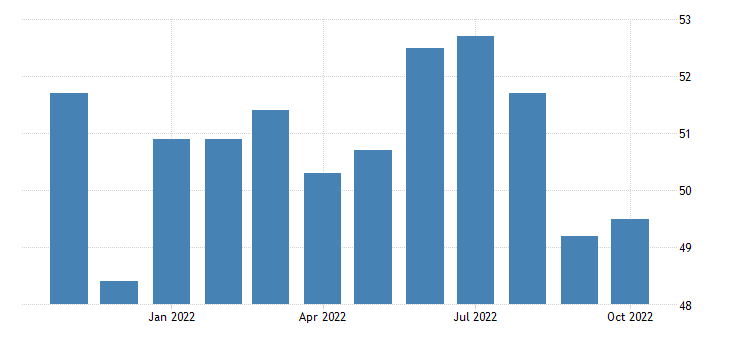
South Africa Composite PMI (Tradingeconomics.com)
The South African central bank’s monetary policy emphasis, largely disconnected from developments in the real economy, has seen interest rates rise to their highest levels since prior to the pandemic
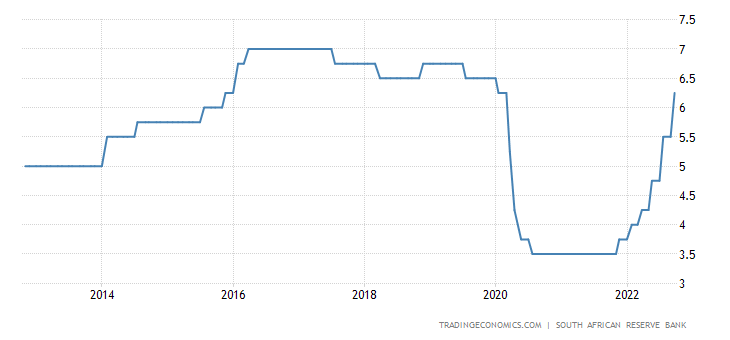
South Africa SARB policy rate (Tradingeconomics.com)
Despite the exogenous nature of the inflation shock that has lifted inflation above its inflation-target this year, further interest rate increases appear to be on the cards. The tightening in monetary policy to pre-pandemic levels comes despite unemployment which remains significantly higher than pre-Covid levels and an economy that has yet to exceed its pre-Covid level in real terms.
SA Unemployment Rate
South Africa Unemployment Rate (Tradingeconomics.com)
The increase in interest rates also comes at a time when the country is experiencing its longest streak of sustained load-shedding (a form of controlled rolling blackouts on record).
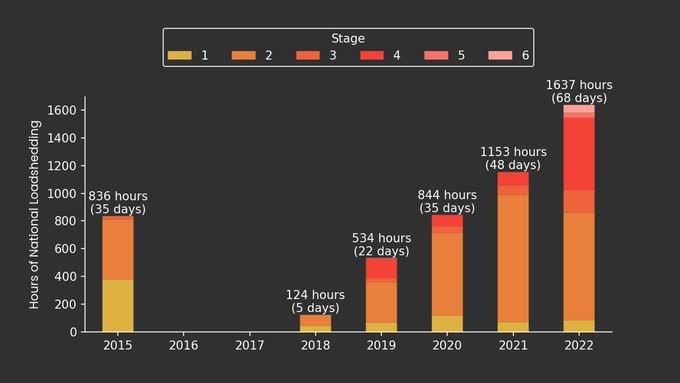
Hours of Loadshedding (@EskomSePush)
Coupled with declining real wage growth, household disposable incomes are likely to remain under pressure and therefore the outlook for consumer spending going forward can only be described as grim. Nominal wage growth amounted to around 4% on a y/y basis in Q2 2022, well below recent inflation readings. Real wages are more or less unchanged over the past four years as we can infer from the chart below.
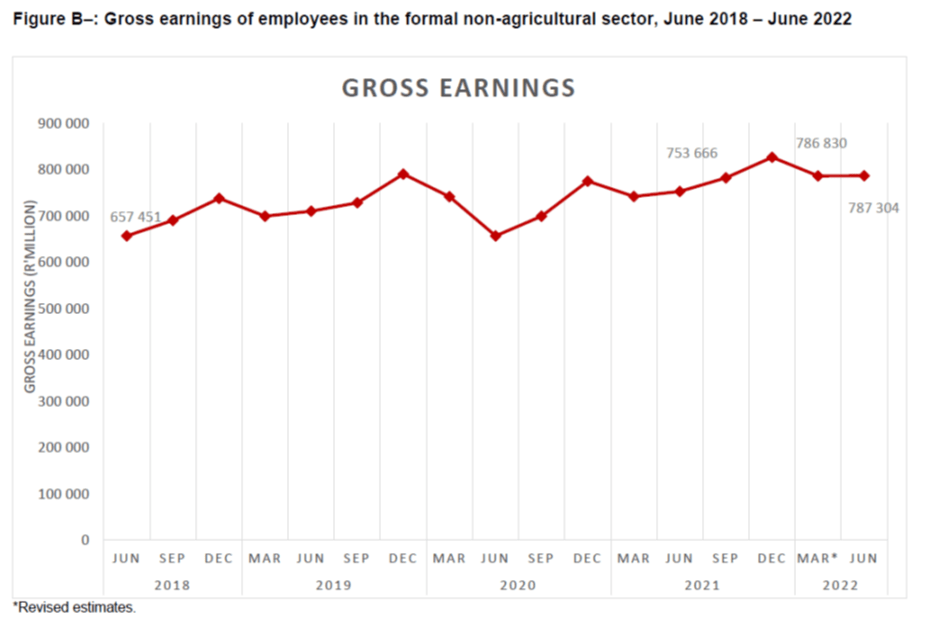
Statistics South Africa
In a nutshell, these headwinds comprising rising unemployment, an intensifying electricity crisis together with a growth constraining policy mix, which have already led to a decade of sub-par economic growth, appears set to continue for the foreseeable future with no light at the end of the tunnel.
The worsening energy crisis
We have written many articles covering these headwinds in the past and we will not revisit them in detail. Particularly important is the ill-advised policy framework or micro-macro policy disconnect that has been adopted by the ruling ANC. The ill effects of this policy disconnect can be observed in many areas of the economy, but nothing better encapsulates this incongruous policy mix than the evolving debacle in the country’s electricity sector and the state-owned utility Eskom.
Corruption and poor management during the Zuma years not only led to a lengthy delay (not to mention cost overruns) in the completion of two new large coal-fired power plants, but also saw them completed with key design faults which have limited their ability to operate at the stated nameplate capacity of 9,000 MW (combined). Given that 9,000 MW is almost a third of the country’s peak demand requirements, it underscores what a serious setback these design flaws have been.
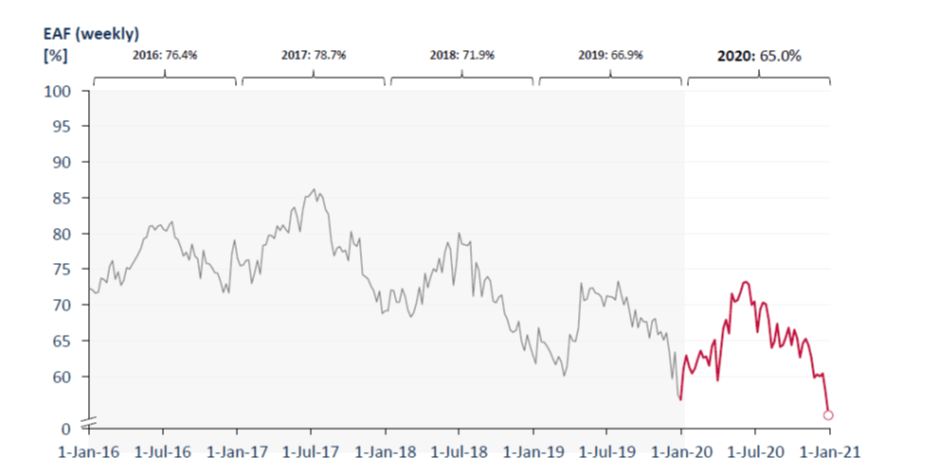
The limited operational capacity from these two new coal-fired power plants coupled with limited routine maintenance on Eskom’s remaining and much older coal fleet (average age around 40 years) has inevitably led to an increase in unplanned capacity outages which has reduced Eskom’s effective capacity factor to a record low as indicated in the chart below.
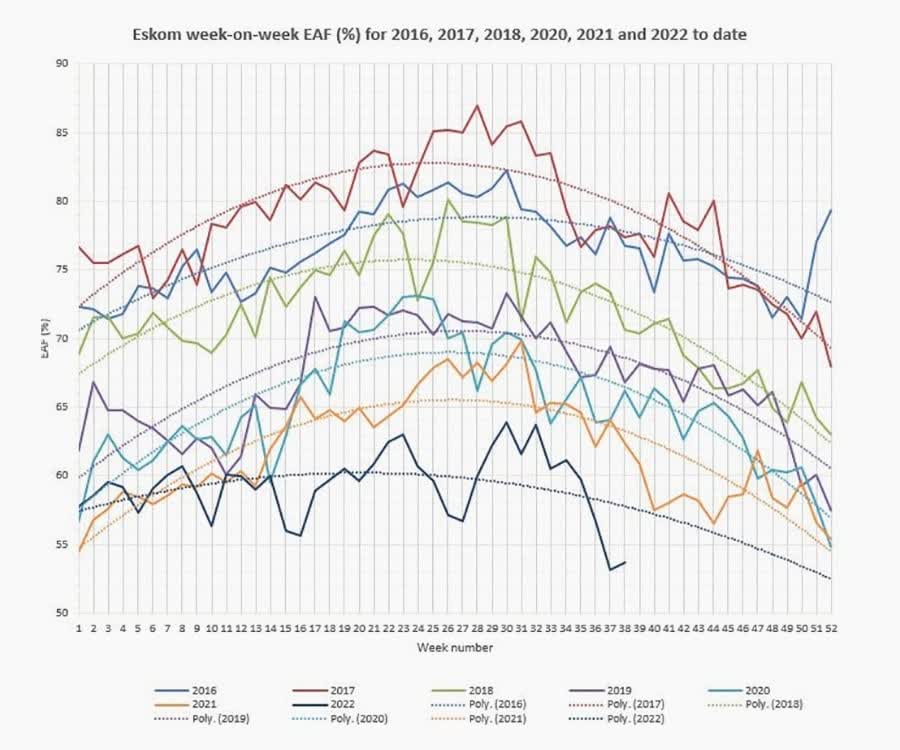
Eskom Factor Availability (Mybroadband.co.za)
The current administration priority in terms of fiscal policy appears to be targeted at appeasing major ratings agencies and persuading them to upgrade the country’s sovereign debt ratings despite evidence that a higher rating or an investment grade rating would not have any discernible impact on the yields at which the country’s bonds trade at in the capital markets.
With a large and intractable public sector wage bill (micro structural rigidities), the treasury has been forced to cut expenditure in key areas such as capital investment while also limiting the amount of additional funds that could be given to Eskom for a more comprehensive maintenance program. Instead, Eskom’s financial burden will likely once again fall to consumers via a series of large tariff hikes over the next few years. For the 2023 tariff cycle, Eskom is requesting a 32% tariff increase.
Such a large tariff hike will further undermine the competitiveness of the mining and manufacturing sectors, while also placing further pressure on household incomes. It is also doubtful that the increase in revenues from such a large tariff hike will be used for an upscaled maintenance program given that the current Eskom leadership as well as the Ramaphosa administration appear to favour the country’s renewable energy lobby, while trying to appease global climate change activists. Instead, any additional revenues from these large tariff hikes are likely to be used to support the country’s planned large rollout and investment in renewable infrastructure.
As such, the country is very likely entering a period where it may have to endure markedly higher electricity tariffs AND sustained controlled rolling blackouts. Given this scenario it is exceedingly challenging to construct a scenario where the economy will generate any positive real growth. Coupled with a youthful population and therefore growing labour force, a further dramatic rise in the unemployment rate in the years ahead seems assured.
Nevertheless, in financial circles (not on the street) there remains an enduring optimism that the “energy transition” the country is embarking on will not only eventually solve the country’s energy crisis, but also prove to be a catalyst for a new period of sustained economic growth. Therefore, it is only fair that we assess the current energy plan and some of the reforms that have been announced and judge, whether or not our pessimistic prognosis is justified.
Eskom’s New Energy Roadmap
Under its current leadership, Eskom has essentially signaled its intention to step back from baseload power generation, with the exception of completing the technical faults at the aforementioned Medupi and Kusile by 2024. Rather, this leadership expects to play a role in facilitating large-scale private investment into new power generation, specifically renewables such as solar and wind. Superficially this appears to make sense. Privately funded power generation will in theory alleviate the Eskom balance sheet from further funding strains (and therefore the sovereign), while wind and solar on a standalone basis is touted as the cheapest form of electricity generation.
Given the right tariff structures and ability to sell all they produce as they produce it, building solar and wind power is an attractive proposition for private capital (and their bankers). Recent reforms which have lifted the regulatory cap on embedded power projects also makes it attractive for larger companies to build their own power plants, specifically solar. As such, there is now a growing and large pipeline of likely renewable projects that will get built out over the next 10 years.
In terms of the government’s existing 2019 integrated resource plan, a likely further 5,000 MW of renewable power projects will be built before the end of the decade by Independent Power Producers (IPPs) and perhaps even more. In addition, recent reports suggest that another 6,000MW in predominately renewable power could be built as result of the lifting of the embedded regulatory cap. As an example, global mining giant Anglo American earlier this year said it aims to buildout between 3,000 and 5,000 MW of renewable power in order to supply its South African mining operations with internally generated power within the next 10 years.
So conservatively, we can probably pencil in the buildout of around 10,000 MW of renewable power in the country by 2030. It should be noted this figure is significantly below the figure as earmarked by Eskom’s recently released “Just Transition Plan” or JPT which calls for the construction of upwards of 50,000 MW of renewable energy by 2032 in order to enable the retirement of a large portion of the existing coal-fired power plant. It is not clear where the funding for such a massive buildout will come from, but that is the official line at present.
On the surface this seems like a positive development which should solve the country’s energy crisis. But will it? We are not convinced. As we can see in the chart below, the capacity factors for solar power, although quite predictable, moves from 0% (at night) to as high as 70%-80% on some days during the middle of the day, before declining back to 0% as evening approaches. Wind does not vary as predictably during the course of one day, but is more erratic from one day to the next.
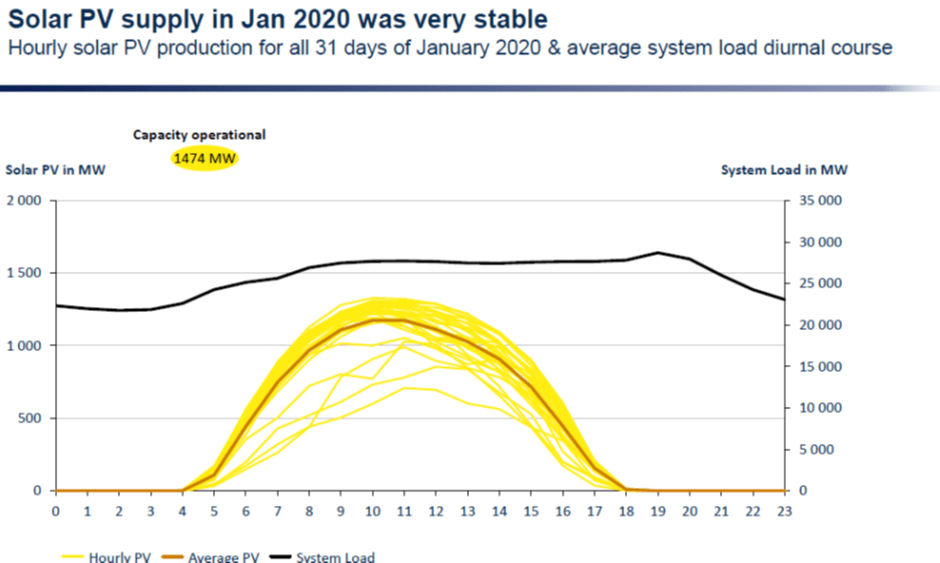
CSIR
Let us fast forward then to 2030 and see what would in theory happen with just 10,000 MW (not 50,000MW) of renewable solar added to the grid (for simplistic reasons we will assume that the additional renewable capacity is all solar). We will also assume the demand for electricity has remained unchanged. Turning now to the chart below, which shows the evolution of power demand during a 24-hour period (RSA contracted demand or the purple line) we can see how peak demand (between 32,000 MW and 35,000 MW in the winter months) generally tends to peak around 6PM in the evening. Coincidentally this occurs just as the daily solar capacity factor reaches 0%.
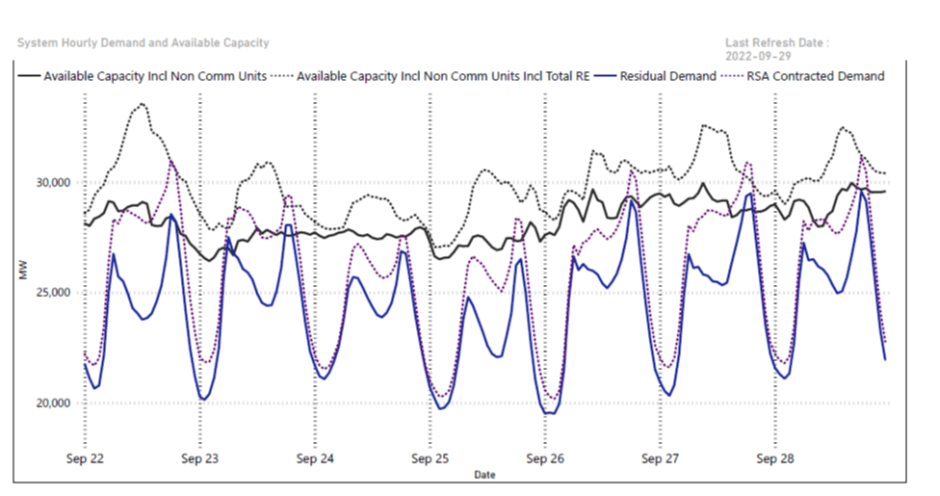
CSIR
We can also see in this same chart how daily power demand tends to make a secondary trough between 1PM and 2PM before the evening spike. Based on this data as an example, this secondary demand trough translates to around 24,000 MW. The secondary demand trough roughly coincides with the daily peak in the solar capacity factor. So in a scenario where we have 10,000 MW of solar power capacity, its possible the system could generate as much as 7,000 MW in solar power when demand experiences its secondary trough, leaving a residual demand of only around 17,000 MW to be temporarily supplied by the non-renewable baseload power fleet.
The power required to be supplied by the baseload power fleet will then rise very sharply from 17,000 MW to almost double or 34,000 MW during the evening peak. What can the existing baseload power fleet actually supply? Well as we can see below a combination of poor management and limited maintenance has led to the availability factor of the existing power fleet (mainly older coal-fired power stations) declining to below 60% from a level above 80%.
CSIR
Excluding renewables, but including hydroelectric pumped storage as well as diesel/gas peaking plants, Eskom’s exiting installed capacity is around 45,000 MW. We assume in this estimation that the parastatals oldest and most troublesome coal-fired power plants such as Komati and Camden will have been retired. We also assume that the technical issues at the two new coal-fired power plants will be addressed in this estimation. If we generously assume some improvement in maintenance and a recovery in the availability factor to around 65%, it implies a total available capacity during the evening peak of roughly 29,000 MW.
If we generously also assume that wind power reliably adds around 1,000 MW to the grid during the evening peak by 2030, this leaves the grid’s total supply capacity at around 30,000 MW vs a daily peak of between 34,000 MW and 35,000 MW (which in turn assumes zero growth in electricity demand). In short, even with the successful buildout of more than 10,000 MW of renewable energy by 2030, there will still be a need for controlled rolling blackouts in the early evening.
There are other risks too. Firstly, some of these coal-fired power stations by 2030 will be 50 years old. How well will they manage to rapidly ramp-up power generation from less than 50% of capacity to full capacity, effectively twice a day? We are not experts in running a utility, but to our mind it must create more operational risk and wear and tear. Secondly, this scenario is only likely to further undermine the financial position of Eskom. Technically the parastatal will forgo revenues from some 7,000 MW of potential power it could have supplied between 10AM and 2PM when the capacity factor of the solar power stations increases to their daily maximum of around 70%.
Ultimately, the current “roadmap” will not solve the energy crisis despite the potential investment of up to ZAR 1trn in renewable energy over the next decade. It will also not solve the financial crisis Eskom finds itself in (and may in fact exacerbate it), while ironically limiting the ability of Eskom to retire any of its much-maligned older coal-fired power plants. Retiring any additional coal capacity between now and 2030, will only widen the supply shortfall that will still occur during the evening peaks.
Can Storage fill the gap?
Renewable fanatics tend to dismiss concerns regarding intermittency by advocating the buildout of additional storage, typically battery storage. Fair enough, but we need to be mindful that this is of course a very expensive solution. Based on some of the data we have seen, if we assume the installation of a 5,000 MW battery solution for 4-5 hours (able to discharge 5,000 MW for four hours each day), it would cost in the region of $18bn or ZAR 320bn.
This would essentially equal the cost of the two new coal-fired power stations Kusile and Medupi with the nameplate baseload (so 24 hours per day) capacity of 9,000 MW. Given the parlous state of Eskom’s finances and the reluctance of the national treasury to advance more funding to Eskom, a key question is who would finance the installation of such an expensive storage system. South Africa does have scope for the further installation of comparatively cheaper hydro pumped storage, but even here based on past experience the cost of 3,000 MW of pumped storage could equal as much as ZAR 100bn.
Another often overlooked cost factor when it comes to the envisaged renewable buildout in South Africa, is the very large investment in an expanded transmission network that will need to be made. Most of the geographic areas which are prospective for solar and wind power are located in regions which currently have limited access to the power grid. This additional investment, simply to accommodate renewables, has conservatively been estimated at around ZAR 200bn.
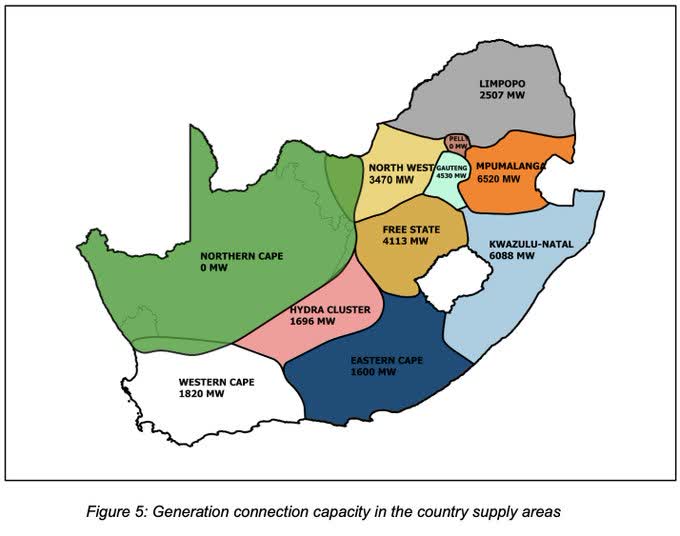
Transmission Capacity Per Region (Eskom)
Storage could theoretically fill the gap and ensure that rolling blackouts are no longer required by 2030, but it would come at significant cost and if these costs were to be borne by IPPs, it may require higher feed-in tariffs than the current cost of electricity. In our opinion, given the relative economic attractiveness, it is very likely that a majority of the renewable projects will be completed BEFORE ANY work on any of the proposed storage projects get underway.
Furthermore, even if these storage projects are completed by 2030 under an optimistic scenario, it will still not solve the longer-term energy crisis. By 2030 roughly 9,000 MW of the existing coal-fired power fleet will be 55 years old or older. The replacement of 9,000 MW of baseload (24-hour availability) power under the current energy policy (which does not allow any new coal or nuclear power plants to be built) would require a further vast sum of additional funding, well beyond the capacity of both Eskom and the sovereign balance sheet.
As an example, based on the recent approved Scatec project which will see the construction of 150 MW baseload equivalent solar and storage capacity for an estimated cost of R16bn, it would in theory require an additional ZAR 1trn to replace 9,000 MW coal-fired baseload by 2030. Furthermore, no one seems to be concerned with the issue of degradation when it comes to utility scale battery storage systems. Much like smartphone (and Electric vehicles) batteries, their storage capacity will very likely degrade over time. This will limit their useful life and even if they were sufficiently reliable for 15 to 20 years, this is still a useful life of half of the average coal, gas or nuclear power plant.
Realistically therefore, renewables and battery storage will never solve the energy crisis, which implies a potentially widening supply gap by 2030, despite the large scale private sector buildout in renewable power expected over the next 10 years. Furthermore, if Eskom’s older coal-fired power stations still have to be retired by the early 2030s for operational reasons, it points to a baseload peak supply gap of up 9,000 MW. Taking into account the volatile intra-day usage of Eskom’s ageing coal fleet coupled with likely additional retirements by 2030, it suggests to us that during the daily peak demand period (4PM to 8PM) the actual supply shortfall could easily reach levels of around 7,000 to 8,000 MW.
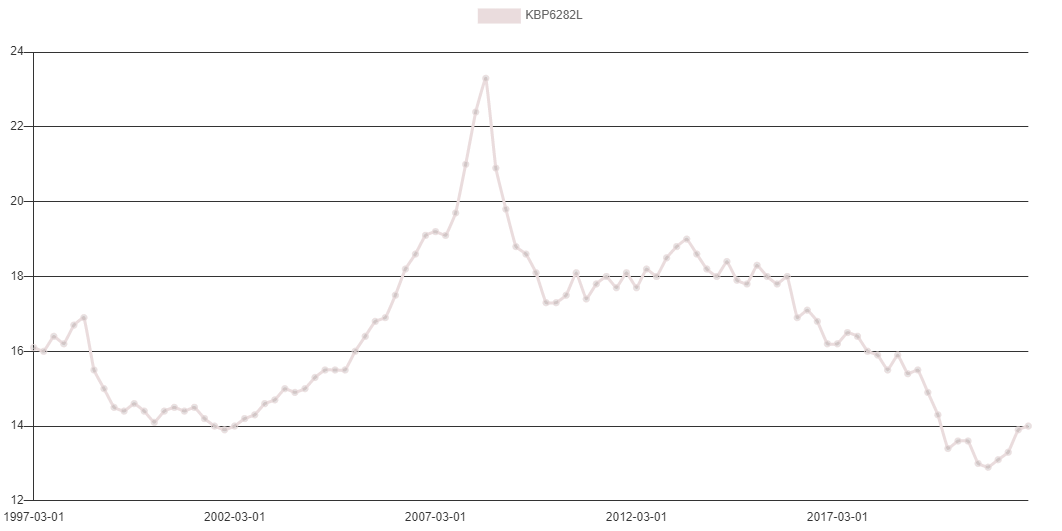
This would result in daily controlled rolling blackouts during the daily time period that would be even more severe (affect a large proportion of electricity consumers) than anything the country has experienced thus far. As such, the country’s electricity crisis is likely to remain a significant headwind for economic growth and job creation well into the 2030s. Particularly hard hit will be the country’s smaller manufacturing companies. As the chart below shows, manufacturing output remains some 10% lower than the levels reported more than 15 years ago, while the sector has also shed more than 600,000 jobs since 2008.
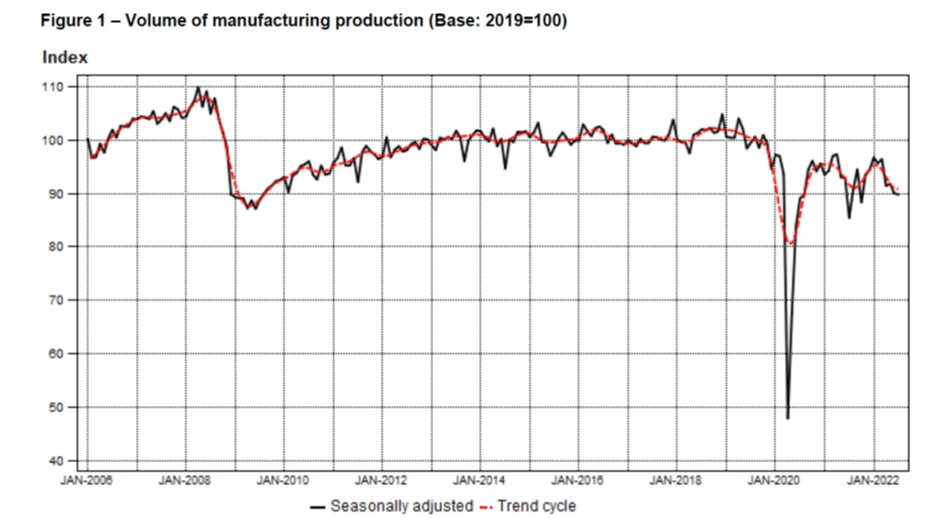
Manufacturing Output South Africa (Statistics South Africa )
Meanwhile, the pressure on Eskom’s finances will probably force the regulator to keep awarding the troubled state-owned utility company annual tariff increases in excess of 10% per annum. This will continue to burden household disposable incomes and result in elevated pass-thru inflation. Elevated direct and indirect inflation from these electricity tariff increases will make it difficult for the central bank to succeed in its ambition of reaching a new lower inflation target of 3%.
It effectively means raising rates to a level where it would sufficiently depress domestic demand in order to pressure the rate of inflation for those components in the inflation-basket not directly or closely linked to electricity tariffs to well below 3%. This would be the only way for the central bank to achieve an overall or average inflation target of 3%. Or more ominously, should they stubbornly persist in this ambition it would lead to persistently tight monetary policy, which would in turn act as another headwind for economic growth and job creation.
Is there a silver lining?
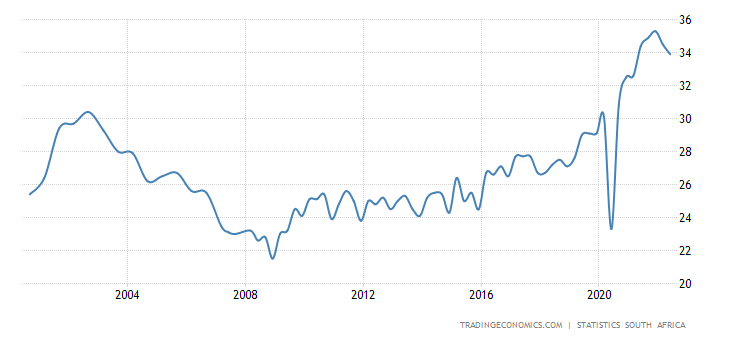
As we have pointed out in this article, given the relative economic attractiveness of solar power (excluding storage backup), coupled with the lifting of the cap on embedded power projects, it is very likely that as much as 10,000 MW of renewable power will still be built out over the next eight years. This could lift the country’s depressed fixed investment rate by about 1% (as % of GDP) per annum, while boosting demand in the construction sector. As the chart below shows, after peaking above 20% of GDP during the last commodity boom in 2008, fixed capital formation slumped to a multi-decade low during the pandemic. Although there has been a modest recovery over the past year, fixed investment remains lower than at anytime since the end of Apartheid in 1994.
Fixed Investment as a % of GDP (South Africa)
SARB
Years of suppressed fixed investment have been a key driver in the country’s inability to create employment and implies low productivity in the years ahead, making it challenging for the country to generate sustained real growth above 3%, a level required for a sustained decline in the country’s unemployment rate. Although welcome, the renewable buildout raising the country’s fixed investment ratio by 1% or 2%, back to roughly 15% – 16%, will nevertheless not be sufficient to overcome these economic headwinds.
Furthermore, the renewable buildout will be import intensive, with a foreign import component of as much as 50%, implying a further widening in the current account by at least 0.5%. Although this is not significant, lacklustre domestic growth will very likely limit foreign investment flows into South Africa, suggesting that even a small current account deficit could place sustained pressure on the currency.
As the chart below shows, the rise in energy prices (primarily oil and refined oil products) has seen the country’s current account slip back into deficit, despite elevated prices for some key export commodities such as coal.
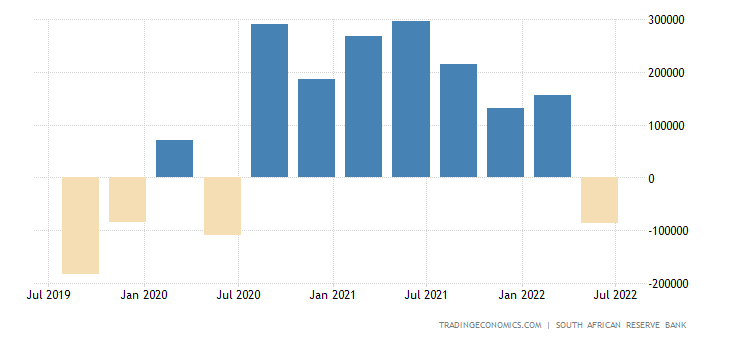
Current Account South Africa (Tradingeconomics.com)
Conclusion
Given these dynamics, the most significant beneficiaries of recent changes to regulations are likely to be very large corporations in the manufacturing and mining sector that export most of their production. They will have the capital to buildout renewable (mainly solar) embedded power plants and without the obligation for backup storage, this will result in meaningful cost savings on their electricity bills. Their reduced dependence on Eskom may also limit the negative impacts of the controlled rolling blackouts. In fact, companies that already produce a large portion of their own electricity internally, may be able to become completely independent of Eskom and insulated not only from any power outages, but also rising electricity tariffs. Relevant examples that come to mind include OMNIA and SAPPI.
Even the very energy intensive gold and PGM mining companies could benefit from building their own renewable power plants and several have already publicly outlined such plans. Although many mining companies now operate around the clock and will therefore find it impossible to be truly independent of Eskom, the cost savings overtime could offset much of the negative impact from increases in regulated tariffs.
Unfortunately, these larger corporations are unlikely to be significant drivers of job creation. Many of their operations are now highly mechanised with limited labour requirements. The key drivers of job creation are the small and medium business sectors, especially those operating in the service industry. Given the economic headwinds discussed in this article, they will remain under pressure from a financial and operational standpoint as will new business formation, thus limiting job growth. As such, investors who still want to invest (or have no choice) in South Africa should probably limit their allocation of capital to larger mining and manufacturing companies that will benefit from a weaker currency and have the ability to navigate the country’s energy challenges.
Be the first to comment