

Ralf Geithe
Introduction
Renewable Natural Gas (RNG) is commercial pipeline quality gas, created by processing the gases that arise from the decay of organic material. The most important sources are landfills and large livestock operations.
RNG may be burned on site, compressed as natural gas fuel (CNG) for vehicles, or injected into a natural gas pipeline.
I wrote an overview article on RNG two years ago. I’d recommend it as an introduction if you are not familiar with RNG.
To summarize the conclusions from that article:
- RNG volume is small, much less than 1% of US natural gas demand
- 15x growth appears feasible, might reach 3% of demand
- production costs are high, above the market price of natural gas
- marketable environmental credits improve the business case
- utilities and midstream will be agnostic users – gas is gas
In this article, we’ll update that analysis to look at recent data, environmental credits, half a dozen companies active in the space including some recent large investments, and provide some thoughts for investors.
Investment Thesis
Over the last two years, RNG has attracted significant capital; both the number of production facilities and the volume of gas produced have increased.
RNG is relatively high cost gas, typically well above even the higher natural gas prices seen in recent months. However, environmental credits earned from RNG production may substantially exceed the market value of the gas; one CEO characterized the effect of credits on project economics as “it’s like magic”.
In addition, social and political preferences for RNG may attract investment, particularly from large public companies seeking to improve their ESG scores.
Investors may find interesting opportunities among smaller public companies with a significant RNG focus.
Facility and Production Volume Data
Data is reported in various units. M means thousand, MM means million. For our purposes, 1 cubic foot “cf” of gas is 1000 BTU. Thus 1000 cf = 1 MMBTU. RNG production is often reported at annual rates.
CNG is usually sold in Gasoline Gallon Equivalent “GGE” units. One GGE is 127 cf of natural gas, so ~ 8 gallons of CNG per MMTBU. See here for more explanation.
Production Volume Estimate
The Kinder Morgan 2021 ESG Report provides a recent estimate on the scale of RNG production in the US.
WoodMackenzie estimates that the U.S. produced 212 MMcf/d of RNG in 2021, accounting for 0.2% of 2021 U.S. natural gas production. Between landfills, dairy farms, swine farms, and other RNG sources, WoodMackenzie estimates U.S. RNG production may increase to 3.2 Bcf/d by 2050.
Converting units, 212 MMcf/day = 77.4 million MMBTU/year, fairly consistent with the data below.
Argonne National Labs RNG Data
Argonne National Labs funds an annual assessment of US RNG projects and updates to a project database. The 2021 assessment, released March 2022, shows 230 RNG production facilities now operating (up 46% from 2020), 108 projects under construction (up 42%), and ~ 80 projects in various stages of planning. They document an estimate of 74 million MMBTU per year of RNG production at 31 Dec 2021 (up 24% from a year earlier), with an additional 21 million MMBTU under construction.
The first two tables below provide more detail on the operational projects and the projects under construction.
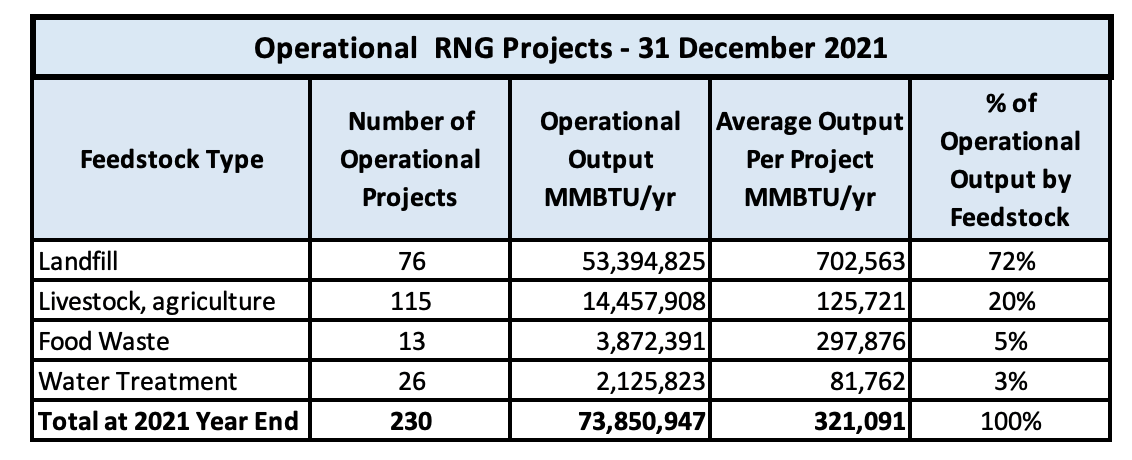
RNG Operational Facilities (table by author, data Argonne Labs)
Landfills dominate RNG production, both by volume share and per site. The last two categories, Food Waste and Water Treatment, contribute little.
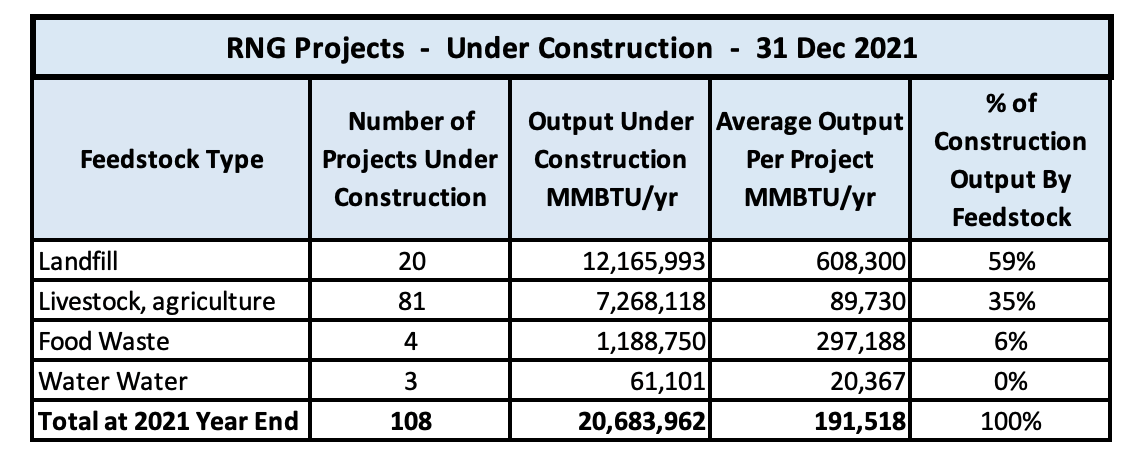
RNG Under Construction Facilities (Table by author, data Argonne Labs)
The “under construction” data is interesting, with livestock dominating new sites 4:1, but because of relatively small volume per site, having much less impact on total volume. Note that the average per site output for new sites is less than the average for existing sites. It appears that, on average, the RNG effort is now developing sites with smaller potential.
The third table (below) combines operational and under construction to estimate the situation we might see at end-of-year 2022, assuming all the under construction projects were completed. We’ll use that here as the estimate for year end 2022.
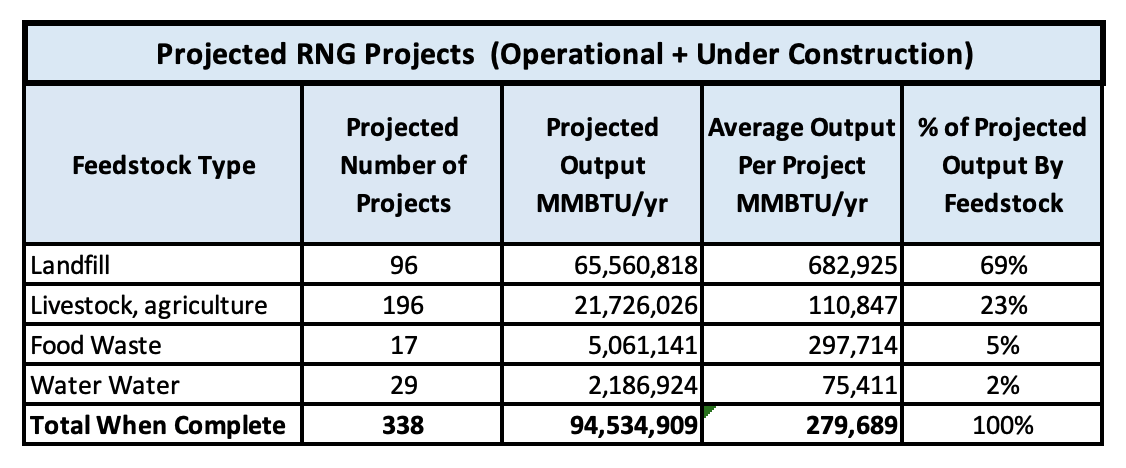
RNG Facilities – Projected 2022 (Table by author, data Argonne Labs)
Landfill continues to dominate volume both by total (69%) and per site. Livestock increases from 50% to 58% of RNG generation sites.
A general observation is that none of these sites individually produce large amounts gas. RNG production volumes are often described by annual rates. For example, the current livestock average output of 125,000 MMBTU per year is 342 MMBTU or 342 MCF per day.
It’s probably fair to say production per site is roughly equivalent to a mediocre gas well a few years into depletion. On the other hand, while landfills have a limited life, there is no reservoir depletion curve for dairy herds.
EPA Data – Landfills
The US Environmental Protection Agency (EPA) maintains a database (the aggregate database on this page) of currently active Land Fill Gas (LFG) projects. Per the August 2022 update, they report 538 active projects in 491 landfills, producing 908 million cubic feet per day “MMCF” of gas, or 908,000 MCF. Note that not all LFG projects produce RNG, and when they do, only a fraction of LFG volume is RNG. The EPA estimates that there are another 470 landfills that could produce economically useful volume of LFG.
A separate database on the same page reports 86 projects under construction or planned, with 505 MMCF collected, of which 181 MMCF (36%) is flared.
An example of one of the larger current RNG construction projects is the Mallard Ridge Landfill in Delavan, Wisconsin, owned by GFL Environmental (TS:GFL), which collects and flares 4.1 MMCF. The project start date was 30 June 2022, with the gas planned for pipeline injection. It’s one of several GFL projects.
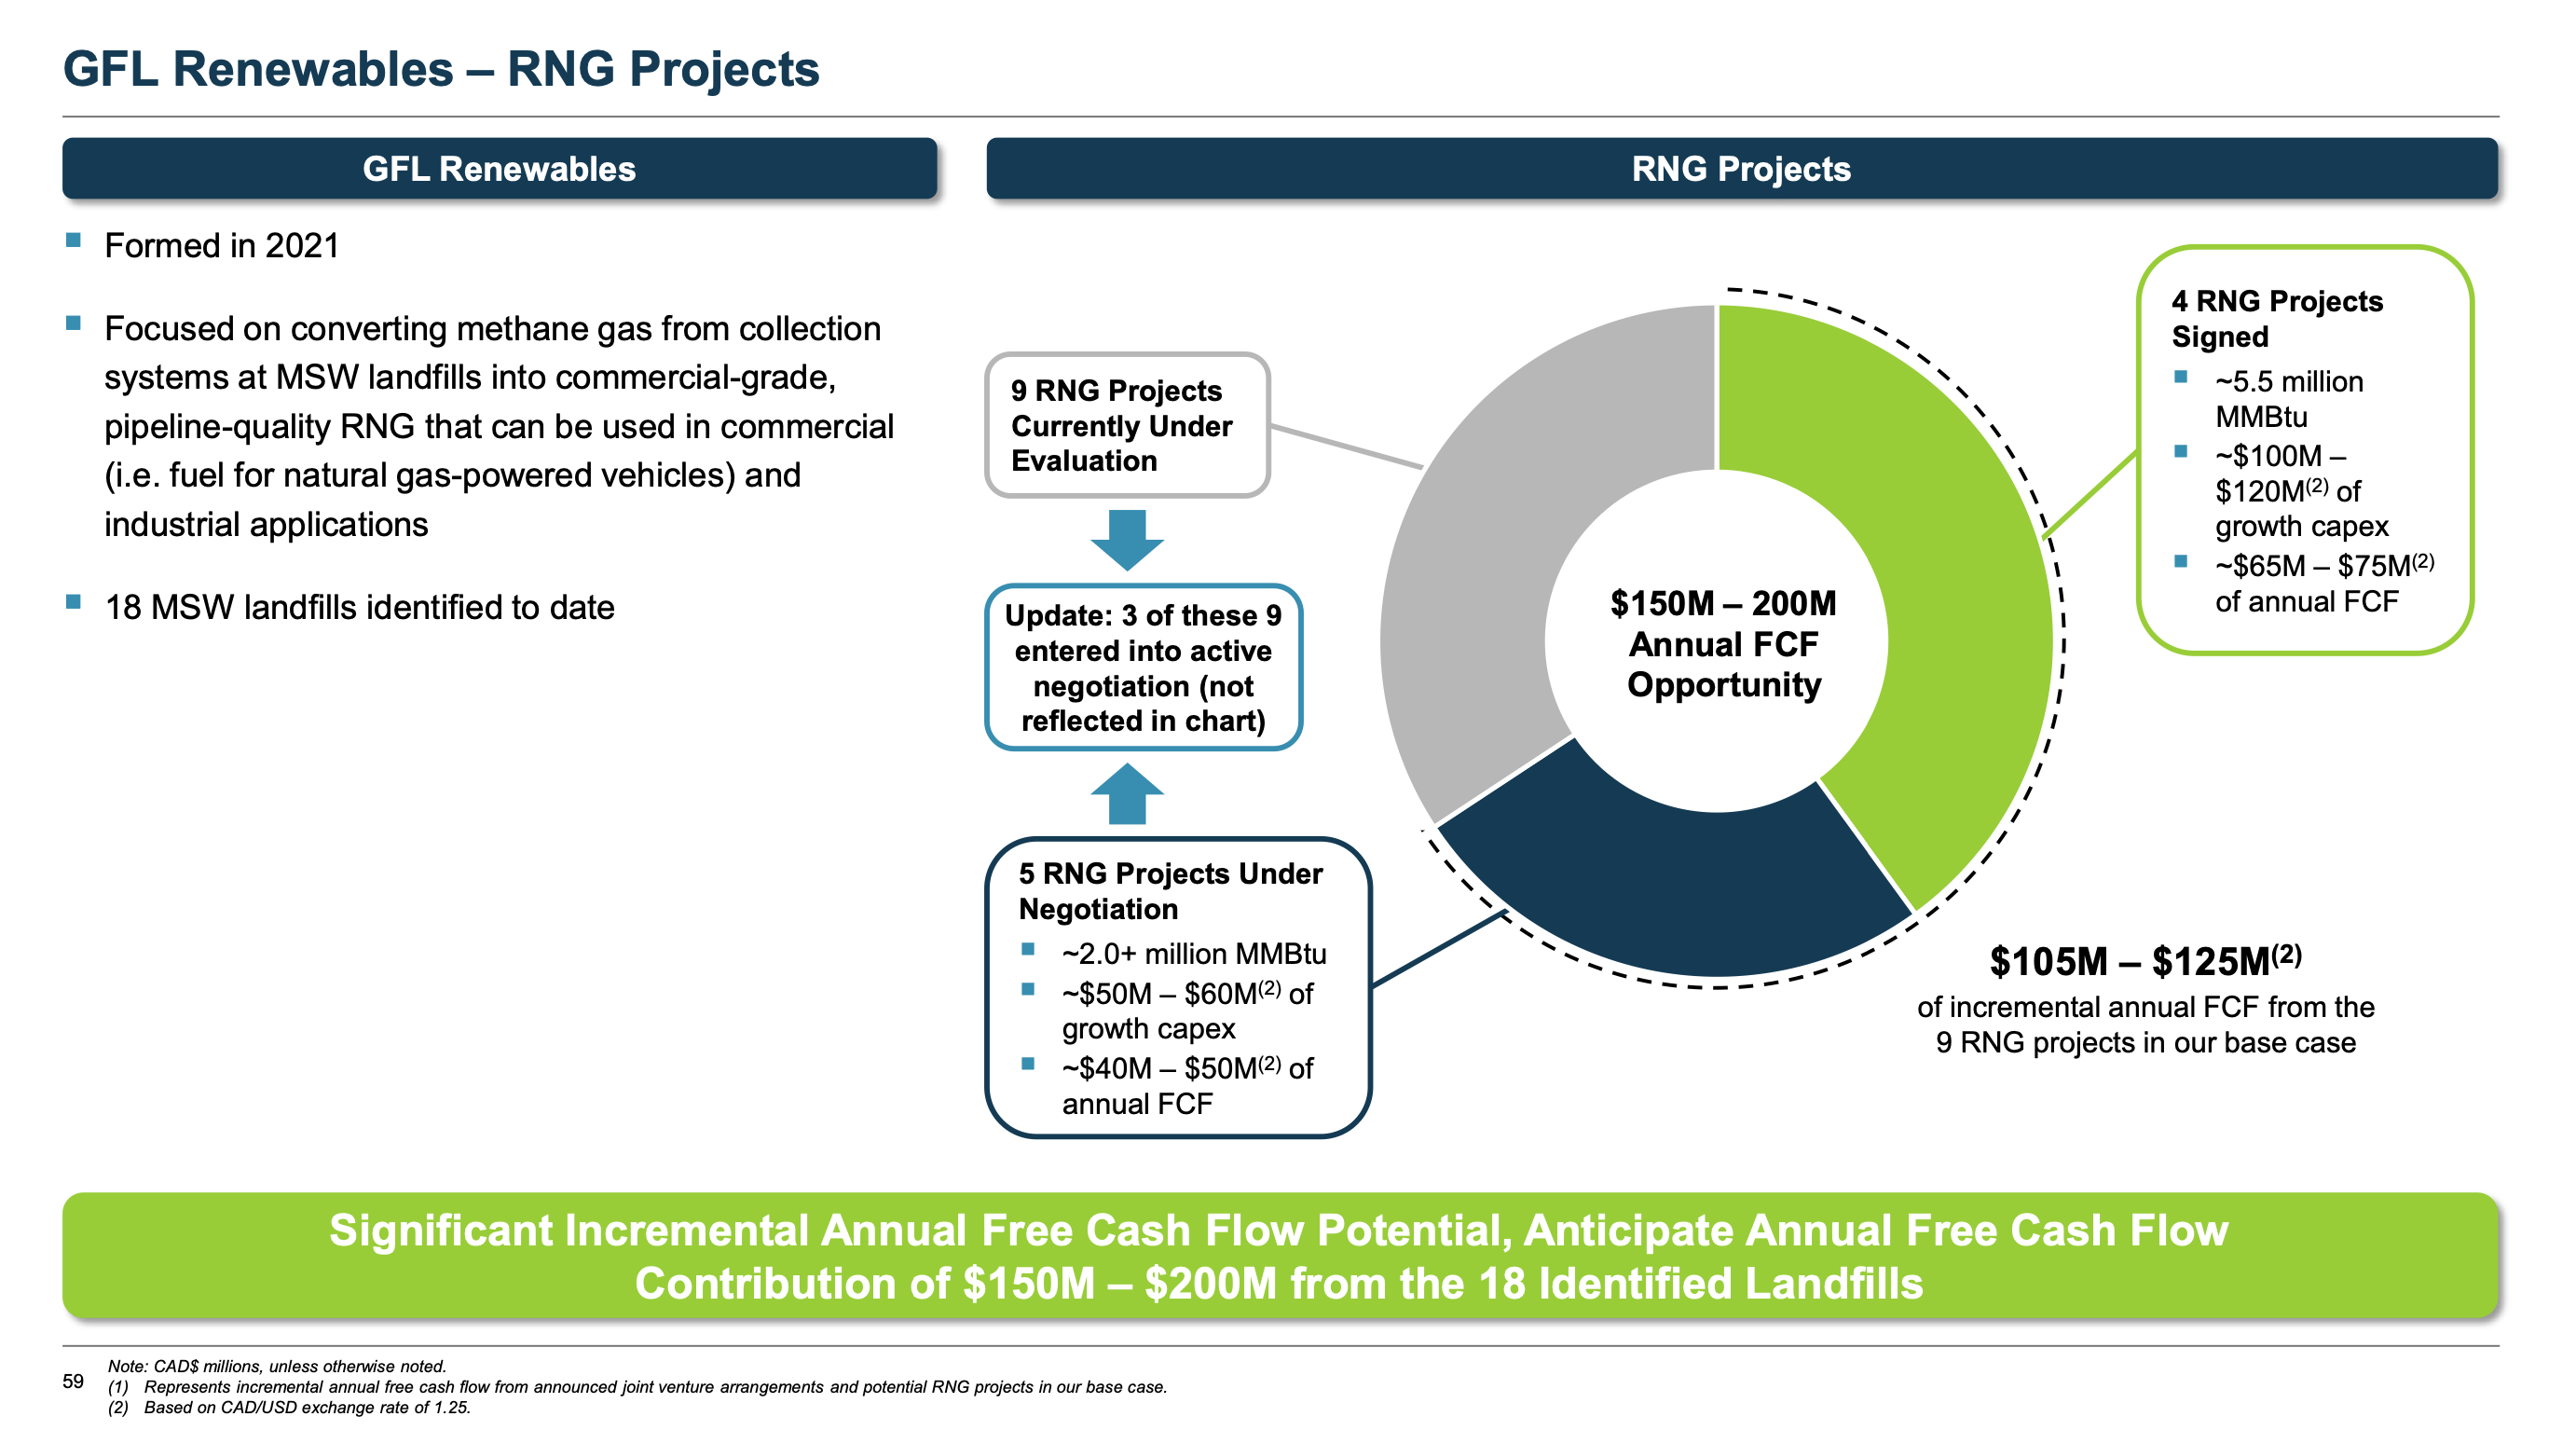
GFL RNG Projects (GFL 2022 Investor Day Presentation)
EPA Data – Livestock
The EPA also maintains the Livestock Anaerobic Digester Database here. The latest May 2022 update shows 331 projects. The database doesn’t capture RNG production. Of the 59 projects added in 2021 and 9 through May 2022, 56 are dairy, 49 produce Compressed Natural Gas, 9 pipeline gas, and 1 electricity.
Remarkably, almost all the 2021-2022 dairy projects are in California. We will come back to that when we get to environmental credits later.
RNG Production Cost
At this point, we need to briefly recap RNG production costs. The first estimate is from my previous article.
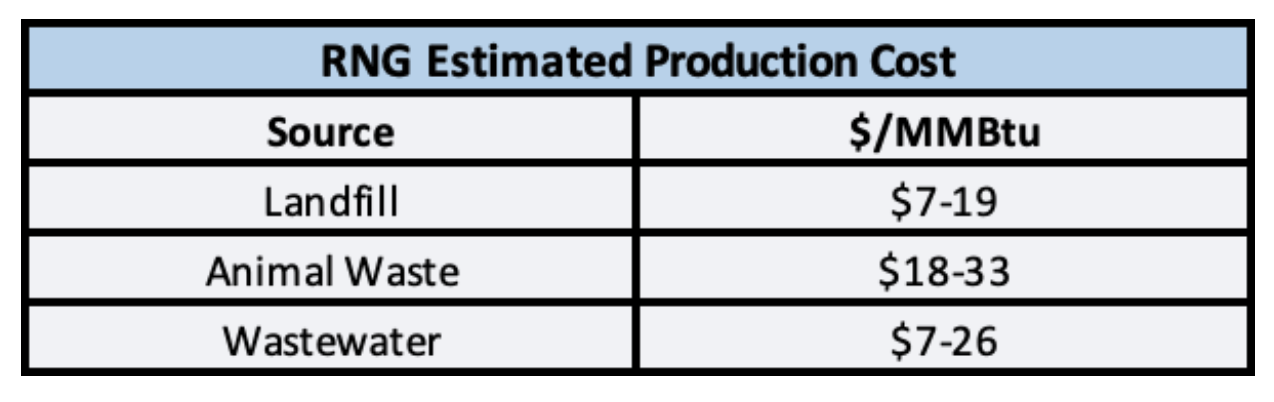
RNG Cost Estimate (Table by author, data American Gas Foundation)
The second estimate is from Bluesource a private developer and marketer of environmental and carbon credits. They estimated RNG production costs as $28 for landfill, $84 for animal waste, and $31 for waste water in this September 2020 presentation.
Environmental Credits – RIN and LCFS
In addition to the market value of the RNG, there are effectively Federal and in some cases State subsidies expressed as environmental credits. These can be very significant.
RIN Credits
RINs – renewable identification numbers – are the mechanism used to implement US renewable fuels policy. In effect, it provides a subsidy to use, and therefore produce, renewable fuels. RINs are indexed to the energy content of one gallon of ethanol, 1 RIN per gallon of ethanol.
A complete discussion is beyond the scope of this article, but a basic summary is useful to understand the RNG business case. If you would like to know more, there is a good discussion here.
Each year the EPA sets a requirement to use a volumes of several types of renewable fuels in transportation. This obligates primarily refineries to blend in renewable fuel, documented with an attached RIN, or to purchase the RIN directly.
Generation of renewable fuels, e.g. RNG, earns RINs, which can be sold, usually to refineries. Each MMBTU of RNG produced and used for transportation creates 11.7 RINs. RINs come in several types, with different values. RNG from landfills and dairy/swine manure generate RIN type D3, the most valuable. RINs are tradable, prices may trade in a range from $0.05 to $3.50. Wastewater and food waste generate less valuable D5 RINs. The table below reported the number of D3 RINs generated in August 2022.
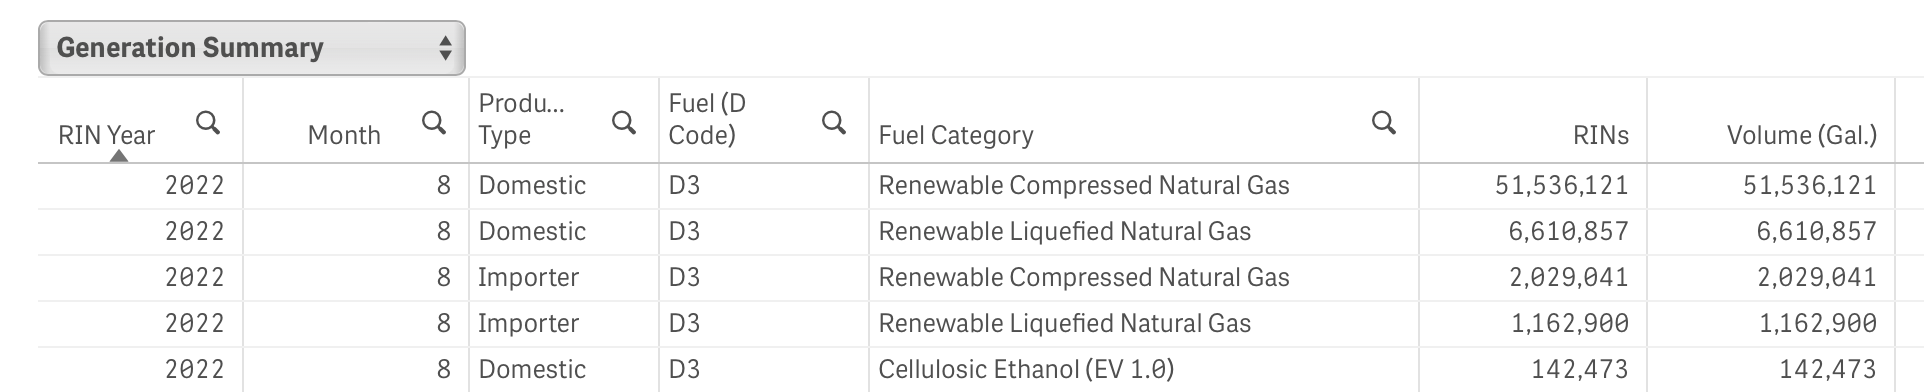
D3 RINs Generated – Aug 2022 (EPA)
The chart below shows the actual prices for D3 RINs from 2018 to 10 September (the most recent data available), see trading price data here, with prices ranging from $0.59 in 2019 to $3.34 in 2022. So during this period, the value of the RINs created with each MMBTU of RNG would have ranged from $6.90 to $39.08. If one takes $2 as the average RIN price, that’s a value of $23.40 per MMBTU of gas.
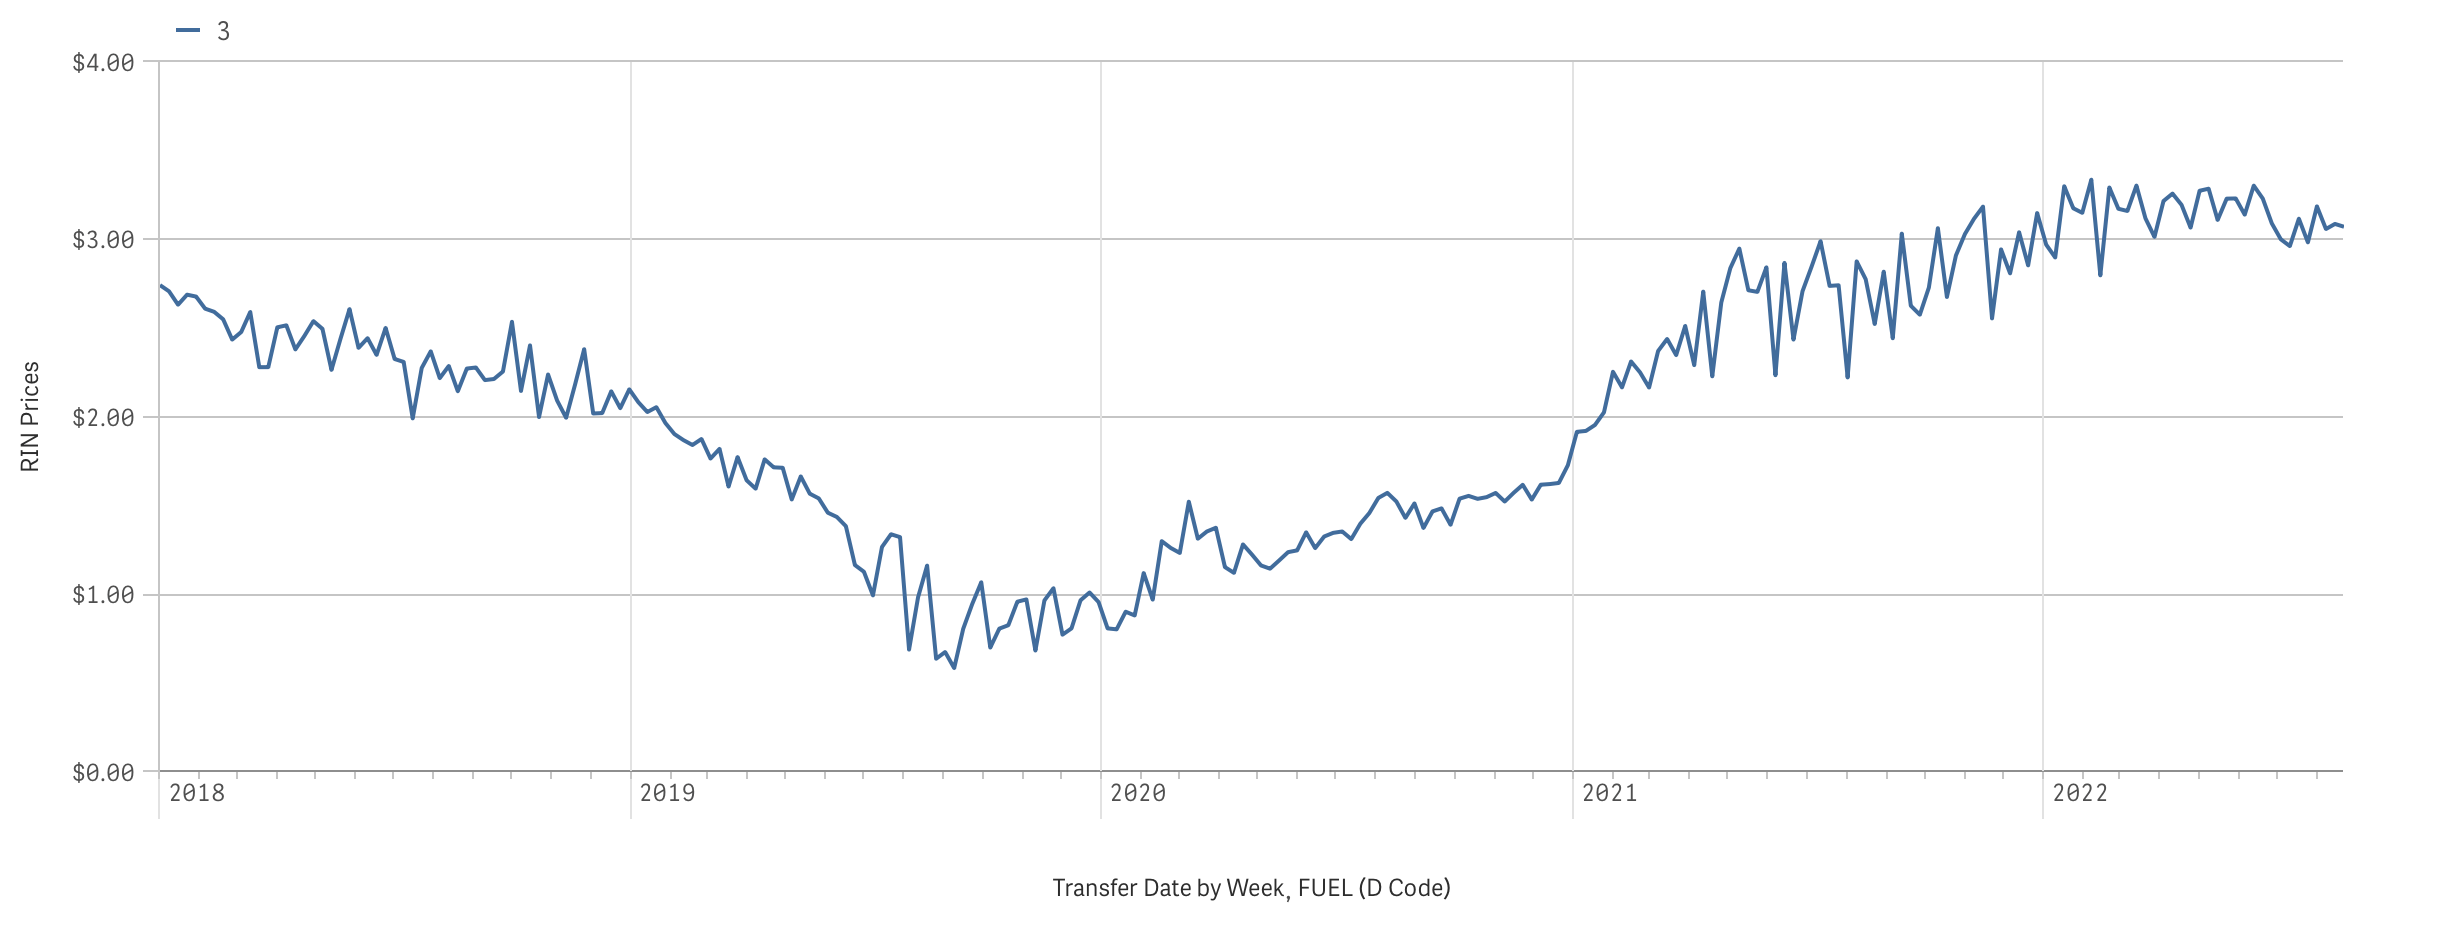
D3 RIN Price – 5 Year History (EPA)
As a reference, the average Henry Hub spot price for natural gas over this period was $3.46 and the low $1.33 (YChart data).
From this data, the RIN value is perhaps ~ 5x the value of the actual gas.
LCFS Credits
In addition to Federal policy and regulations, states have laws and incentives related to transportation fuel policy, see a list here. Among these is the California Low Carbon Fuel Standard “LCFS”, a program to reduce the carbon intensity of transportation fuels. Oregon and Washington are implementing similar incentives. Other states are considering similar plans.
Norton Rose Fulbright has a good summary of the legal and project finance aspects of LCFS here. States have also sometimes made grants to fund the construction of diary digesters.
Similarly to RINs at the Federal level, California awards LCFS credits to producers of low-carbon fuels. The rate of award is project specific, and based on a fairly complex life-cycle impact analysis of Carbon Intensity “CI”. These credits are tradable, and valuable to fuel refiners and wholesalers to meet regulatory requirements.
Because of the way LCFS credits are calculated (which includes the greenhouse gas impact of avoided methane emission for dairy), dairy RNG earns about 10x as many LCFS credits as landfill RNG. The transportation fuel is almost a byproduct.
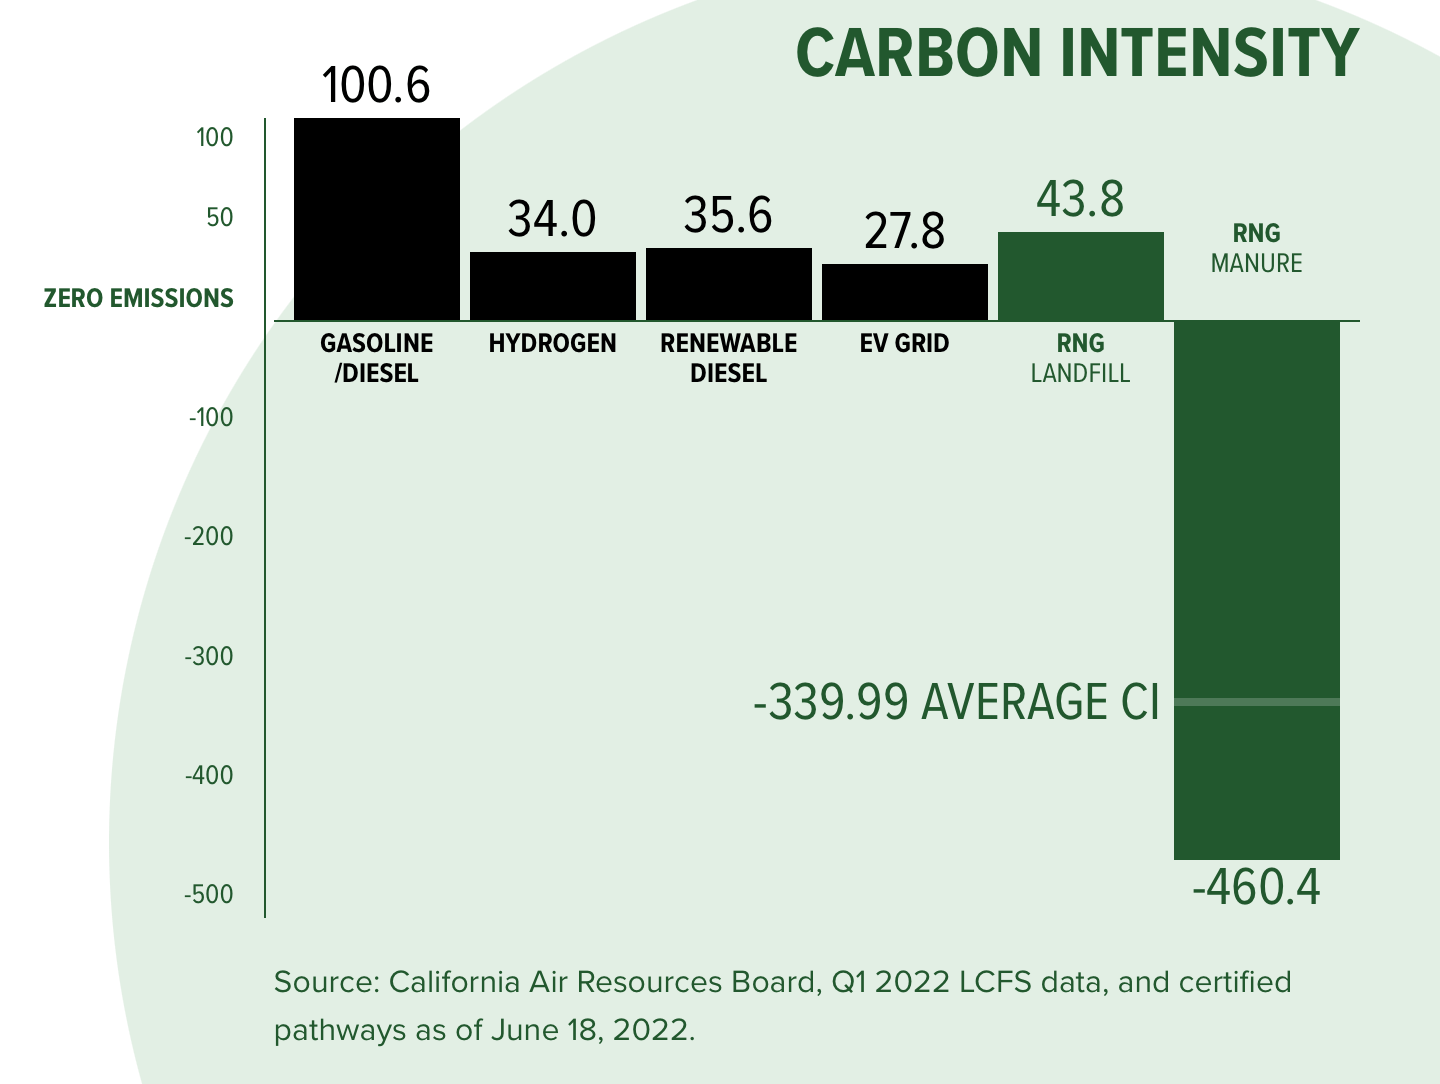
Carbon Intensity By Fuel Type (Bluesource)
RNG qualifies for credits as long as it is used to replace (normally with CNG) conventional transportation fuel in California. The RNG does not have to be produced in California; the accounting allows the gas molecules to be injected anywhere into the connected pipeline system as long as an equivalent amount of CNG is sold in California.
The credits are currently trading around $70 per metric ton of CO2 reduced; there is a regulatory cap of $239 in 2022, with annual inflation adjustment. Prices for the last three years are shown below.
LCFS Prices – Last Three Years (Neste)
This UC Davis study from December 2018 goes into detail on the economics of dairy digesters, and the risks of relying on subsidies for otherwise uneconomic investments, including the centralized multi-farm digester or RNG processing plant model. This is probably more than most people care to know, but perhaps worthwhile for the potential RNG investor.
LCFS has had a major impact on the business case for fairly RNG; we mentioned above the curious recent dominance of California dairy projects. This article California’s Green-Energy Subsidies Spur a Gold Rush in Cow Manure originally reported by the Wall Street Journal explains it. There is actually a bidding war for manure.
“It is like magic,” said Andrew Littlefair, Clean Energy’s president and chief executive, of the projected earnings boost from environmental credits.
This February 2021 blog post from Aaron Smith at UC Davis provides data and interesting analysis as LCFS credits come into play. Each cow produces about 22.5 MMBTU of gas per year. For a 2000 cow dairy, capital and operating costs are about $1.3 million per year (with a 30/70 operating/capital split), or $636 per cow, making the production cost for gas ~ $28 per MMBTU, well above Henry Hub prices.
However, this February 2022 article notes that “… with the Low Carbon Fuel Standard “LCFS” credits, the revenue loss is turned on its head: one cow generates a subsidy of $1,935 a year”; well over ten times the value of the gas.
One effect of the LCFS program is that over period of about 6 years, landfill gas largely displace fossil gas in the CNG market, and landfill gas is now in turn being displaced by dairy gas.
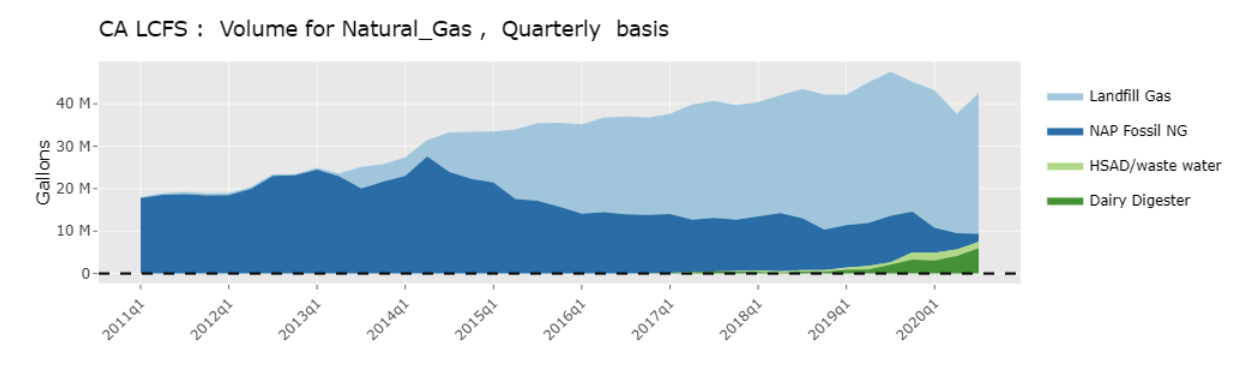
CNG – Market Share by Feedstock (UC Davis)
Underwriting the Investment Decision
An investor underwriting a new RNG facility might weigh production costs of $7-$33 or more per MMBTU, and revenue with gas and RINs of $8-45. Some projects will be more attractive than others.
The slide below captures Kinder Morgan’s (NYSE:KMI) recent view; 15x volume growth by 2050, D3 RIN value ~4x gas value, as of 29 July 2022. Note they focus on landfills.
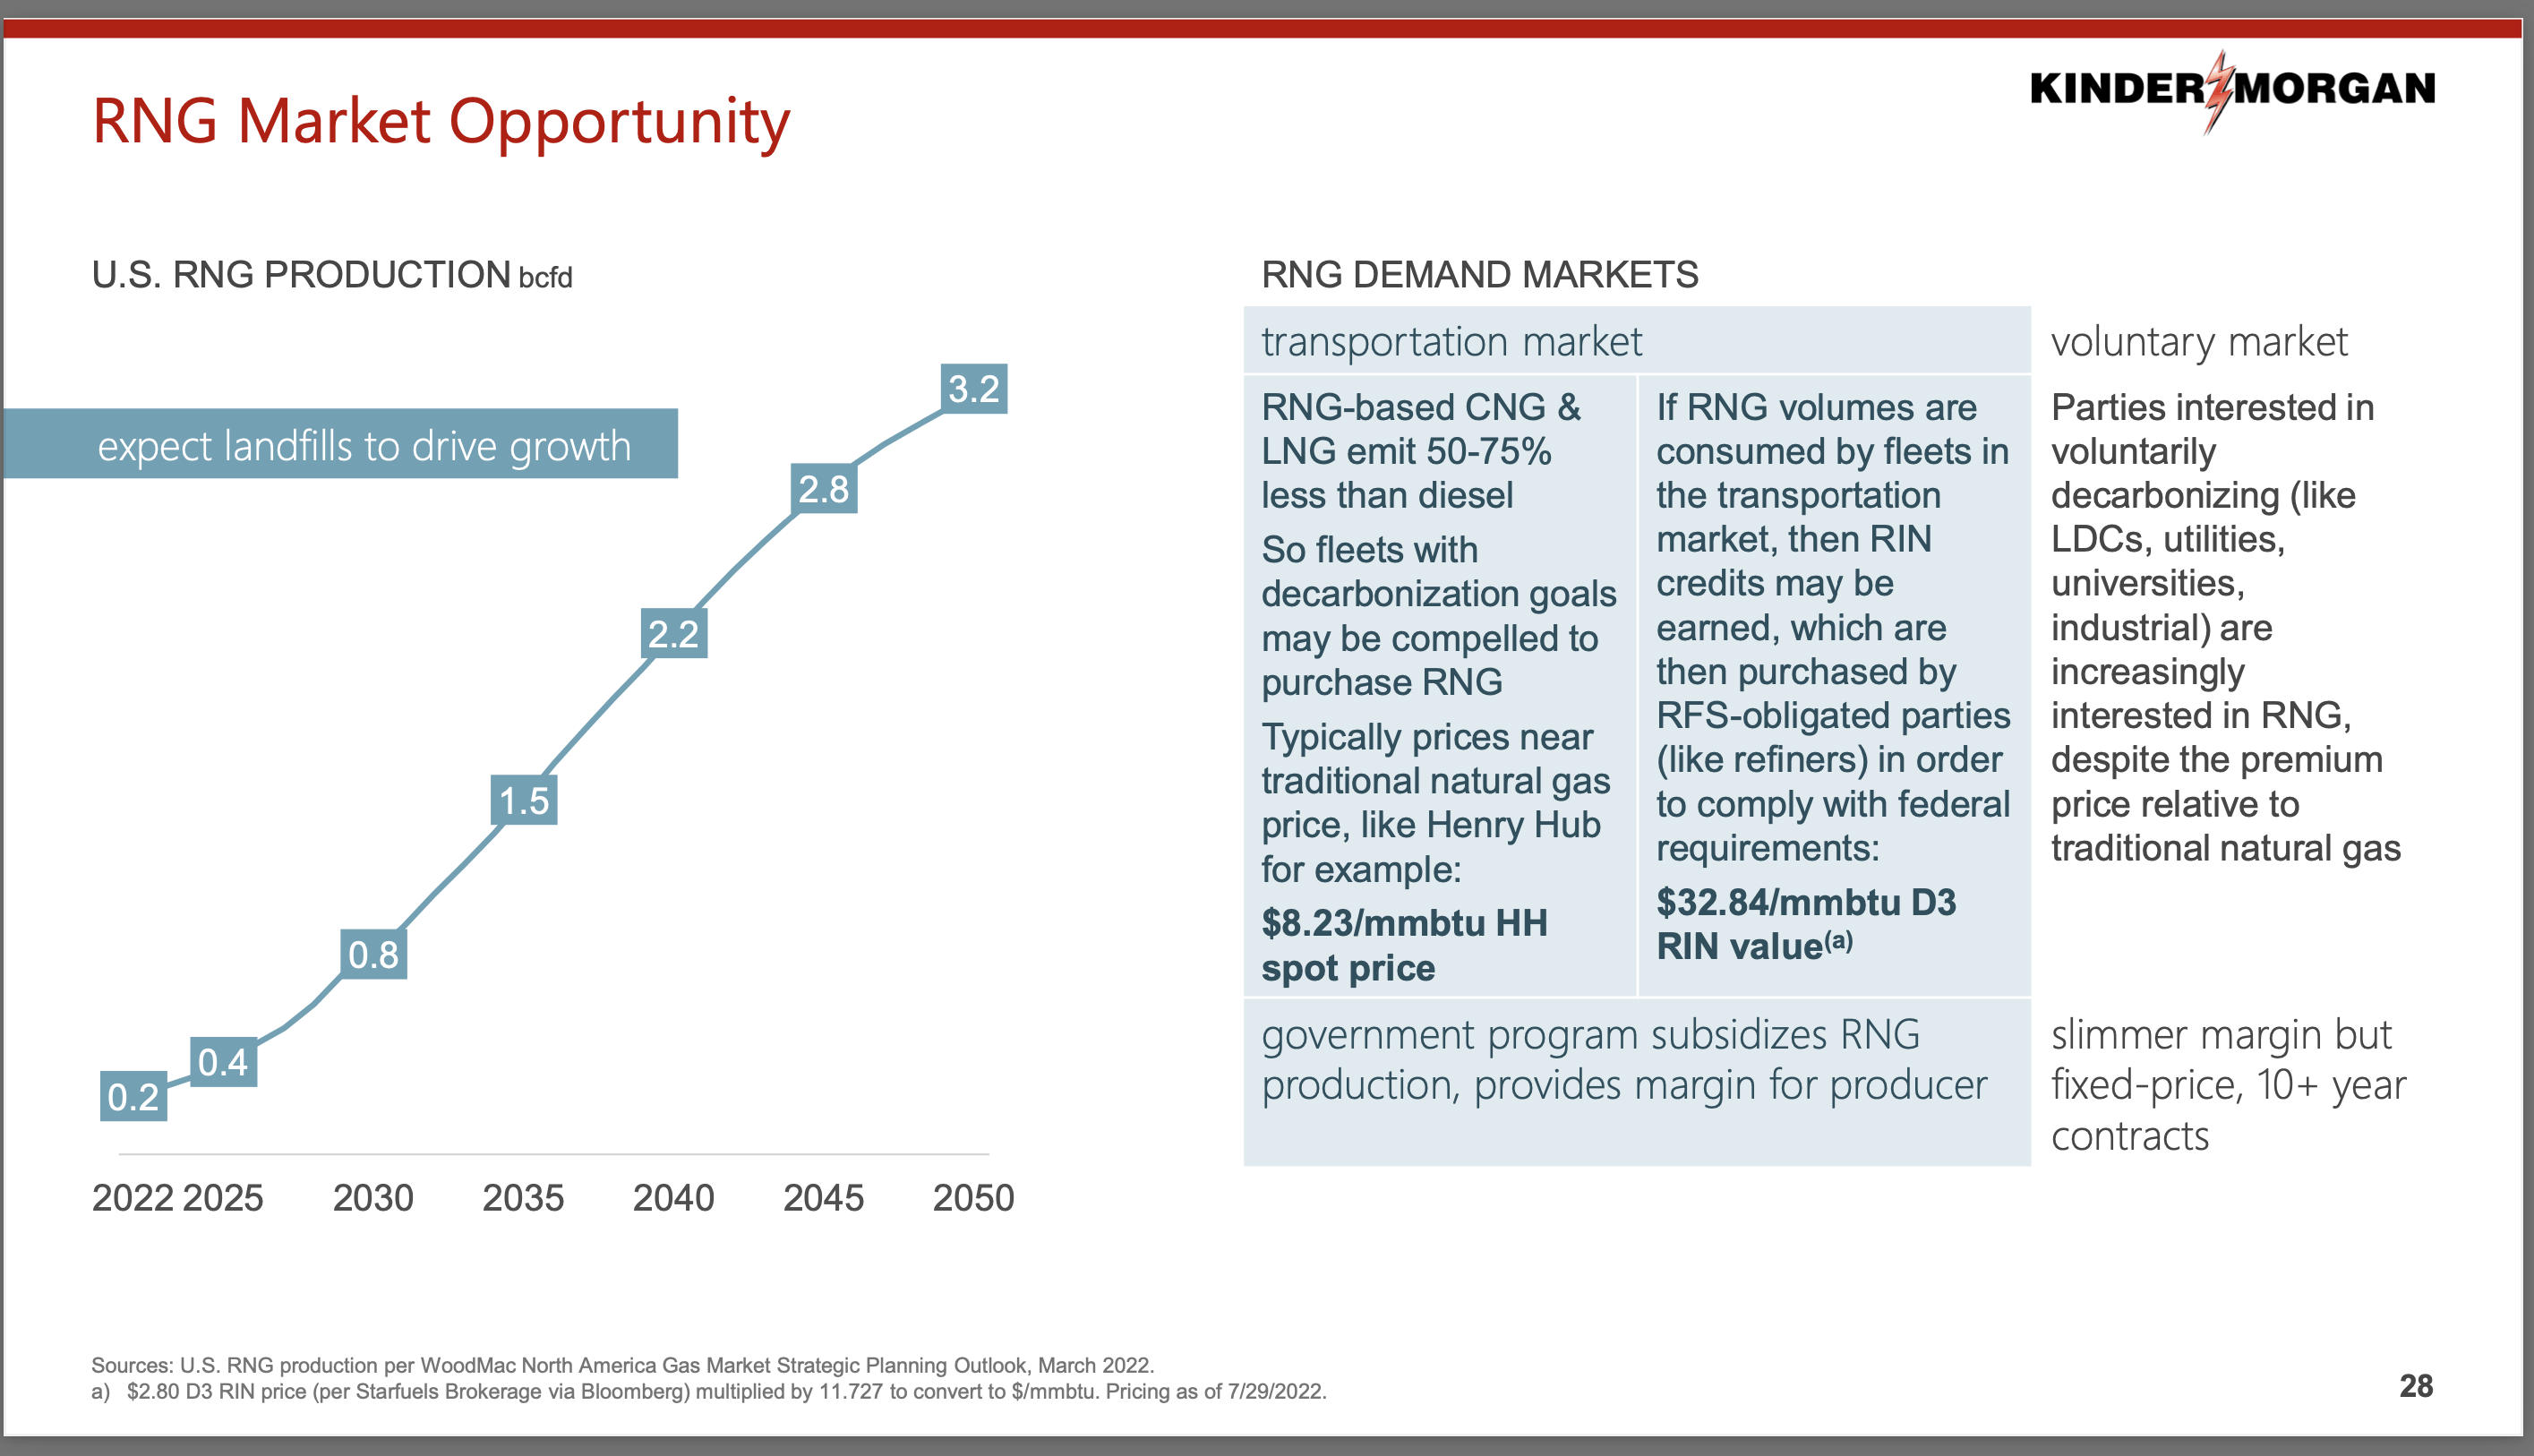
RNG Market (Kinder Morgan September 2022 Investor Presentation)
The hard to read footnote at the bottom the slide says “a) $2.80 D3 RIN price (per Starfuels Brokerage via Bloomberg) multiplied by 11.727 to convert to $/mmbtu. Pricing as of 7/29/2022.”
The slide below from Bluesource illustrates the potential impact of RINs and LCFS credits (note the slide is from Q4 2020; physical gas, RIN, and LCFS values are not current).
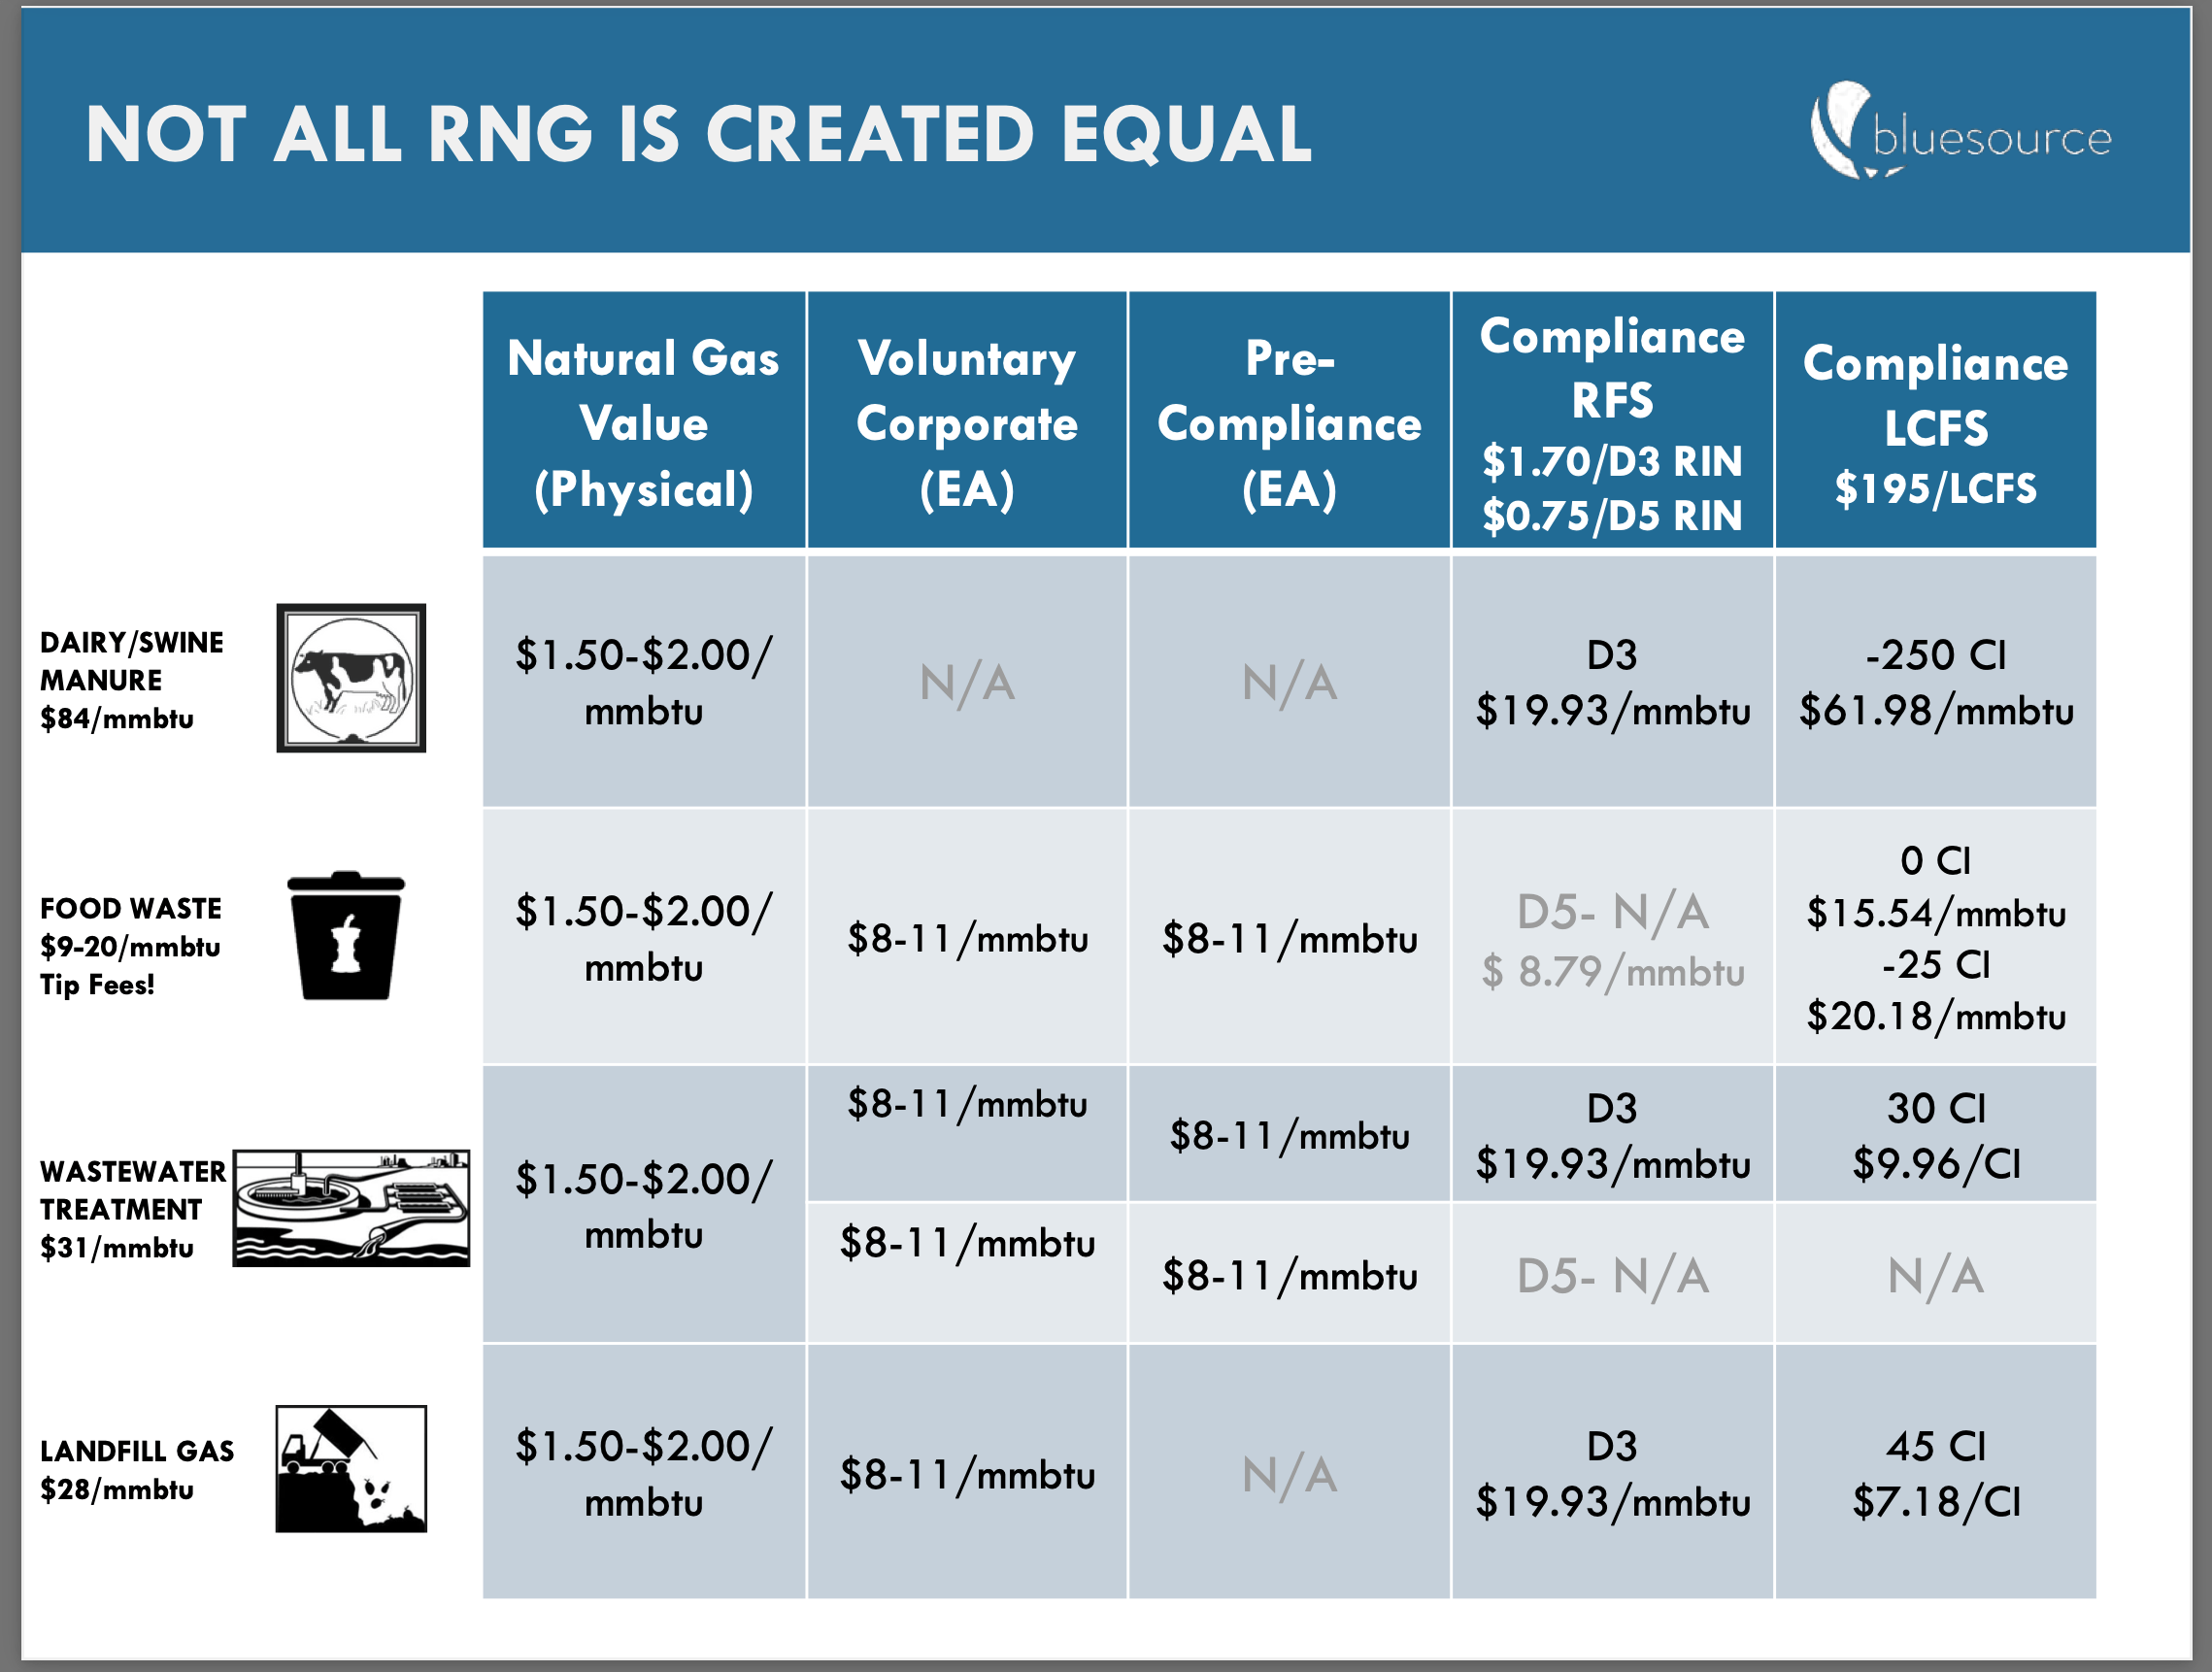
RNG Costs vs. Environmental Credits (Bluesource – Q4 2020)
Some Specific Companies
Let’s look at a few specific examples of what companies have been doing. We will look at three large caps and four mid-small caps.
Large Caps
Kinder Morgan – A Very Large Cap, Deep Pockets Example
Kinder Morgan provides a good example of the increased attention from some larger, deeper pockets, firms. KMI has moved off the sidelines and become much more active, committing $1.1 billion to RNG in 2021-2022.
Their 2021 ESG Report published in July 2022 notes
Since 2018, we have connected six RNG sites to our pipeline systems that have a takeaway capacity of approximately 27 MMcf/d of RNG, which could have accounted for nearly 13% of the RNG market share in 2021.
Moving beyond providing pipeline capacity, in July 2021 KMI announced the $310 million purchase of Kinetrex Energy (private), including a 50% interest in one existing RNG landfill facility and agreements to construct three additional landfill RNG facilities, all to produce CNG and LNG for regional transportation customers.
The deal closed in August, and construction on the new sites began in September 2021, with an expected investment of $146 million. The four Indiana sites have potential RNG production capacity of 4 BCF per year. KMI expects to begin monetizing renewable identification numbers, or RINs, from the first Kinetrex plants during the first quarter of 2023. KMI estimated total investment to be less than 6 times 2023 EBITA.
In July 2022, KMI purchased three landfills facilities from Mas CanAm, LLC. for $355 million. The Arlington Texas RNG facility is operational, and is expected to produce 1.4 BCF in 2023. Other sites are medium output RNG facilities in Victoria, Texas, and Shreveport, Louisiana.
In August 2022, KMI announced the $135 million acquisition of North American Natural Resources, Inc. and its sister companies, including seven landfill gas-to-power facilities in Michigan and Kentucky. KMI plans to invest $175 million to convert up to four of the seven facilities to RNG facilities. With an early 2024 in-service date, the four facilities are expected to generate approximately 2 BCF of RNG per year. The remaining three assets will continue to produce gas-to-electric power. This investment is also expected to be less than 6 times 2024 EBITA.
Back of the envelope, with a 1:6 EBITDA to investment ratio for RNG projects, the EBITDA from KMI’s 1.1 billion RNG investment would be less than 3% of projected 2022 EBITDA of 7.2 billion.
Chevron – Very Large Oil
Chevron (NYSE:CVX), partnered with San Francisco-based Brightmark LLC to form Brightmark RMG Holdings (private), to co-developed 19 dairy RNG projects across the United States. First RNG was generated at their latest project, in South Dakota, in August 2022. It has another agreement with California Bioenergy LLC. (private) to produce and market RNG from dairies.
Chevron’s August 2022 Investor Presentation includes a goal to produce 40,000 MMBTU/day of RNG by 2030. That would be 14.6 million MMBTU/yr, 15% of the total RNG production from all sources estimated for 2022.
In June 2022, Chevron completed the acquisition of Renewable Energy Group, Inc. for $3.15 billion in cash. The company is primarily focused on renewable and bio diesel, but it’s an indication of the potential level of investment in renewable fuel.
Fortis – Large Utility
In Canada, gas distributer FortisBC (NYSE:FTS) expects to get about 3.7 bcf per year of RNG from 25 sites, triple its 2021 volume, with plans to reach 23 bcf per year by 2025, according to this report. They provide a preferential market for RNG.
MidCap and Small Cap
Ameresco
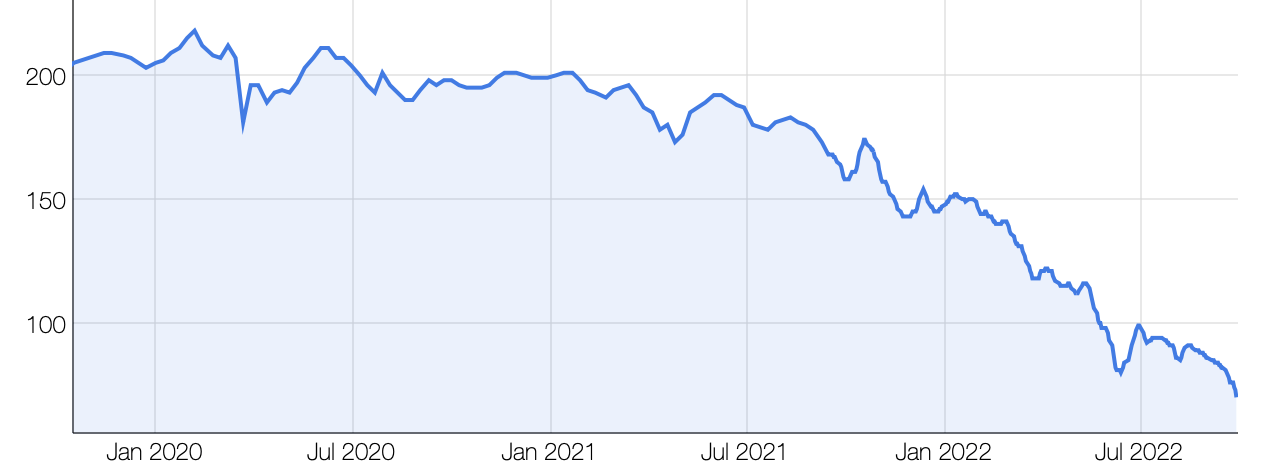
Ameresco, Inc. (NYSE:AMRC) is a 3.3 billion market cap company, active in engineering and operation of energy projects. In my previous article, I had suggested them as a potential way to play RNG. The plot below shows the subsequent price performance; quite variable.
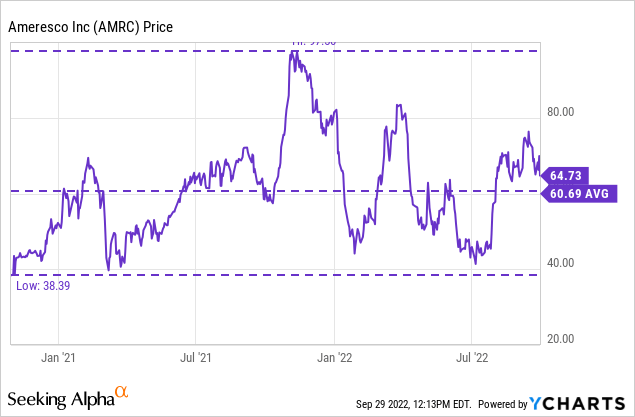
AMRC’s May 2022 Investor Presentation states that they rank #4 in the RNG market, and project they will be #2 in 2023. Sized in MW equivalents, RNG represents 11% of their owned energy assets.
The Q2 AMRC earnings call touches on outlook and RINs:
Doran Hole – EVP and CFO
The market overall, I think that we have been — as you might expect, internally focused on the 18 [RNG] projects that we’ve got in development and construction …
What I think you’ll probably see is … an increased focus by parties on voluntary purchases of renewable natural gas.
I outlined our RIN monetization strategy pretty clearly in the script and I think that we feel very good about what the economics look like on the assets that we have in development and then what we were planning on putting in the ground over the next several years.
Montauk
Montauk Renewables, Inc. (NASDAQ:MNTK) is a 2.5 billion market cap company, which went public in January 2021, produces methane from landfills, swine, and dairy facilities. MNTK produced 1.5 million MMBTU in Q2. They sell RNG, a modest amount of generated electric power, and RINs. Operating expense were $17.43 per MMBTU. LCFS revenue is expected in 2023 (an example of California LCFS credits earned for dairy operations in another state, Idaho).
MNTK has very high insider ownership. MNTK announced in August 2022 that they were exploring strategic options, including a sale.
The Q2 earnings call provides an example of how significant RINs are:
Total revenues in the second quarter of 2022 were $67.9 million, an increase of approximately $36.2 million or 114.3% compared to $31.7 million in the second quarter of 2021. The primary driver for this increase related to an increase of 89.9% in realized RIN pricing in the second quarter of 2022 of $3.38 compared to $1.78 in the second quarter of 2021.
At the beginning of the second quarter of 2022, we had approximately 4.4 million RINs in inventory. We sold all of those RINs in inventory during the second quarter of 2022 in addition to the RINs generated from our second quarter 2022 production, … selling a total of 14.4 million RINs.
Clean Energy Fuels
Clean Energy Fuels Corp. (NASDAQ:CLNE) is a small cap with a 15 year history as a public company, primarily providing CNG (78% of which was RNG in 2021) to trucks and heavy vehicles through a network of about 550 fueling stations. CLNE is the largest provider of RNG as a transport fuel in the US, with over 60 sources. They also design, build, and maintain fueling stations for customers.
TotalEnergies SE (Pink:OTCPK:TTFNF) owns 19% of CLNE’s common stock. In 2021, CLNE sold 23.8 million shares of stock ATM for $8.75 per share. They also have an agreement with Amazon (NASDAQ:AMZN) which conditionally gives AMZN warrants to buy up to 20% of their stock (accounting for this shows up in the 2021 fuel sales number below).
The table below illustrated the relative revenue from fuel sales vs. credits.
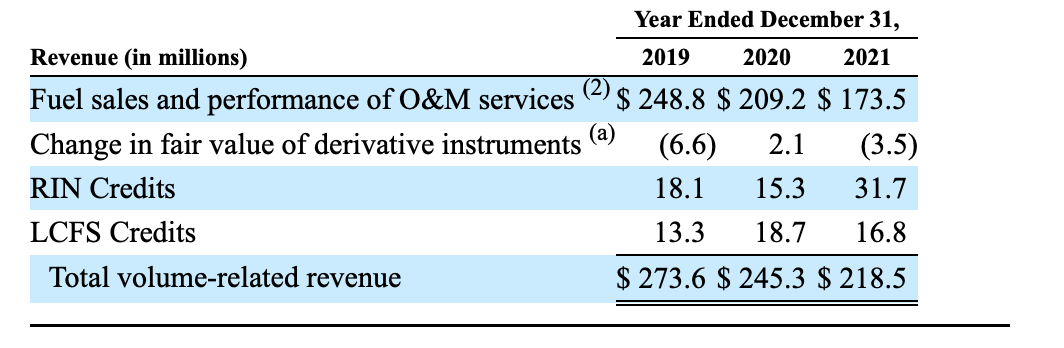
Fuel Sales vs. Credits (CLNE 2021 Annual Report)
CLNE has historically found it difficult to make a profit; the fundamental problem appears to be inadequate margins on fuel sales. With significant JV funding from BP (NYSE:BP) and Total, they are expanding into RNG production, and continuing to expand distribution.
In March 2021 CLNG and Total announced a 50/50 joint venture to develop RNG production facilities, as well as credit support to develop downstream fueling infrastructure. Initial investment is $100 million, with options to increase to $400 million. In addition, Total will contribute $65 million credit support.
In March 2001 it formed a 50/50 joint venture with BP to develop, own, and operate RNG production facilities at dairy farms. BP initially contributed $50 million, $CLNE $50 million. In December 2021, each agreed to commit an additional $71.6 million.
In September 2022 CLNG provided 300,000 gallons of fuel for the first of three LNG powered container ships planned of the West Coast – Hawaii trade route. The ship is expected to fuel 25 times a year.
CLNG’s CEO was the source of the “It is like magic” quote on environmental credits above. I read the transcripts for their last two earnings calls, and would describe the discussion as rambling.
Aemetis
In June 2022, small cap Aemetis, Inc. (NASDAQ:AMTX) opened its biogas-to-RNG processing facility in California, with plans to eventually connect up to 60 dairies, and deliver the RNG to an existing PG&E pipeline. Three dairies are currently connected, with another five expected before year end 2022. When completed, the planned project will deliver 1.6 million MMBTU of RNG per year to PG&E (~ 7% of estimated US 2022 production from livestock).
Analysis
KMI, Chevron, and Fortis provide three examples of large caps with significant efforts in RNG. However, the financial performance of large caps is, and is likely to continue to be, dominated by other factors. There is also probably a real, but hard to value, ESG benefit.
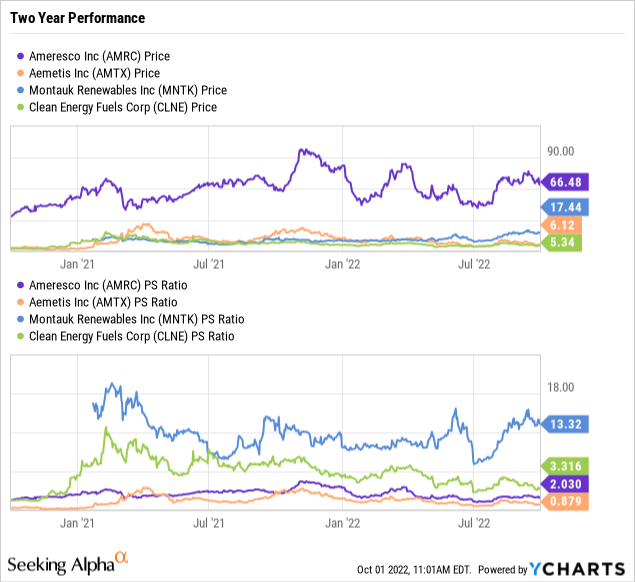
The four mid-small caps all have material RNG exposure. All highlight the large impact of tradable credits – RINs and/or LCFS. The chart below shows the stock price and price/sales for the past two years. None of these stocks pay a dividend, several has significant short interest. Per Seeking Alpha, AMRC and MNTK is (non-GAAP) is expected to be profitable in 2022 and in 2023, CLNE break even in 2022 and profitable in 2023, and AMTX to be unprofitable in both years.
Risks
I view the major risk as political / regulatory.
The production cost of most RNG is now, and is likely to remain, higher than fossil natural gas. That means that most business plans depend on a social and political preference for RNG.
This preference is expressed as either a willingness to voluntarily pay above market prices, or legal regulations implemented thorough mechanisms such as RIN and LCFS credits. Particularly for LCFS, the calculated life-cycle values can be dependent on relatively obscure technical assessments.
This analysis of the LCFS program suggests RNG production may soon exceed California CNG vehicle requirements, and may be diverted to power generation for EV vehicles.
California’s push for 100% zero tailpipe emissions for commercial vehicles by 2045 or earlier may reduce or eliminate the use of CNG and thus RNG in transportation in that state.
Investor Takeaway
RNG meets much less than 1% of US natural gas demand today, but has the potential to grow 15x to meet 3%. Production costs are substantially higher than fossil natural gas, and the business case for increased production is significantly dependent on regulatory support.
Particularly in the last few years, RNG has attracted increasing amounts of investment capital – billions of dollars – from a range of major investors.
While I would not expect a classic roll up, one might expect material consolidation, with the top 10 operators holding significant market share. I would not be surprised to see a shift in the RNG business toward an increasingly pragmatic business style, informed by large energy company practices.
For most of these large investors, RNG investments even at that scale will be a minor part of their business. The best opportunities for an individual investor may be the smaller to mid-sized public companies with a significant RNG focus, such as the examples discussed above. These may also be potential acquisition targets.
Personally, I do not have an investment at this time in any of the companies discussed except KMI.
Be the first to comment