

sshepard/iStock Unreleased via Getty Images
The final installment of this group of regional banks covers Regions Financial Corporation (NYSE:RF). Based in Birmingham, Alabama, Regions is a bank holding company with operations in 15 states across the South and Midwestern United States. The company’s roots go back as early as 1852 when the First National Bank of Huntsville opened its doors. In 1871, the First National Bank of Montgomery began business. And the final piece of the original three banks that eventually combined to form what today we call Regions was Exchange Security Bank of Birmingham, which began operating in 1928. These three entities would wind and weave toward each other in 1971 and begin a steady expansion out of Alabama into the rest of the Southern and Midwestern United States.
Regions Q3 Investor Meeting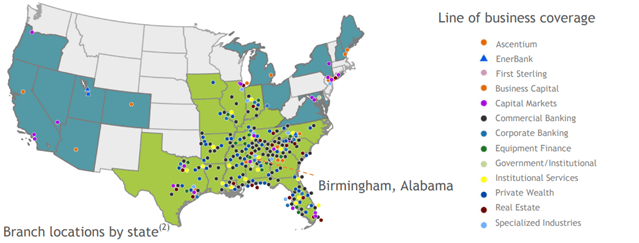
Today, the company has assets of over $160 billion (Q2) and total net revenues in excess of $6.4 billion (2021). Regions offers services in consumer and commercial banking, wealth management, capital markets and mortgage services.
Income Statement
Regions has been able to produce consistent, steady growth over the past several years. One thing I look for is how well the company performed during the pandemic shutdown of 2020. In this case, the company increased total net revenues over 7% in 2020. The company followed this up with a 2.4% gain in total net revenues in 2021. But the strong growth during the most difficult business environment in at least a generation is what really catches my eye. Looking at a longer period, the company has increased total net revenues by 3.5% annually over the past five years. This is good, solid growth, really in line with the broader economy over this period.
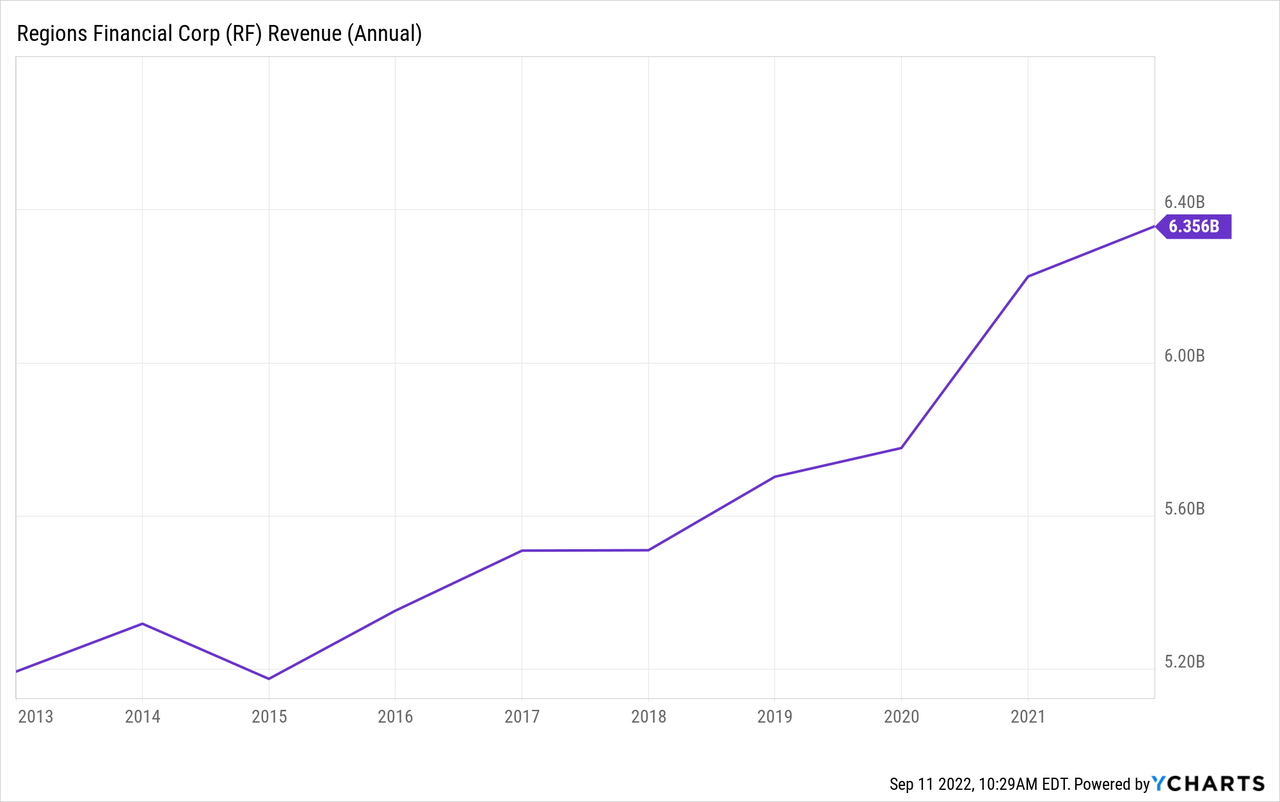
Non-interest revenues have led the growth for Regions with a 4.6% annualized CAGR, compared to 2.9% for net interest income. Capital markets has led the way with 16.8% growth during this period to become the third largest revenue segment in 2021. The largest, service charges, has actually shown a slight annual decrease over the five-year period. However, service charges remain the largest revenue segment.
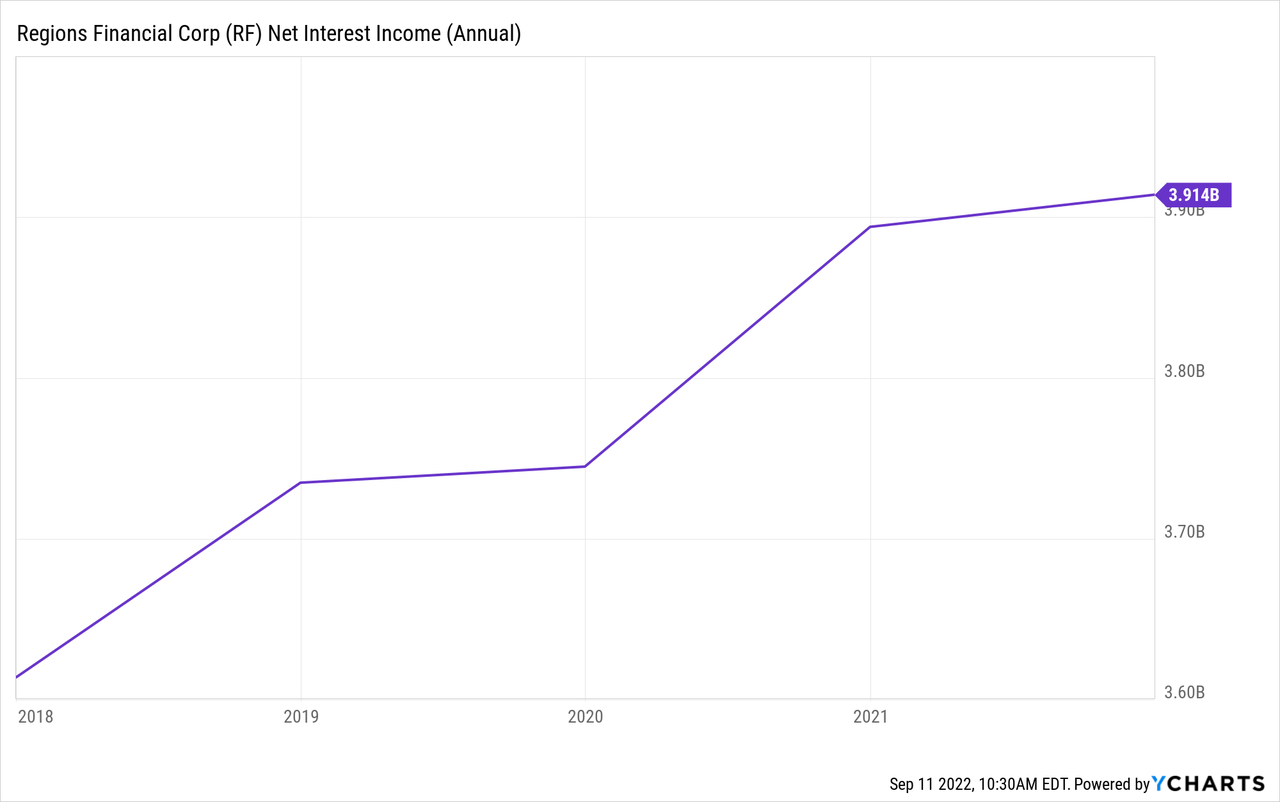
Interest income has been somewhat disappointing, as five-year CAGR has only been 1.4%, quite a bit lower than some of the peers. Interest expense has been managed very well, thus leading to the 2.9% annual growth in net interest income. In fact, interest expense was just $167 million in 2021, or 2.6% of total net revenues. Both of those figures are the lowest reported since at least 2013.
For the first half of 2022, total net revenues have increased 4.9% compared to the first half of 2021, with the majority of that growth occurring in the second quarter. Net interest income has been the growth story here with 10% growth year-over-year. Non-interest revenues have decreased 2.9% year-over-year, mainly due to the declines in the mortgage business, which is the same story across the industry.
As for the provision for loan losses, the results at Regions are somewhat consistent with the peer group, with the exception of the messaging. After posting a provision of $1.3 billion during 2020, the company reported a benefit of $524 million in 2021. In the company’s 2021 10-K report, management said “the significant decrease in the provision for credit losses was driven primarily by improvement in the economic outlook and strong credit performance.” For Q1 2022, the company reported a benefit of $36 million, due to “positive asset quality and waning pandemic concerns.” However, in Q2 2022, the company reported a provision of $60 million. The company had the same comment in Q1, which is very interesting because all the peer banks have noted a decline in economic activity so far in 2022. Many of the peer banks indicated a reversal in the economic outlook between the end of 2021 and the Q2 reporting period. Regions, however, has stated that asset quality remains strong, but is offset by strong loan growth and general economic uncertainty. Perhaps the South and Midwest are holding up a bit better than the Northeast and Upper Midwest states, which is where many of the peer banks are based. This is one line to keep an eye on as the remainder of the year reports out over the next couple of months.
On the expense side, the company has seen its expenses as a percentage of revenues decline steadily over the past several years. Beginning with compensation expense, the compensation expense ratio has averaged 0.34 over the past five years, with 2021 coming in at 0.34. Through the first half of 2022, the ratio was 0.33, a tick below the historical average. The efficiency ratio, a measure of overall expenses, has averaged 0.60 over the past five years, with 2021 finishing at 0.58. Through the first six months of this year, the efficiency ratio was 0.56, well below the first six months of 2021. This is down from a high of 0.67 in 2015, so the company has shown great progress in flushing out unnecessary costs. Investors should be very happy to see this sort of expense control at a company, especially given the steady increase in revenues throughout this period.
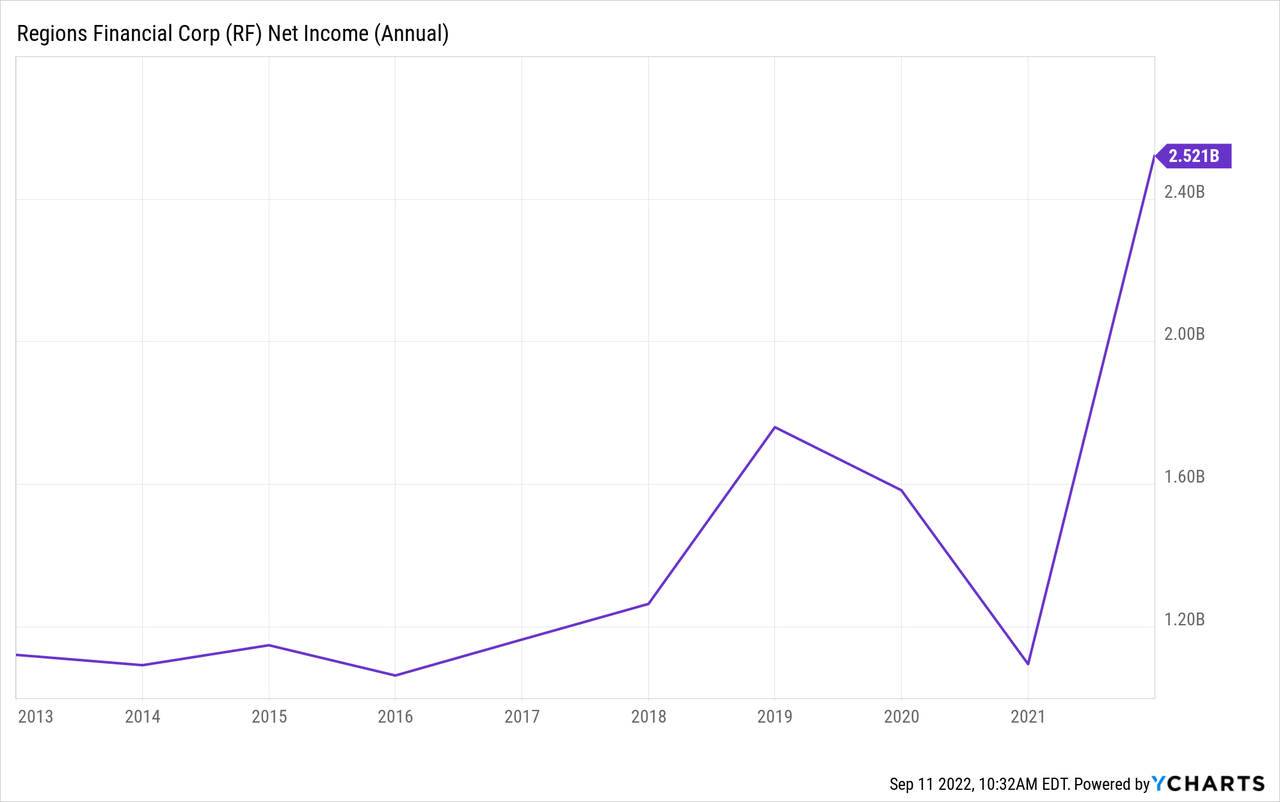
Despite the improved expense picture, the bottom-line net income numbers have been good, although somewhat volatile. This is primarily because of the up and down nature of the provision. Net income margin has ranged from a high of 39% in 2021 to a low of 17.4% in 2020. Operating margins have been similarly variable, averaging 34.5% over the past five years, but ranging from 20.9% to 50%. Finally, five-year net income for common stockholders has increased at 16.9% annually which is huge. EPS has increased at a similar 23.4% annually over the past five years. It should be noted that in the first half of 2022, net income decreased 15% to $1.1 billion, while EPS decreased 13% to $1.14 per share.
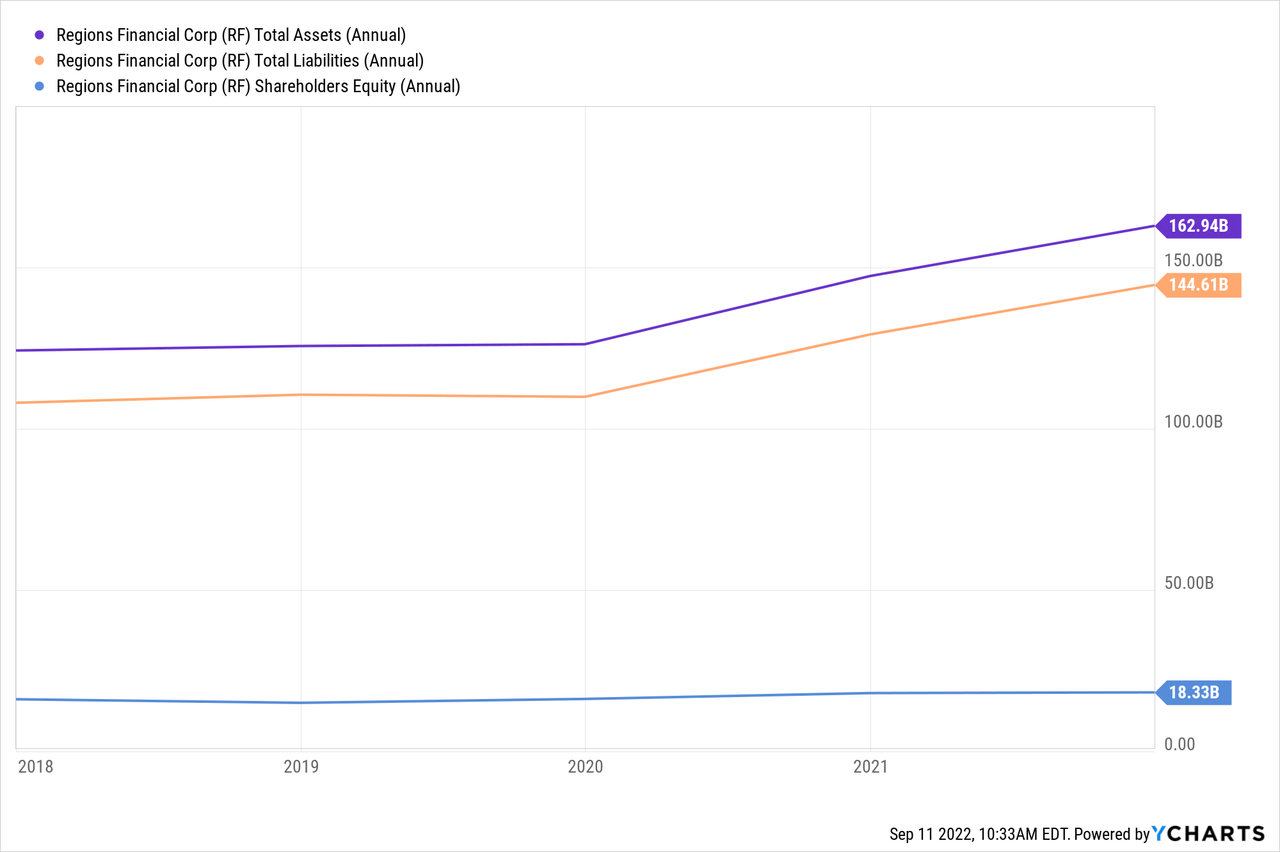
Balance Sheet
Looking at the balance sheet, total assets have increased 5.3% annually over the five-year period ending in 2021. Over this same period, loan growth has increased just 1.8% annually, which is on the low end of the peer group spectrum. Total liabilities have outpaced asset growth, with a 5.8% annual growth over the five-year period. Annual growth in deposits has been strong 7.0% annually, which is also on the low end of the peer group range. Total assets reported at the end of Q2 2022 were $161 billion, slightly lower than year-end 2021.
Similar to many of the peer group companies, Regions has been reducing their reliance on long-term debt as a funding source. In 2018, long-term debt and short-term borrowings totaled $14 billion, or 11.2% of total assets. By the end of 2021, however, borrowings totaled just $2.4 billion, or 1.5% of total assets. This reduction, coupled with the strong deposit growth, has allowed the company to use deposits as a much cheaper source of funding, which helps to bring its interest expense down and net interest spreads up. Finally, equity has increased 1.9% annually, with common equity and tangible common equity increasing 1.0% and decreasing 0.4%, respectively, over the past five years. The company has generally been an aggressive buyer of its outstanding shares. On April 20, 2022, the Board of Directors authorized the repurchase of up to $2.5 billion on the company’s common stock, through the end of 2024. The authorized amount represents 12% of the company’s current market capitalization, but there is no guarantee that all of it will be fulfilled.
Ratios
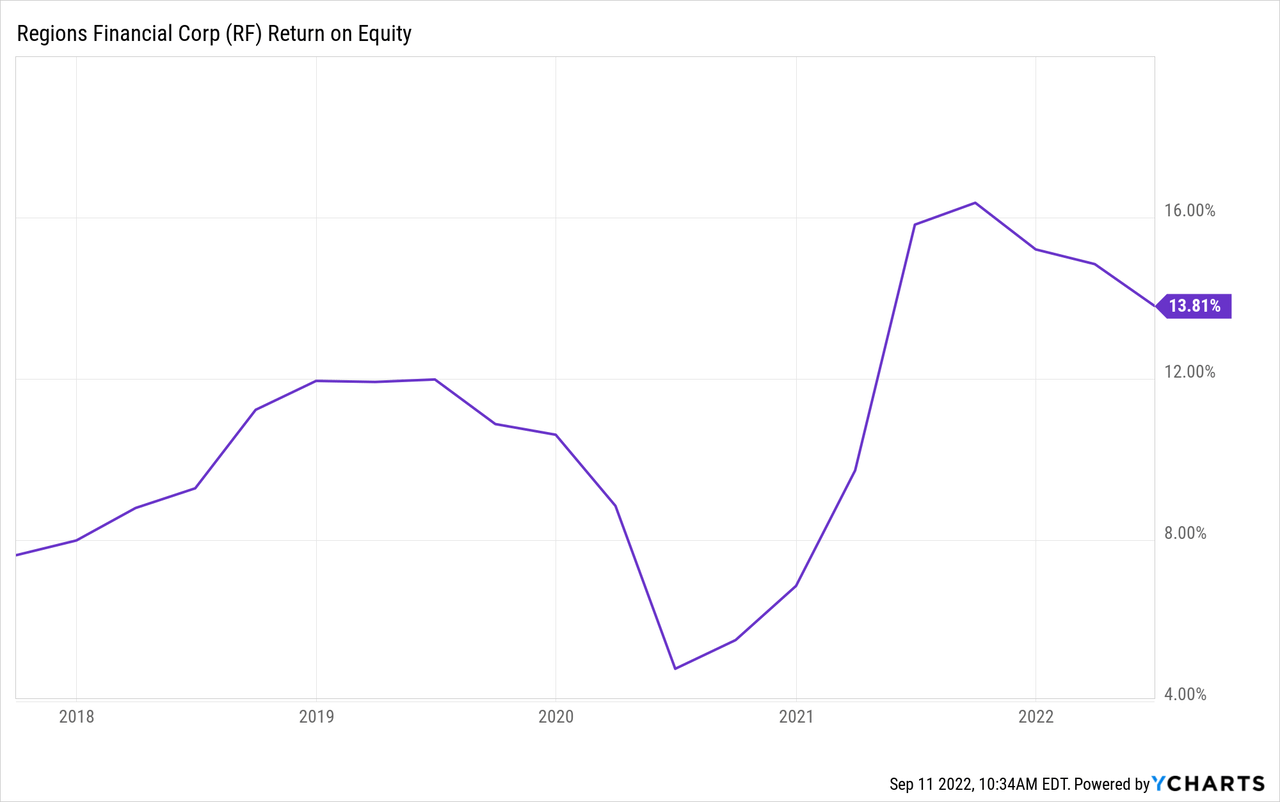
Return on equity averaged 8.5% in the five years prior to the 2020 pandemic. After falling in 2020, ROE rebounded to 13.8% in 2021, which was the highest since 2014. At the end of Q2, ROE was 13.0% (annualized) due to reduced net income in the first half of the year. Return on common equity has followed the same trend, declining into the pandemic, but then rebounding to 14.5% in 2021. At the end of Q2, ROCE was 17.3% (annualized). It should be noted that equity has decreased quite dramatically this year, primarily due to the accumulated other comprehensive income (AOCI). The AOCI has been impacted negatively by the unrealized losses on debt securities and hedges. When fixed income markets rebound, we would expect the AOCI to turn positive, which would increase equity, and decrease the ROE figures.
Debt to equity has been declining over the past few years, peaking at 0.93 in 2018, then declining to 0.13 at the end of 2021. Interest coverage ratios are strong, with 2021 reporting a 20.2x interest figure, well above the historical range. As interest rates continue to rise, this will be something that bears watching to ensure the company maintains adequate interest coverage. But even then, with the little reliance on debt for funding, the interest expense on deposits remains very low, so the interest coverage should not be an issue.
Stock Performance and Valuation
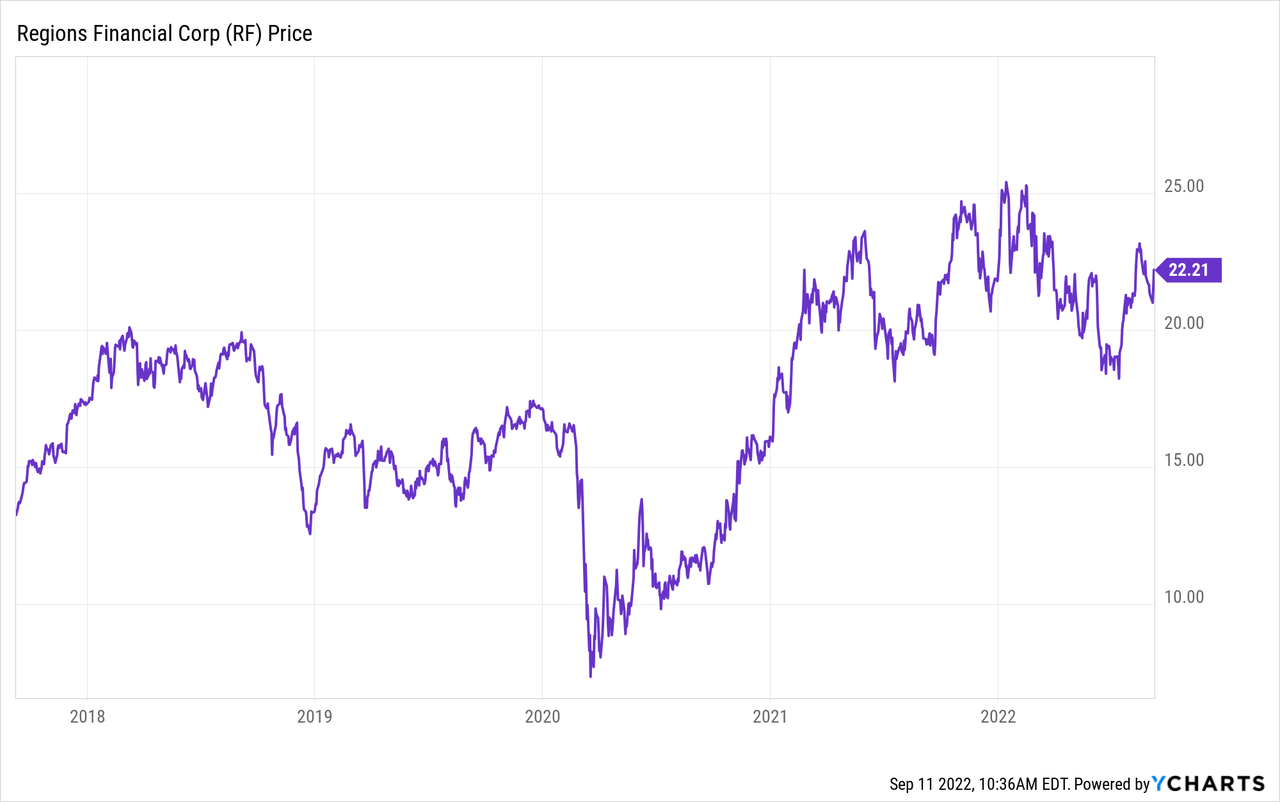
RF is one of many good, quality regional banks that I have looked at so far. The stock has traded in a range between 18 and 24 for most of the past 12 months.
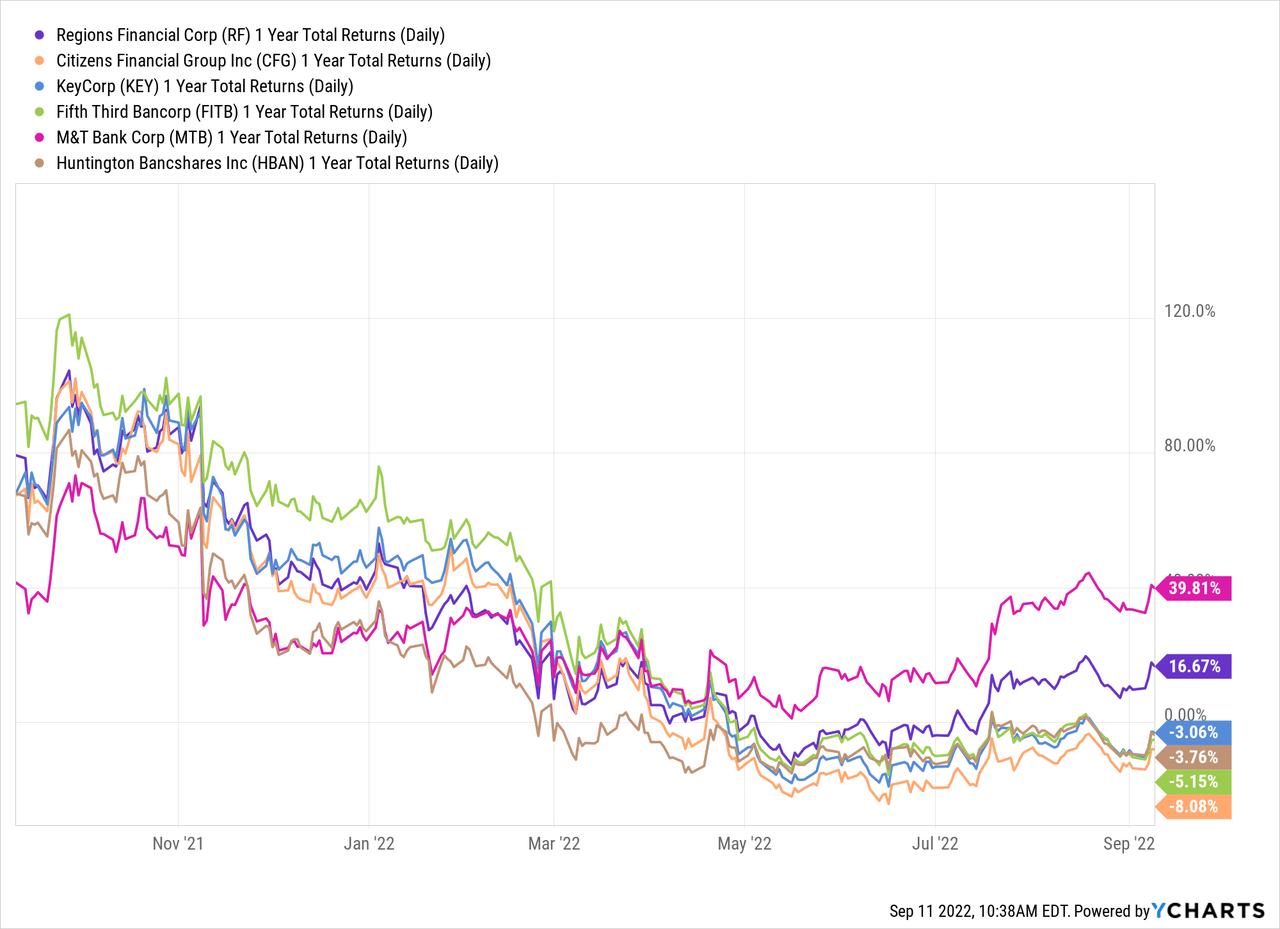
Compared to its peers, RF has actually performed very well over the past 12 months, returning 16.7%, second highest among the peer group.
On a year-to-date basis, RF is still a high performer within the peer group:
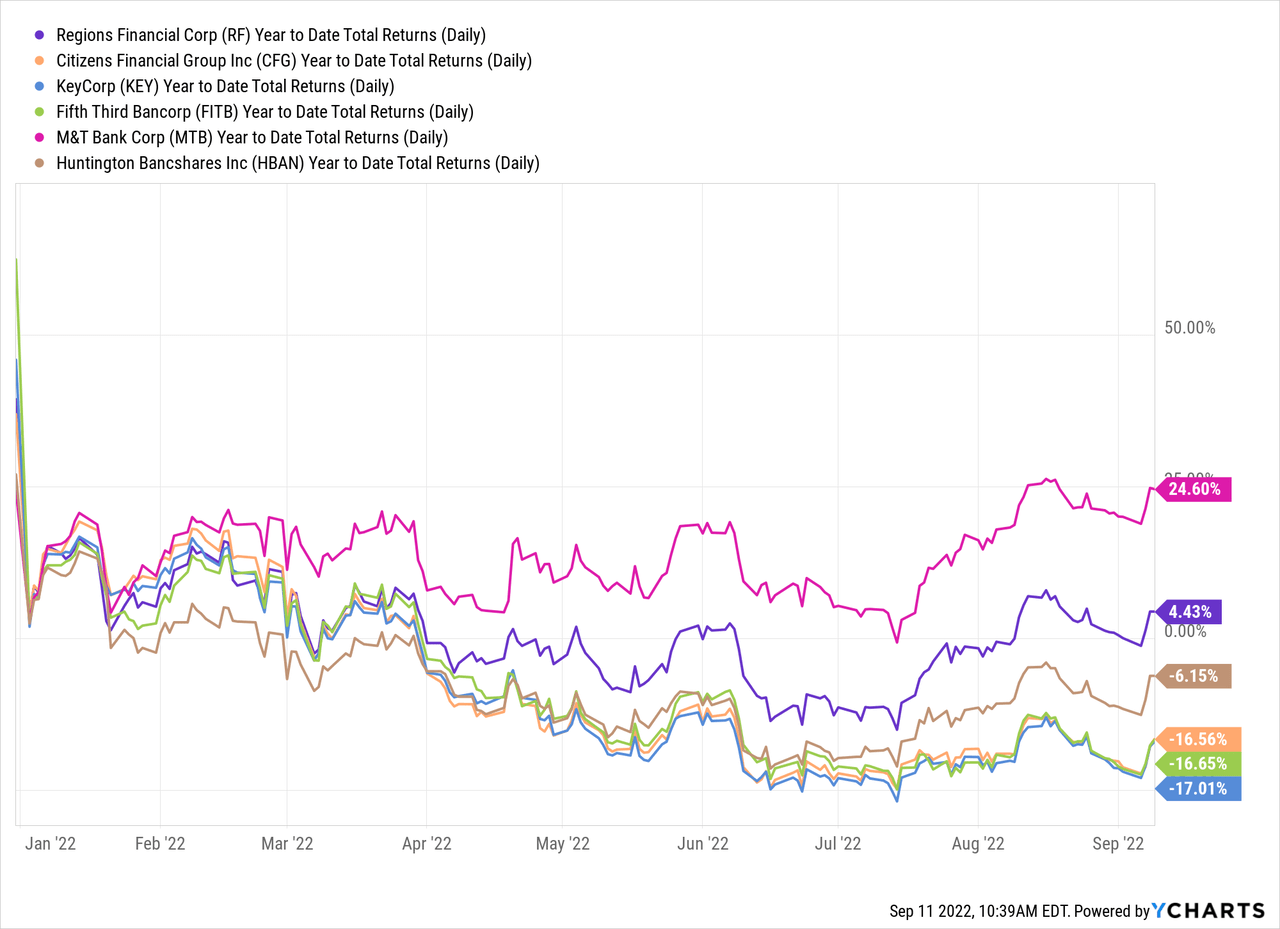
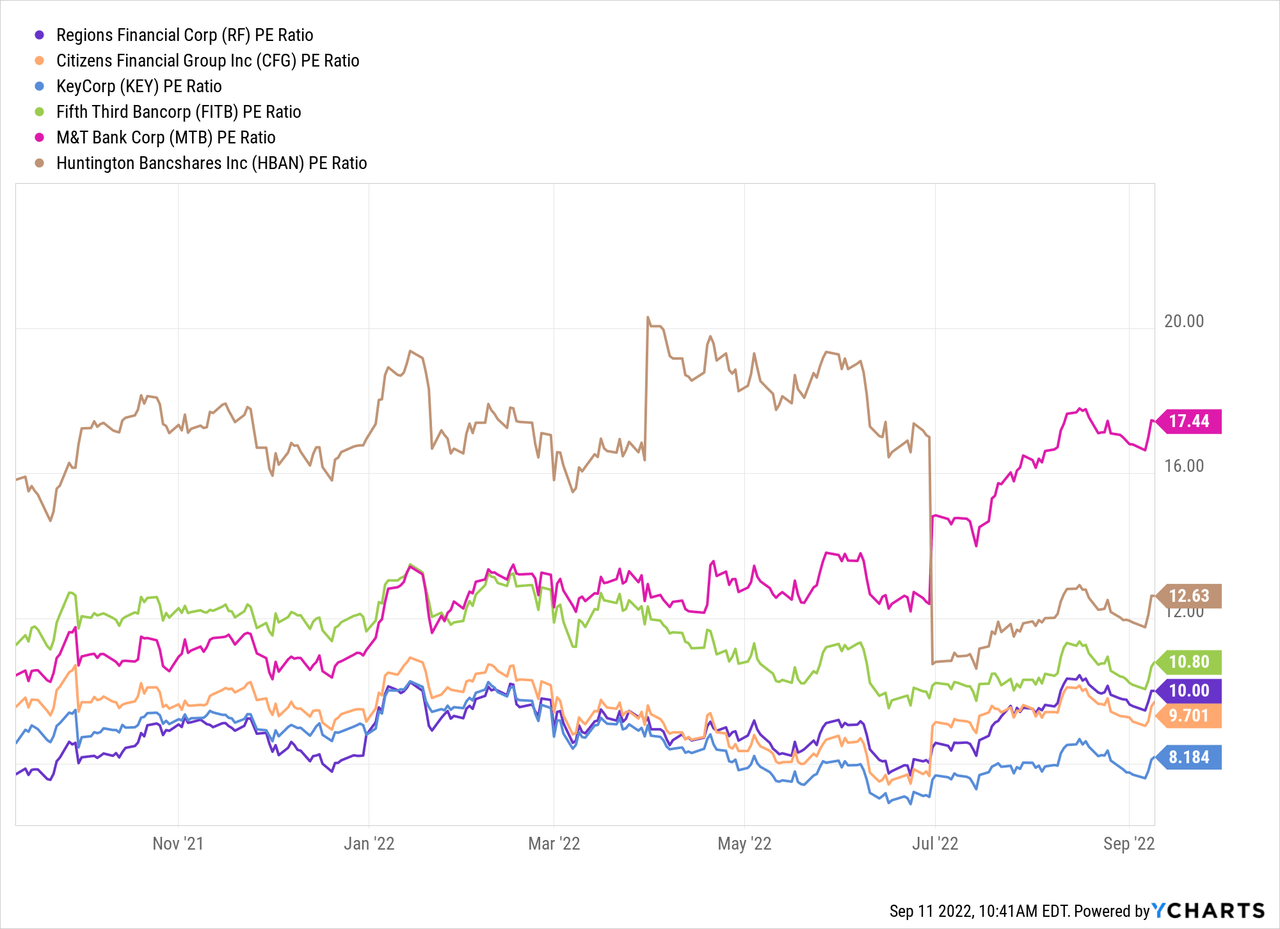
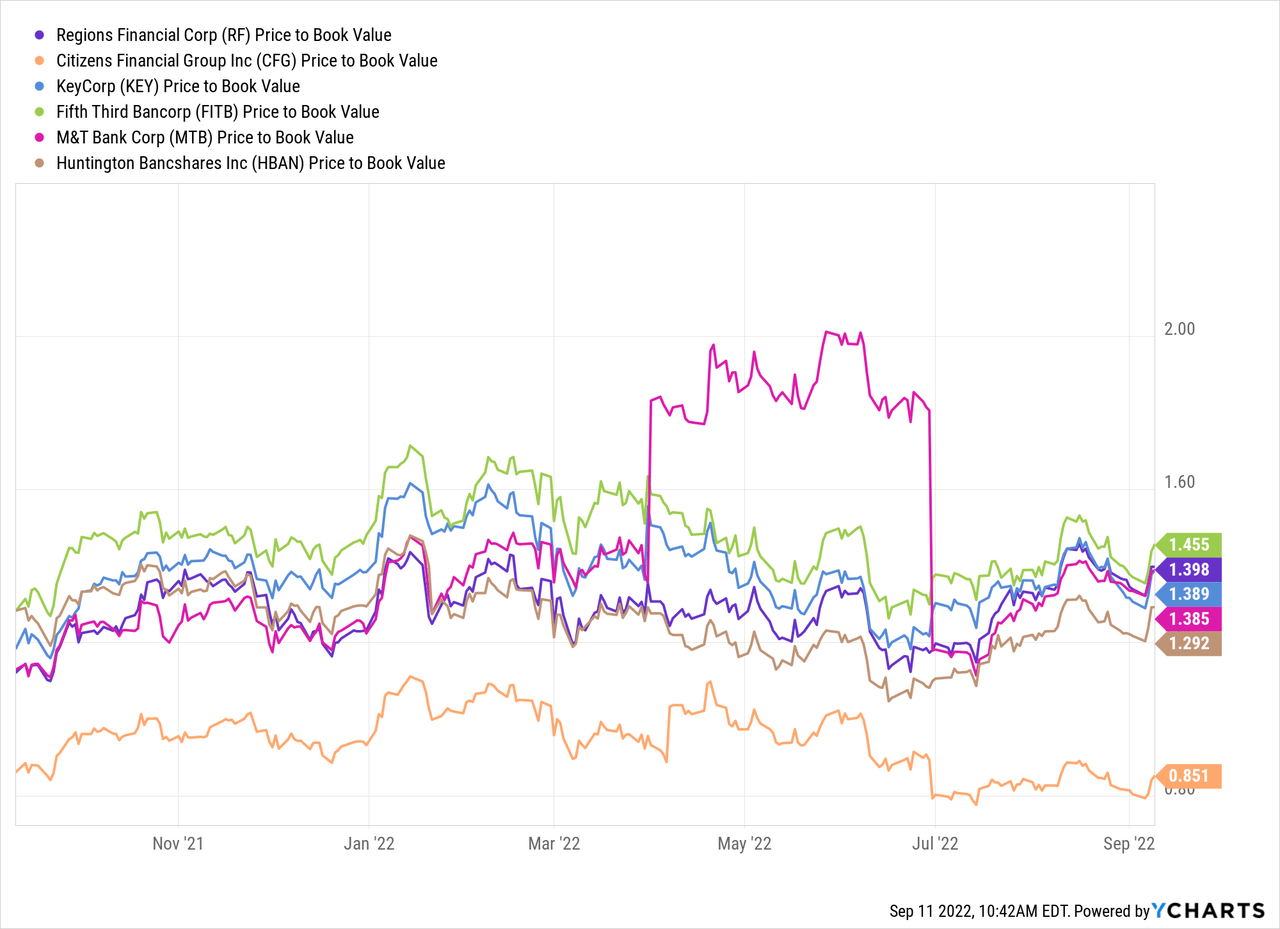
At a recent price of $22.21, the stock is trading at 10x last twelve months earnings with a 1.4x book value ratio. The P/E ratio is well below the five-year average, while the P/B is higher than the five-year average. Compared to several of its peers, RF has a slightly below average P/E ratio and a slightly higher P/B ratio.
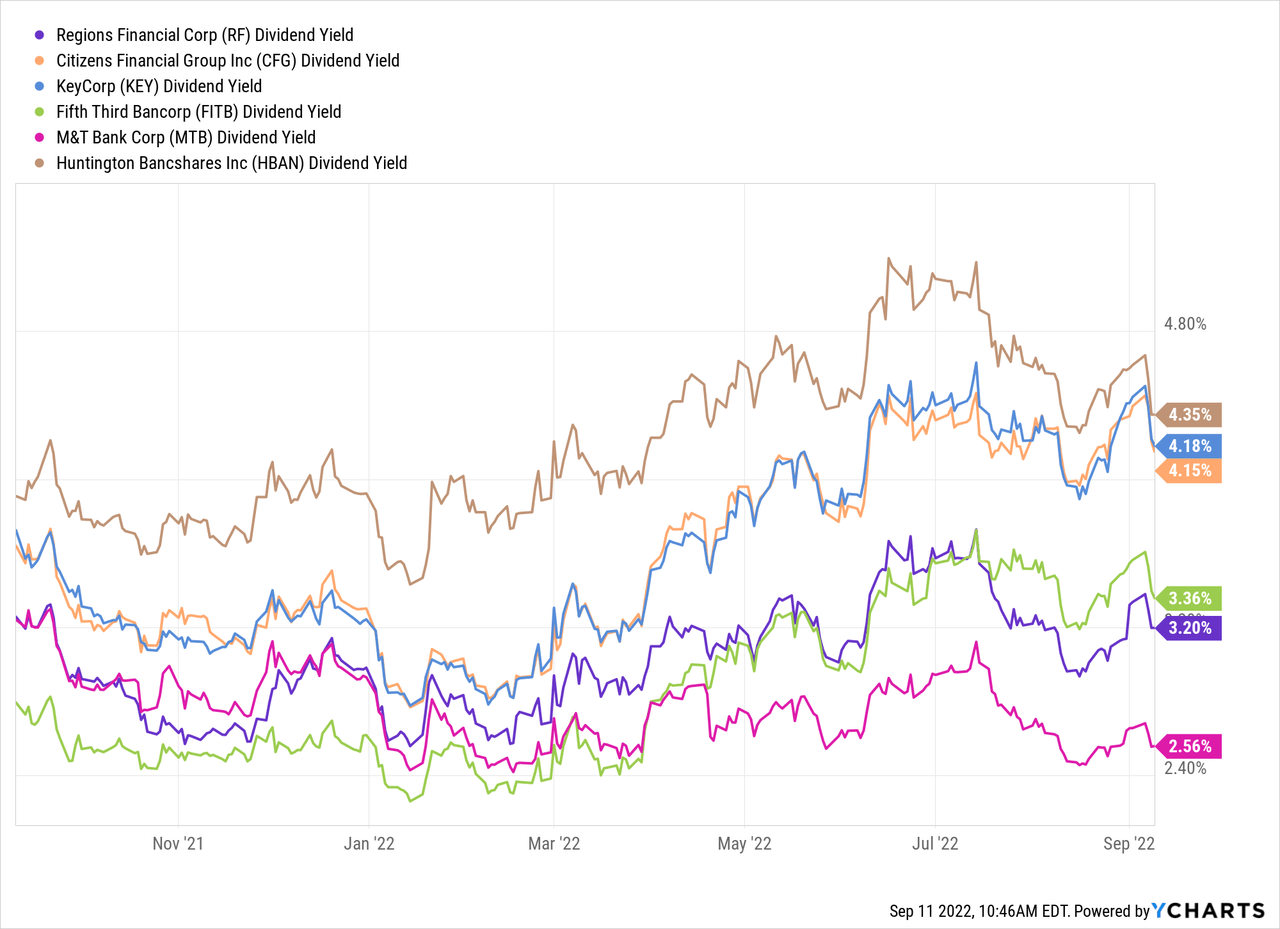
Additionally, the company has paid a steady dividend over the past several years, although the dividend hit a headwind with the pandemic in 2020. However, the company announced a significant increase to the quarterly dividend in the third quarter, an increase of 18% to $0.20 per share. The current yield on the stock is 3.20% (last 12 months) or 3.60% (next 12 months) which is slightly below the peer group average.
Using a variety of valuation methods, the fair value for this stock is about $21, so the stock is basically fairly priced. I think the stock is a hold at these levels. The dividend is safe, but the yield is below average. The stock has performed well this year, against both the peers and the broader market. I think there are other regional banks that offer better value at the moment, such as KEY or HBAN, but investors in RF could probably hold on right now. I do not have any qualms with the company or the financials, but the value is about right.
Regions Financial is a great, strong regional bank, with a solid operating history. The company has a diversified service offering, which is critical during a challenging economic backdrop. The stock has performed well recently, but with a safe dividend and additional buybacks possibly in the near term, investors should be able to sleep well at night with this stock in their portfolios.
Be the first to comment