

Ron Crabtree/DigitalVision via Getty Images
The Rally Will End
No matter what you want to call it, the current rally is destined to end badly. After the fact, some will call it a relief rally to indicate that investors were buying out of relief that the Fed didn’t increase the Fed Funds rate by a full percentage point. Others will say it was a dead cat bounce that happens when stocks get temporarily oversold and bounce higher.
The better name for the rally is either a bear market rally or a bear trap. In this instance the market jumps solidly higher, but well below the earlier high, only to fall to a lower low. As the markets grind lower, these rallies tend to grow bigger. During the Financial Crisis three minor rallies occurred from the fall of 2007 to the summer of 2008 of 8%, 12% and 7% suckering in new longs eventually to only wipe them out as the S&P 500 Index fell 56% from top to bottom.
Yahoo! Finance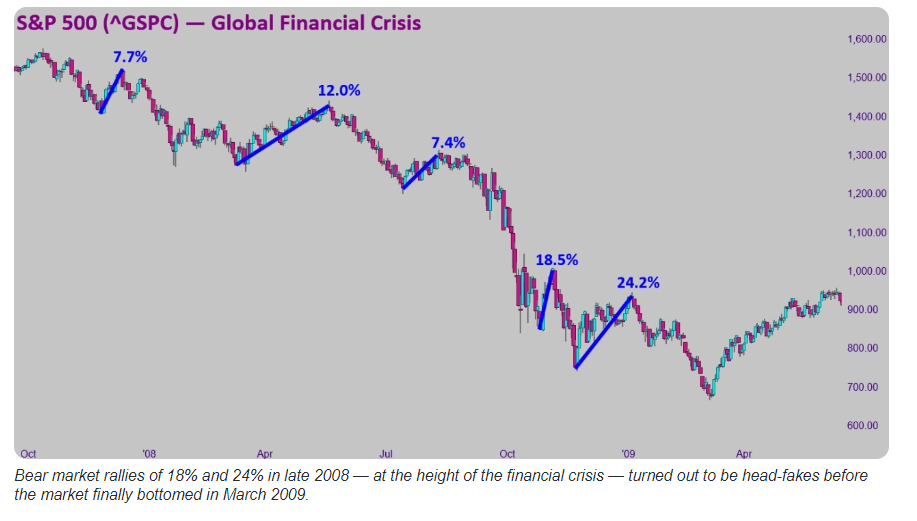
But those were not the worst rallies during that bear market. Rallies of 18.5% and 24.2% came later before the eventual bottom. Even in the bear market of 2001-02 there were 5 strong rallies.
Yahoo! Finance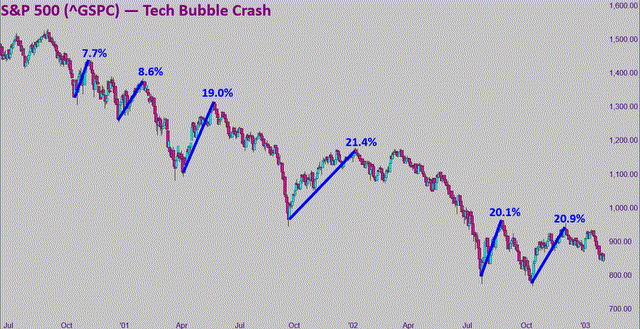
The current rally just reminds me that bear markets are rarely over when investors want them to be over. This time is no exception. I suspect that the economy will fall into recession “officially” within the next 6 months and below are my reasons for thinking that way.
Recession Indicators
The following graphics are from The Daily Shot. They send me an email each weekday with economic analysis in visual form that has come out from all over the world. I’m not sure how I would keep up without it. These charts are a small sampling of what I was able to glean over the course of a week and represents only a tiny fraction of the total picture. But it tells a story better in images than I could in words.
The PPI, or Producer Price Index (what manufacturers pay for parts, labor and other inputs) is still rising and the CPI (Consumer Price Index) often lags the PPI.
Daily Shot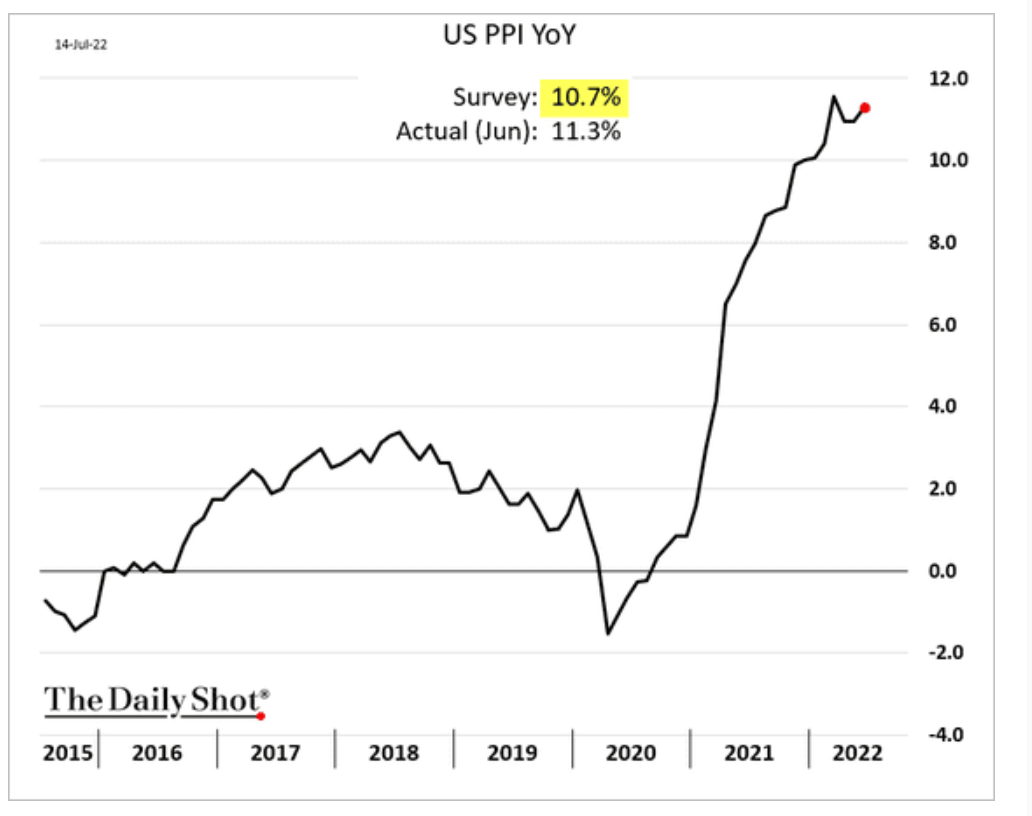
If the PPI is rising, U.S. producers of both durable and nondurable goods will keep trying to pass on higher costs to consumers.
Business labor costs are rising at the fastest rate in 4 decades. If labor costs continue to rise it will be difficult to tame inflation, which would mean interest rates could rise more than the market currently expects.
Daily shot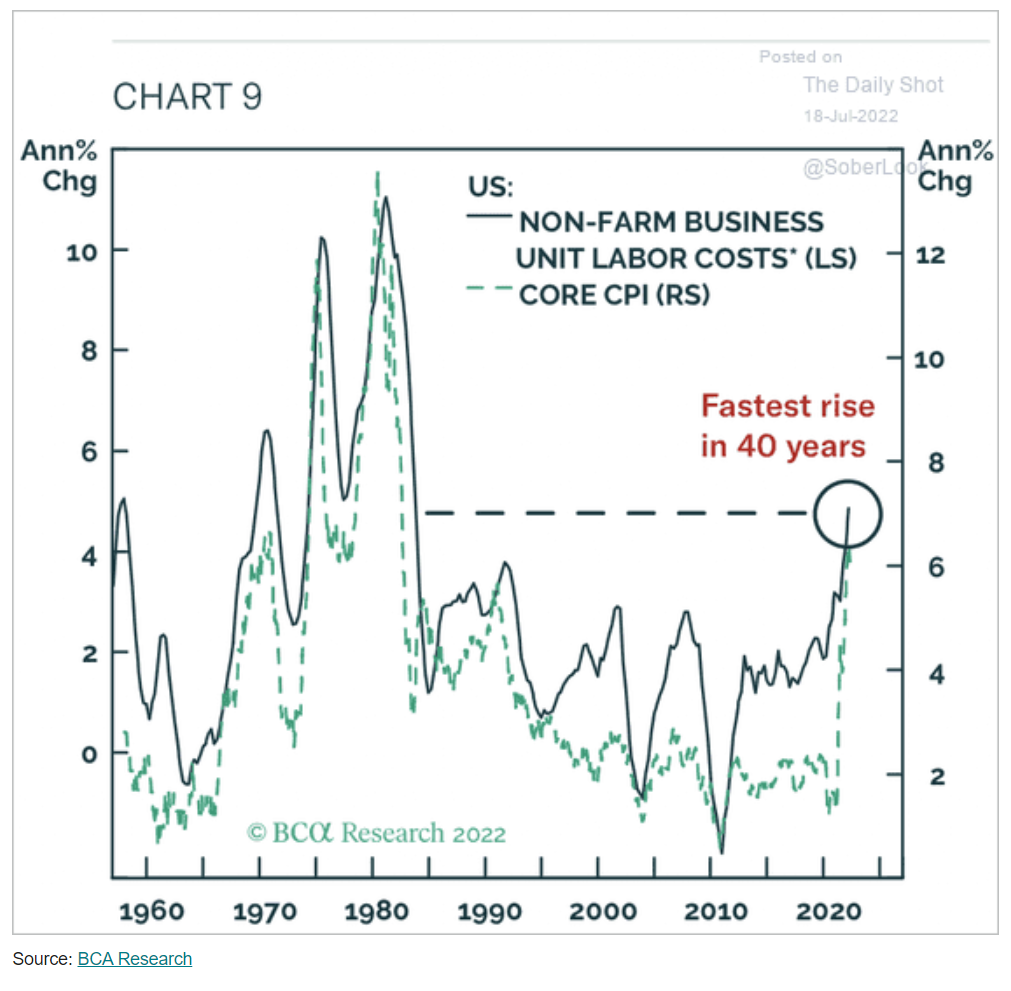
Sticking with manufacturing for now, the industry outlook is looking grim.
Daily shot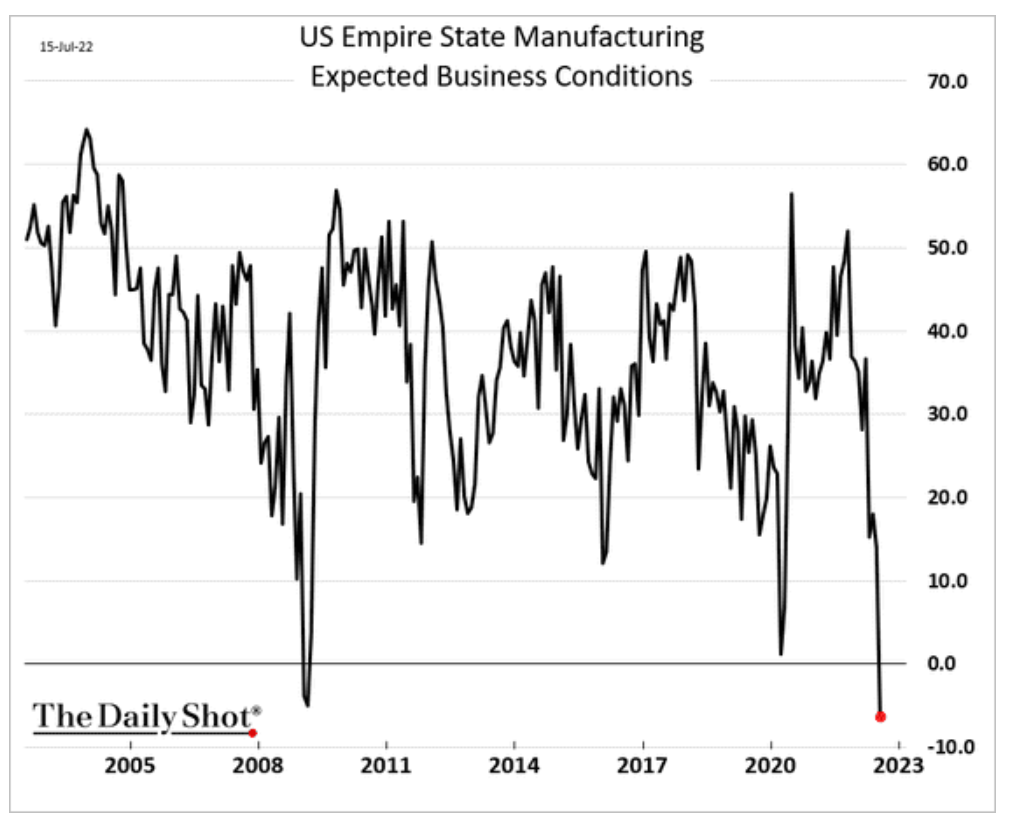
The Empire State Manufacturing index presented by the NY Fed is indicating readings from other Fed districts around the country and it is projecting contraction. Below, the new orders expectation from the Philadelphia Fed tell the same story.
Daily Shot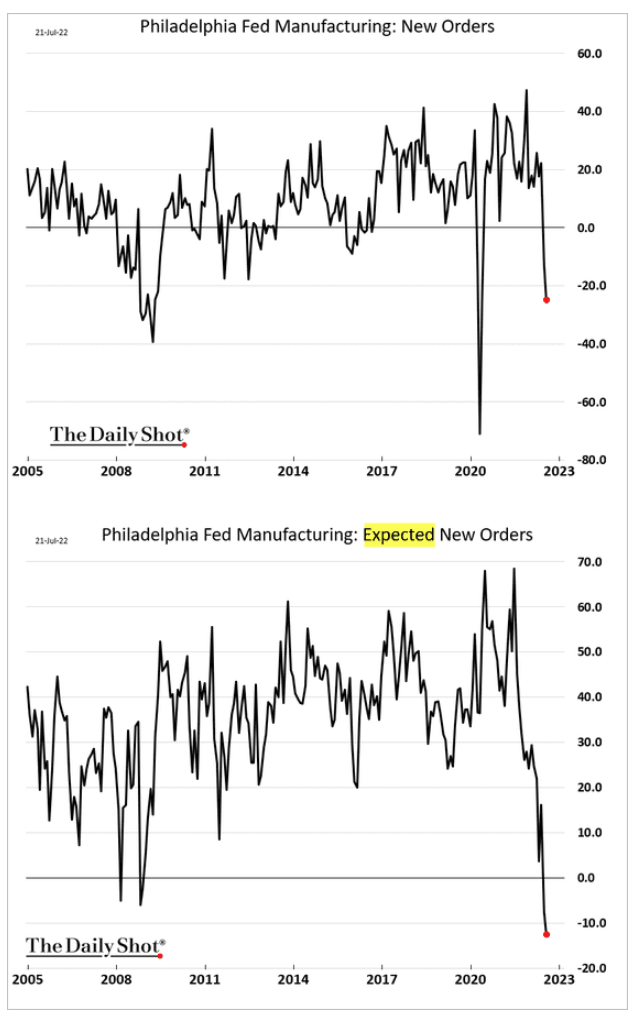
The current drop in expected new orders is the worst since the Financial Crisis period.
One final picture regarding the manufacturing sector. Results from the Philly Fed often lead the ISM manufacturing index, also known as the purchasing managers’ index, which is a national measure of manufacturing activity.
Daily Shot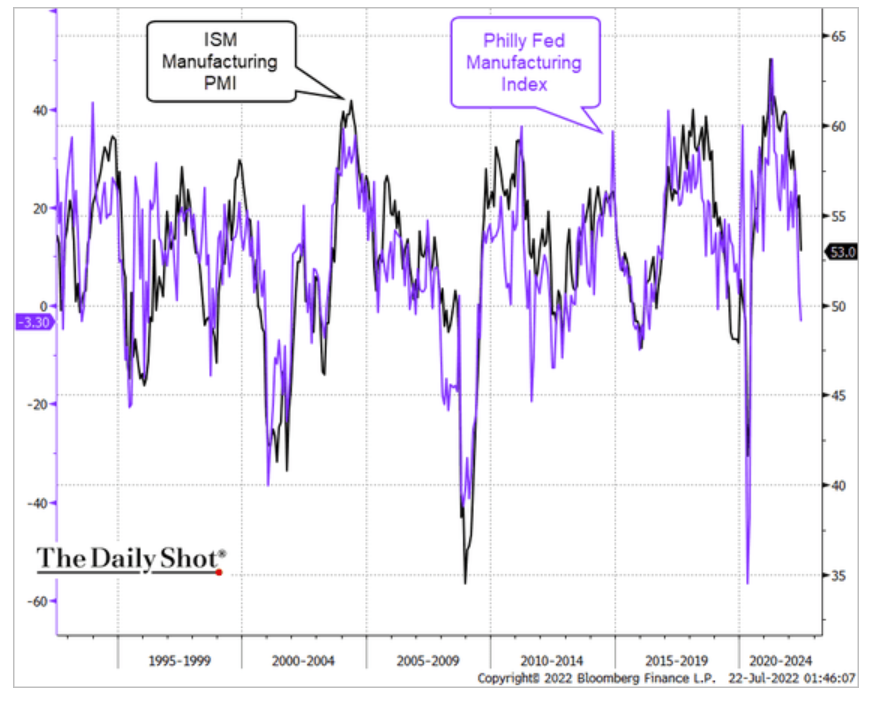
The housing boom is fading. Prices continue to rise and mortgage rates have further to rise so sales should continue to fall. This has been the second longest housing boom since 1973. I believe it is already over and home sales will remain flat to lower for the remainder of the year.
Daily Shot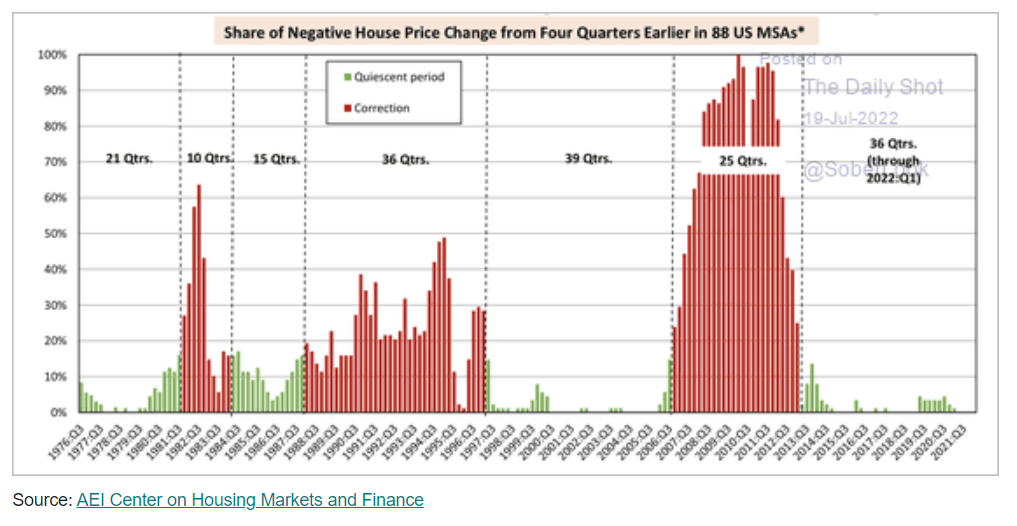
Housing is a big contributor to economic growth because, not only does it support construction and materials manufacturing but also increases growth in furniture, appliances and many assorted other things that people buy when they move into a newly purchased home.
Rental rates are surging across the country.
Daily Shot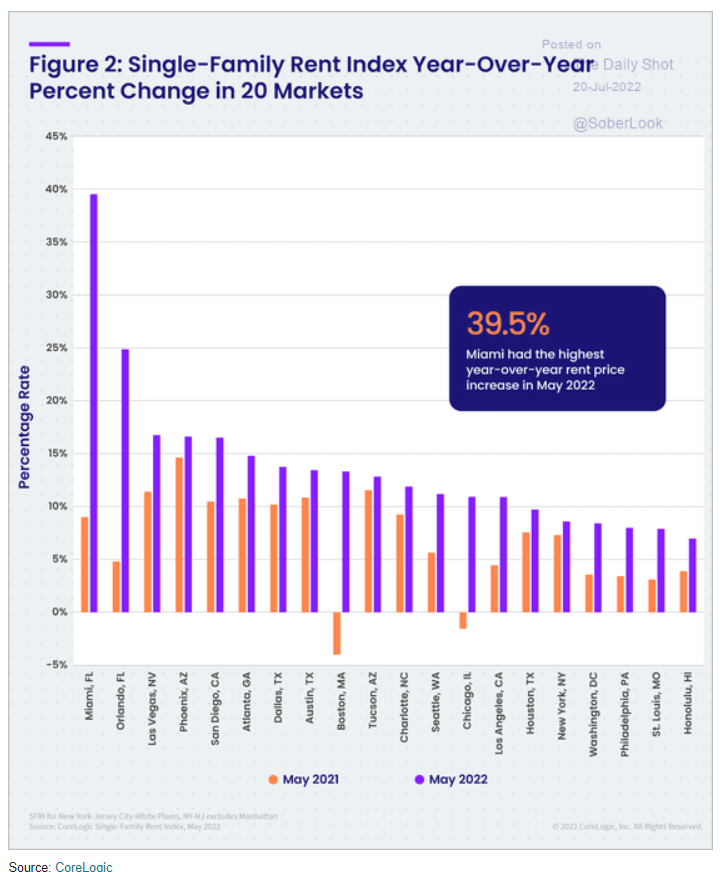
If home prices continue to rise, rents will follow. Combined, rents and owner’s equivalent rents (cost of home ownership) make up over 1/3 of the CPI calculation. So, even if other things like energy and food begin to drop, rent increases could keep upward pressure on inflation. And again, if inflation does not slow enough, the Fed will continue to raise interest rates longer and higher than the markets expect; thus, creating a greater drag on economic growth.
Now, let us look at the consumer side of the equation. If consumers believe a recession is coming, they are more likely to reduce spending which is self-fulfilling, leading to the recession that is expected.
Daily Shot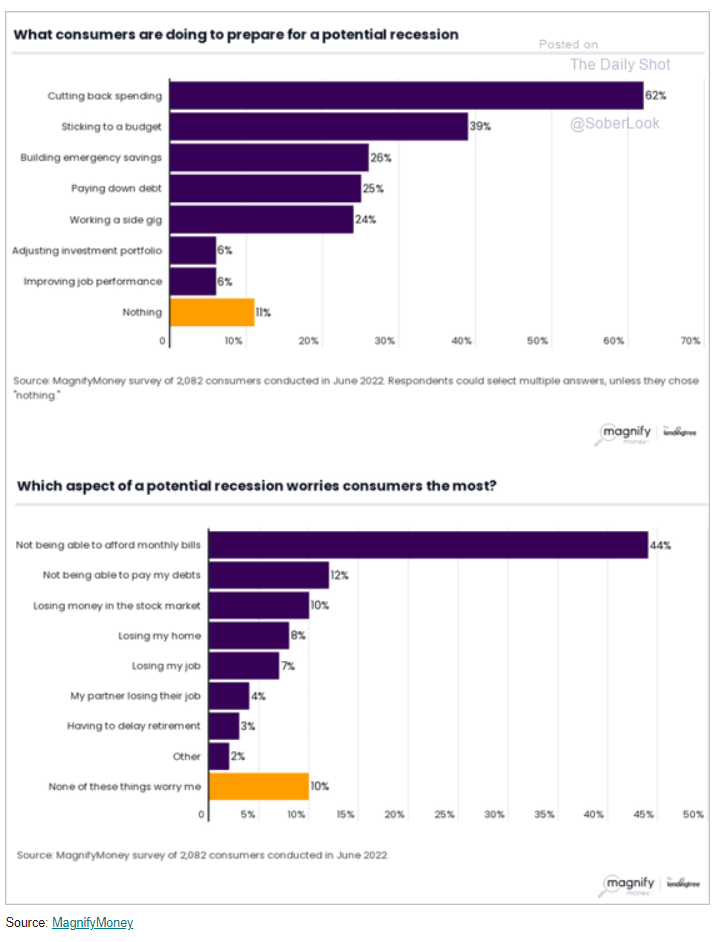
Recession Indicators
Now we can look at some models that try to predict recessions. First up is one not many readers have heard about before, the Piper Sandler Recession Risk Index.
Daily shot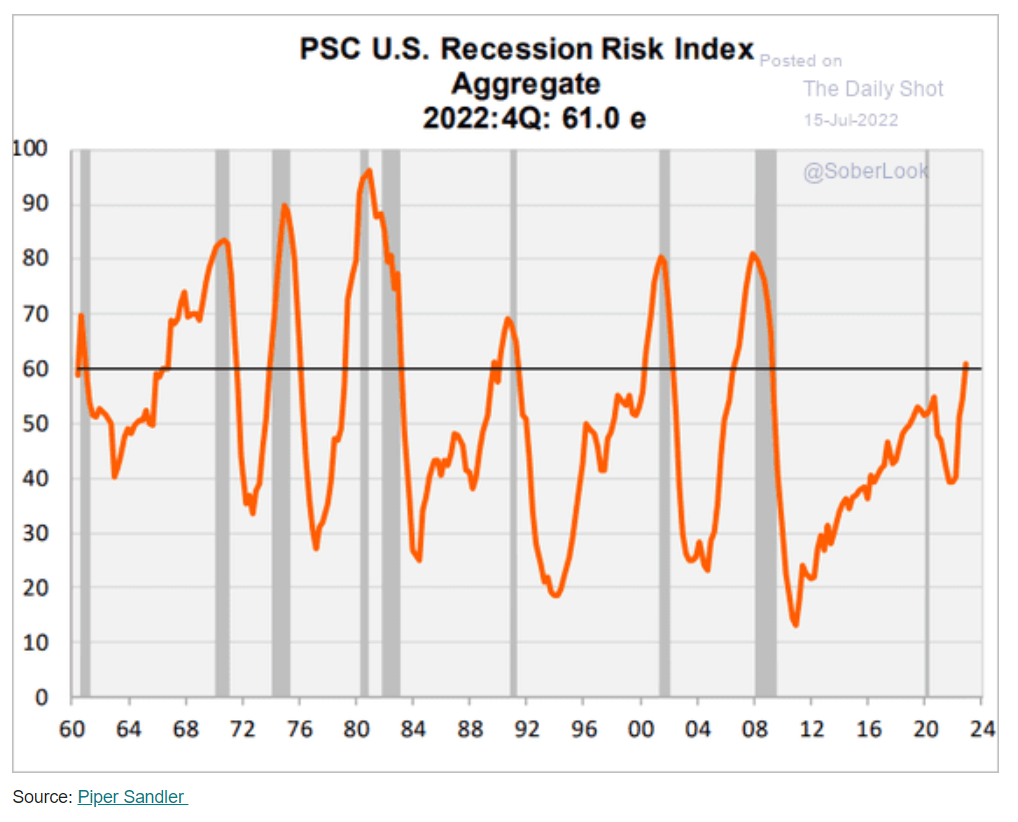
Notice that whenever the orange line (index) has reached the horizontal black line, the U.S. economy either was in a recession or about to enter a recession. It is often early so, taken alone, it is more of a good gauge of when to take a more cautionary stance when investing.
Next, we have the 10-year vs 2-year Treasury yield spread. Again, it is not always perfect but is right far more often than it is wrong.
Daily Shot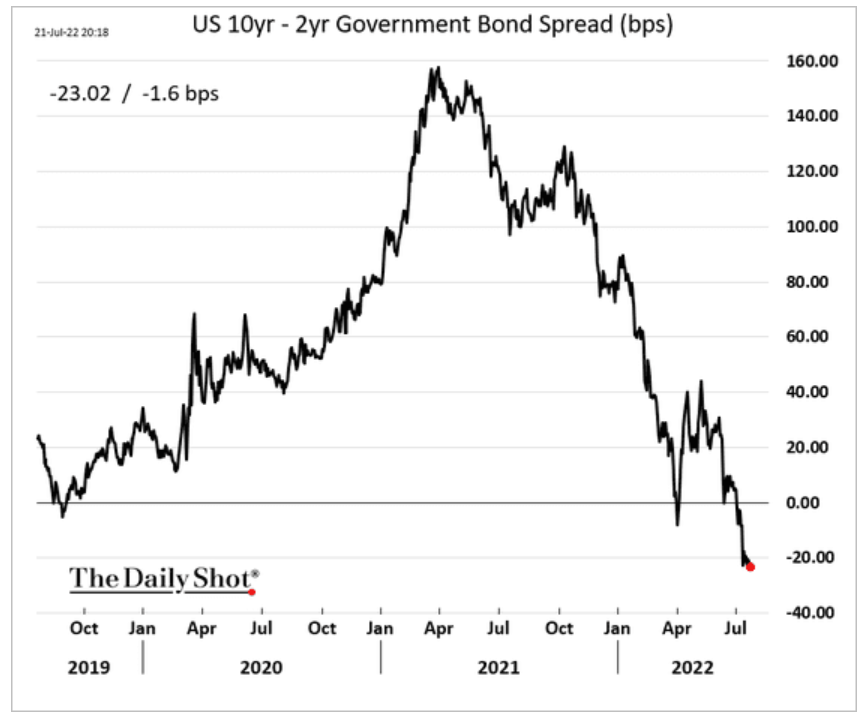
When the spread dips into negative territory economists generally expect a recession within the next 6-12 months. At negative 23 basis points (or .23 of one percent), the spread is deep in negative territory. The reasoning is that bond investors are willing to accept lower yields on longer term notes when they expect a recession is imminent.
The following chart combines two indicators, one based upon the above 10/2 yield curve and the other based upon the Conference Board’s consumer confidence index (expectations sub index).
Daily Shot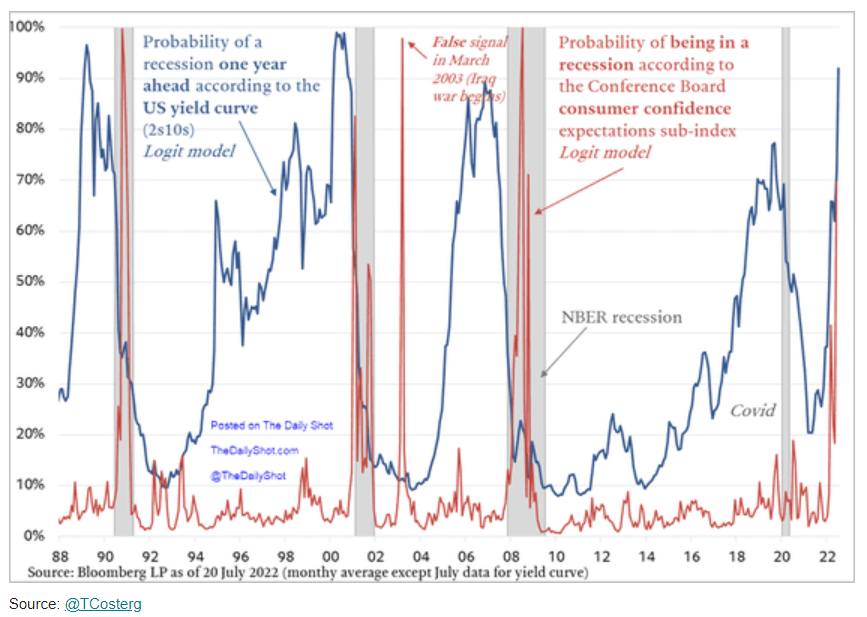
In the three prior recessions (excluding 2020 because it was so swift and short), both readings became elevated prior (or at the very beginning) of each recession. Current readings are indicative of a recession coming sometime within the next year or less.
The Conference Board U.S. leading Index indicator (below) has touched the line that indicates a recession is imminent. If it continues to fall, then we may already be in a recession.
Daily Shot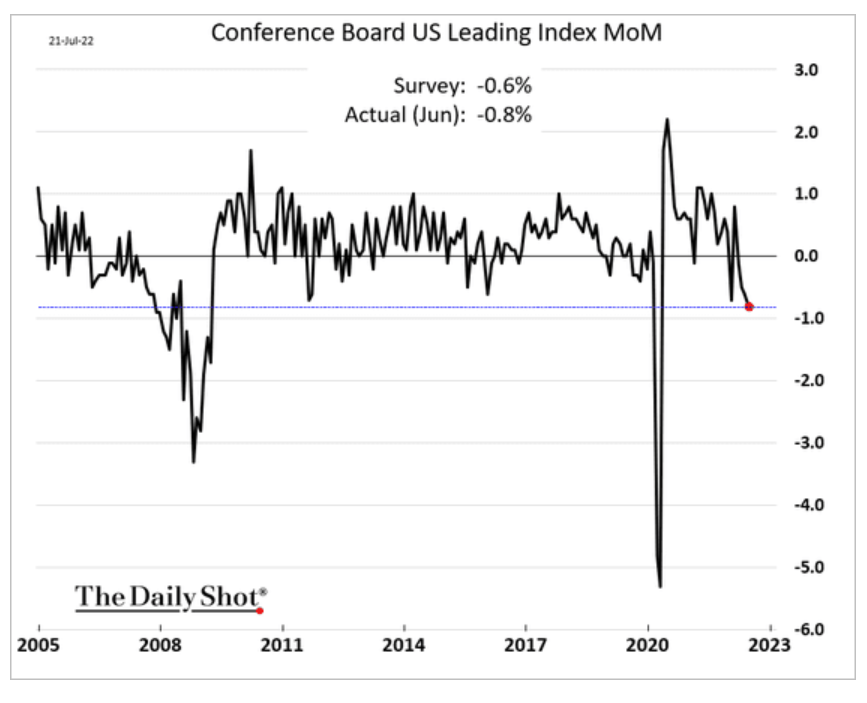
Bloomberg Economics suggested that the U.S. economy may already be in a recession based on two consecutive quarters of economic contraction. The 2nd quarter GDP report was worse than projected by the NY Fed’s Nowcast.
Daily shot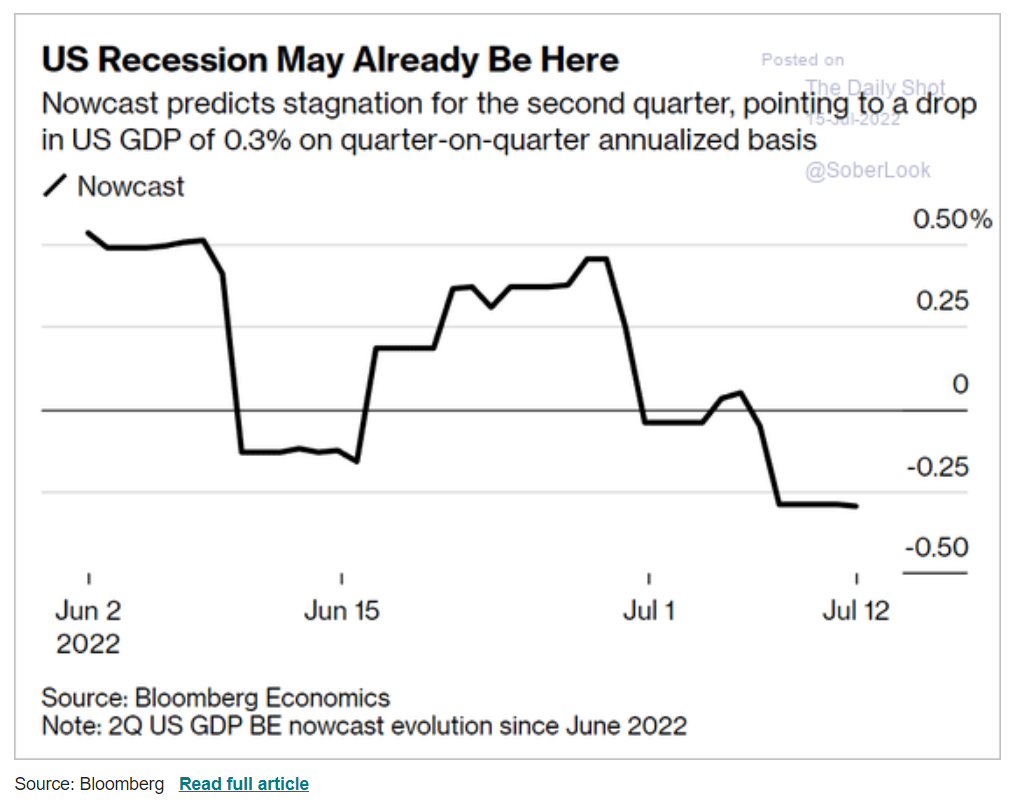
Based upon the Fed’s Beige Book report, which comes out after each FOMC (Federal Open Market Committee) meeting, the strength minus weakness economic diffusion index also indicates that the economy is heading for a recession. Fed Chair Powell cannot tell us that we are in a recession or that we are heading for one unless it has already become official since it is the Fed’s job to keep the economy out of a recession. So, he simply appears to be optimistic that the Fed will be successful, or the economy would fall apart earlier than otherwise.
Daily Shot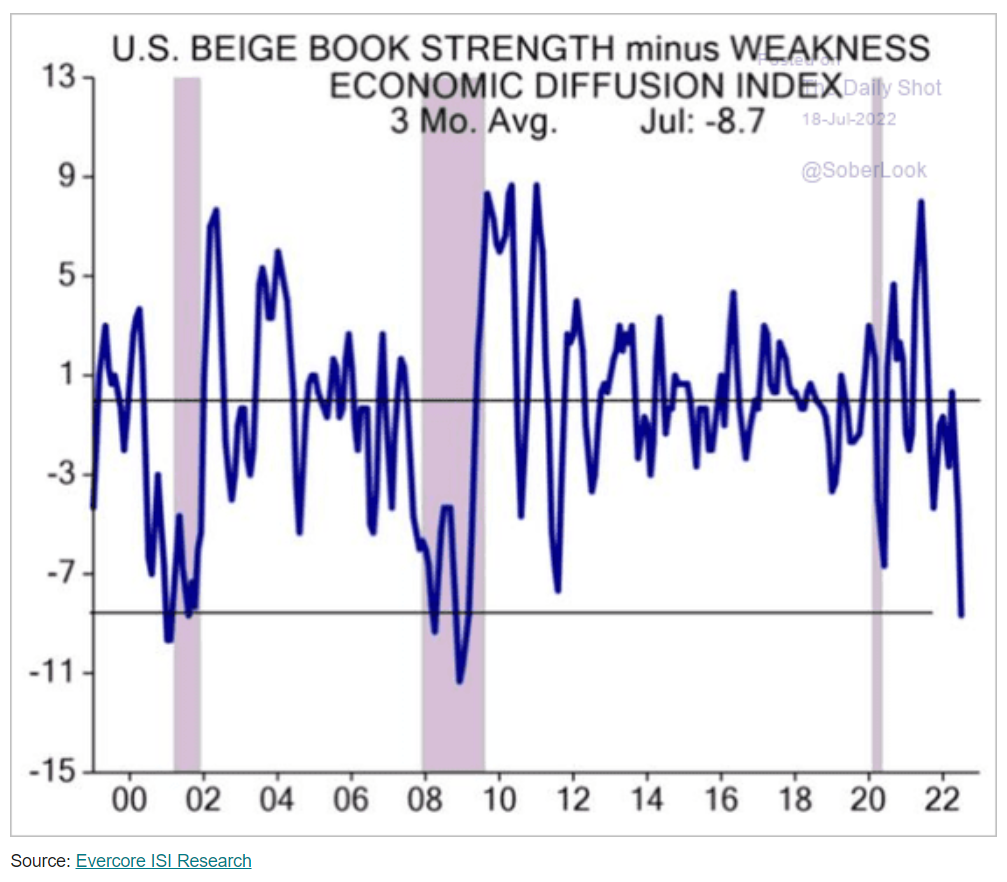
Who is expecting a recession? Well, just about everyone who matters.
Daily Shot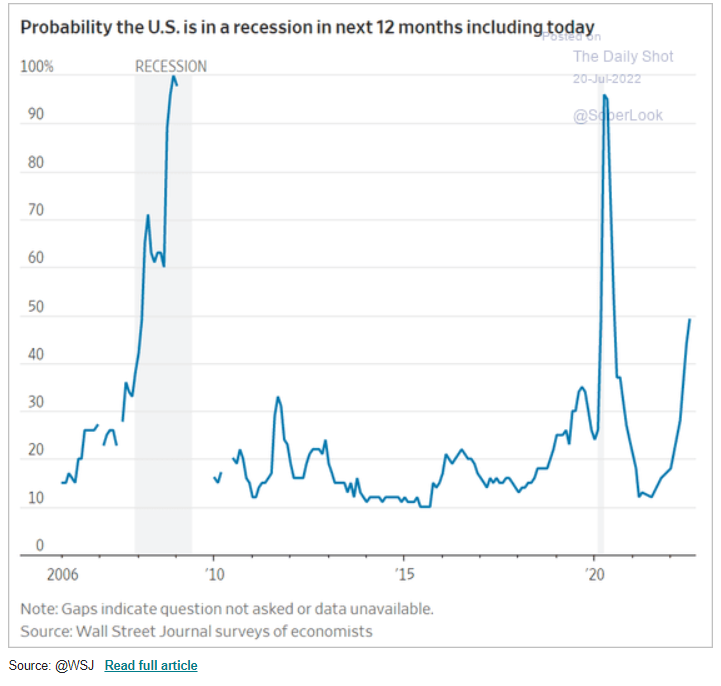
When the percentage of economists surveyed who expect a recession rises above 40%, we usually are heading for a recession. We are now near 50%.
Daily Shot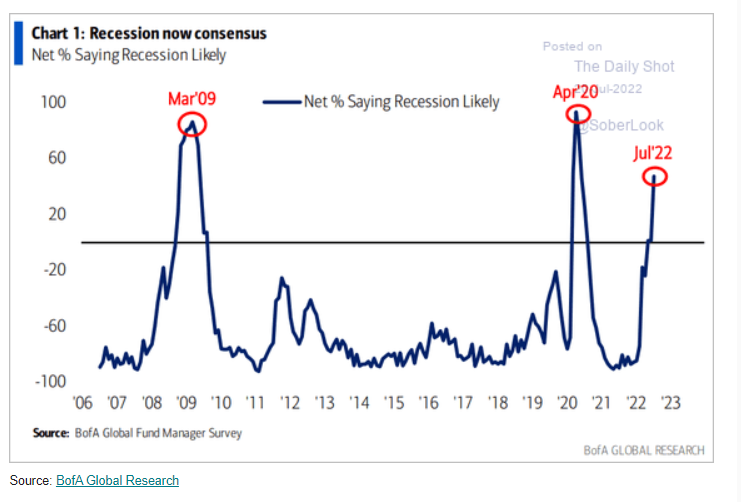
When Fund Managers decide a recession is likely, a recession is usually already in progress. According to the above chart, fund managers have reached a consensus that a recession is likely. That is a bad sign because they are usually optimistic about growth and tend to be late.
The one indicator that is not yet flashing a warning signal is the Sahm Rule Recession Indicator shown below.
St. Louis Fed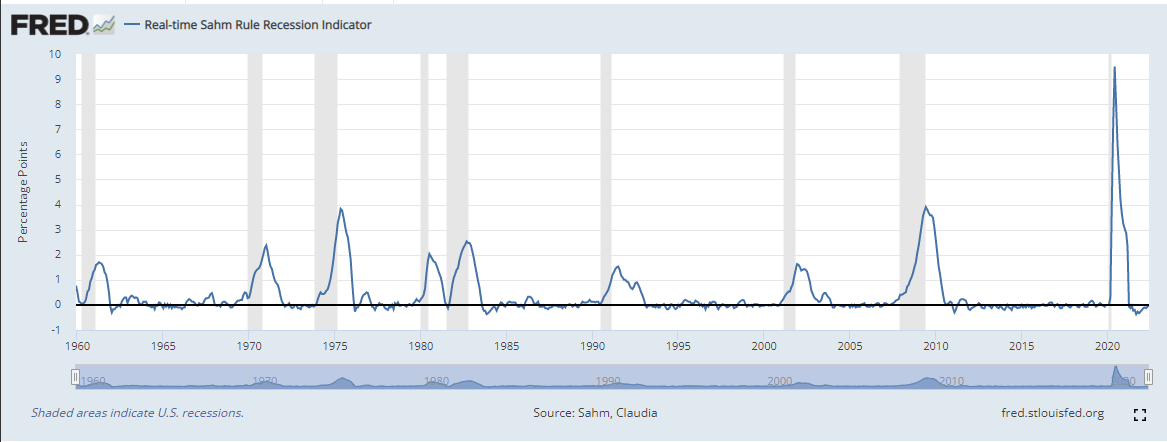
The Sahm Rule says that when unemployment rises at least .5% from its lowest point in the cycle, a recession is imminent. It is uncannily accurate. But it is also less predictive than some indicators because unemployment is a lagging indicator. So, when unemployment reaches 4.1%, we will probably already be in a recession.
The Fed is in a Precarious Position
The Fed continues to be optimistic about being able to bring down inflation without harming employment to the extent that the economy loses jobs. Many investors believe that the Fed will be able to begin reducing interest rates in early 2023.
There are those on Wall Street who feel that we are close to the inflection point that came about in 1982 when then Fed Chair Volker announced that inflation had been defeated and interest rates could start coming down. Let us look at a chart from history.
Yahoo! Finance Morning Brief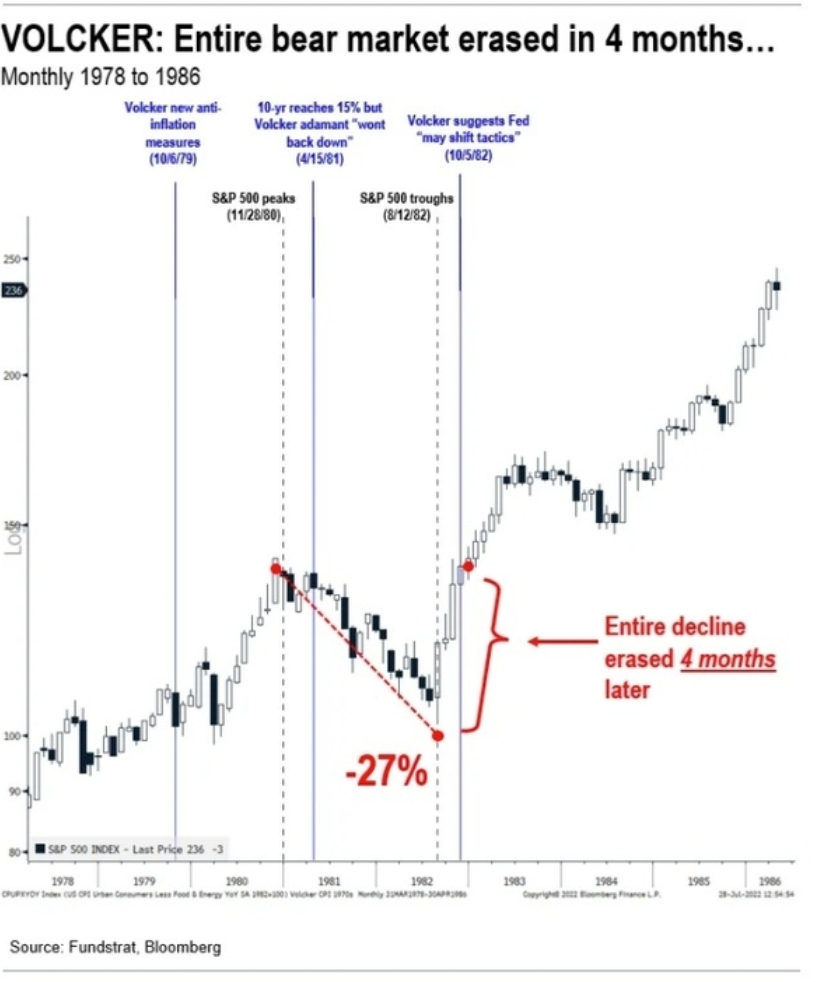
Source: Yahoo! Finance Morning Brief
The bear market began in 1980 and lasted 22 months (about 2 years) . Our current bear market started only 7 months ago. Inflation peaked at the beginning of the bear market in 1980. Our inflation probably peaked in June. Inflation was not concurred until early 1982; it is more difficult to bring inflation under control than the current crop of market gurus understands. The great bull market did not begin until inflation was defeated, and rates began to ease. We may have another 6 months to a year (or possibly longer if the Fed wavers) before the war against inflation should end. I think, compared to the chart above, that we are now in the mid- to late-1981 stage. There is much longer to go to reach a final bottom.
If the Fed prematurely begins to lower rates, inflation will take hold again and could get worse, requiring rates to eventually go higher than would otherwise be needed. That would lead to a double-depth recession with a lower low and a lot more pain. If the Fed sticks to its guns and keeps raising rates until inflation has been wrung out of the economy, I believe a recession will come sooner than the market has expected. That means we should experience another leg down before a sustainable bull market can be established.
To answer the question presented in the summary bullets: I do not believe the Fed can pull off the magic trick of controlling inflation without harming employment. It is too tall an order.
I continue to hold most of my portfolio in cash until I find obvious signs that the bear market has ended, and favorable market conditions are more probable.
Be the first to comment