

koto_feja
The S&P 500 is in a bear market, the S&P 500 is down about 13% this year and measured from its peak the S&P 500 is down 24%. Growth stocks have fallen much more, for example, Shopify’s (SHOP) peak and trough is -82%.
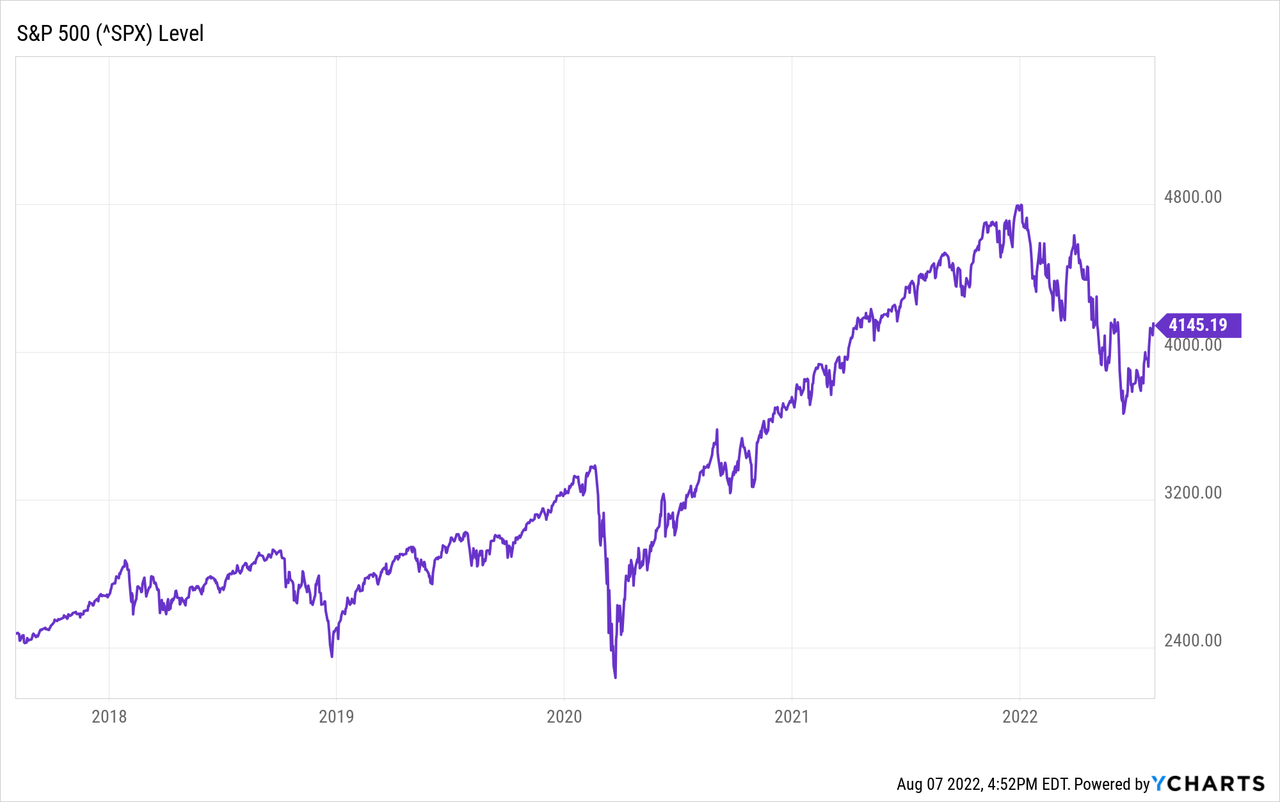
What happened this year? The world is currently in an inflationary environment, and recent data shows that US GDP has fallen for the second quarter. Unemployment remains low, but recently Walmart (WMT) decided to cut its workforce. Would multiple companies follow? These events are reminiscent of the 1970s: stagflation. A perfect storm.
In this article, I briefly review the past few years and describe findings about investment opportunities and my purchasing strategy.
Looking Back: Unemployment, Yield Curves, And The Corona Crisis
Let’s first look back at the end of 2015, the FED raises the Federal Funds Rate for the first time in years. Unemployment was about 5% and the FED expects falling unemployment to push up prices and thus inflation. And it worked. Unemployment has continued to fall to around 3.5% since 2015. And inflation hovered around 2% through 2020, as expected.
At the end of 2019, due to the rising Federal Funds Rate, both the 10-year minus 3-month treasury yield spread and the 10-year minus 2-year treasury yield spread inverted.
10-year minus 3-month treasury yield, Federal Reserve Bank of St.Louis (Federal Reserve Bank of St.Louis)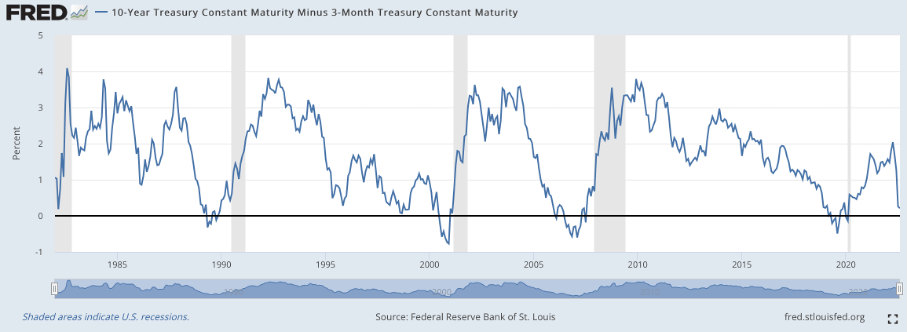
An inverted yield curve (where short-term rates are higher than long-term rates) is a good indicator for predicting the start of a recession. The recession periods are colored gray in the chart above. The inverse curve occurred at the end of 2019, parallel to the start of the corona pandemic.
Measures to prevent further spread of Covid-19 caused a sharp rise in unemployment and a fall in GDP. The FED responded by stimulating:
- Lowering the Federal Funds Rate.
- Mass Purchase of Debt Securities (QE).
- Provide relief to businesses and individuals such as the CARES Act.
The stimulus led to a very rapid recovery in GDP growth, as can be seen in the chart below.
United States GDP Growth Rate (Trading Economics)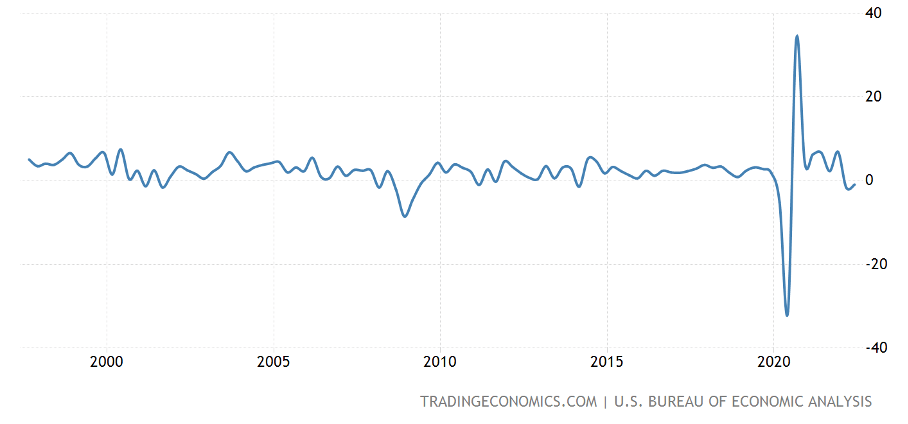
Inflation Turns Red-Hot
The stimulation by the FED caused a huge increase in the M2 money supply. An increase to 27% was measured in February 2021, a historically high change.
M2 yearly growth vs. inflation (Longtermtrends)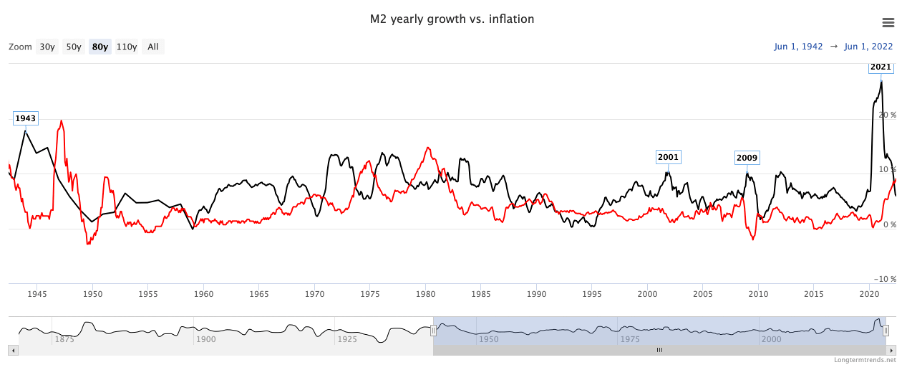
Shortly after increasing the M2 money supply, inflation rises. Inflation is now 9.1% and core inflation is 5.9%. The sharp rise in inflation is a result of the enormous increase in the M2 Money Supply. The Fed has overstimulated.
Tensions between Russia and Ukraine are also fueling higher inflation. The Russian invasion caused problems with food exports, resulting in an immediate rise in food prices. In response, the West imposed a partial embargo on Russian oil, causing the oil price to skyrocket. These measures contribute strongly to the increased global inflation.
Russia closed the natural gas pipeline several times due to maintenance work. A shortage of natural gas complicates the production of agricultural fertilizer products, which indirectly increases food prices.
Measures To End The Inflationary Environment
High inflation hits consumers: According to the US Census Bureau House Survey, a third of the US population has problems paying bills. In cities like Los Angeles and Miami, 4 in 10 people experience financial stress. Gasoline, energy and food, among other things, have become more expensive, while wages are lagging behind.
To lower inflation, the OPEC agrees to increase oil production, which will lead to a fall in oil prices. The price of a barrel of WTI Crude Oil peaked on March 8, 2022 and has been gradually declining since the announcement of the Inflation Reduction Act of 2022 on August 1.
The Inflation Reduction Act of 2022 describes measures to control inflation. As of January 2023, the tax on crude oil and imported petroleum will be 16.4 cents per gallon. It concerns the Superfunds Tax, which was initially introduced to finance the cleaning up of locations with hazardous waste.
The events are reminiscent of the 1970s. Yet it is different this time. During the 1970s, the FED both raised interest rates but the M2 Money Supply also rose. Currently, the M2 Money Supply has been declining since February. A further decline in the M2 Money Supply in combination with a rise in interest rates will keep inflation under control.
What And When To Buy
Investing in times of high inflation is difficult, the FED raises interest rates to lower inflation, making stocks less interesting to invest in. Still, it remains interesting to keep an eye on the stock market. A buying opportunity occurs when the yield spread on treasury bonds is wide.
The 10-year minus 3-month treasury yield curve can be seen as an indicator to predict economic recessions. When short-term rates are higher than long-term rates, a recession follows, as shown in the first chart of this article. Based on that chart, the past 5/5 recessions have been correctly predicted.
It won’t be long before the 3-month treasury rate is higher than the 10-year treasury rate. The yield on 2-year government bonds is currently higher than the yield on 10-year government bonds. Due to high inflation, the Fed will raise interest rates further, causing the yield spread to invert.
However, it is impossible to predict which sectors will be most affected and where investment opportunities lie. Warren Buffett recommends buying stocks with the following characteristics:
- Avoid capital intensive companies.
- Buy companies where the products are in demand.
- Buy companies that have the ability to raise prices rather easily.
Expensive growth stocks (whose companies don’t make a profit) also experience high volatility and major drawdowns during an economic recession.
Yet it remains difficult which companies exactly meet the criteria of Warren Buffett. Alternatively, Warren Buffett recommends investing in a low-cost S&P500 index fund. But when is the right time to buy?
A good buying opportunity occurs when the yield spread is wide, and just after the 10-year minus 3-month treasury yield curve inverted.
The S&P 500’s peak-to-trough are highlighted in yellow in the image below (if the S&P 500 falls more than 20%). Interestingly, the bear market develops shortly after the yield curve has inverted and GDP growth turns negative. The bear market ends when the yield spread is high, I take ~3.5 as a fair value to participate in a S&P 500 ETF.
10-year minus 3-month treasury yield: S&P500 peak-to-trough highlighted in yellow (Federal Reserve of St.Louis)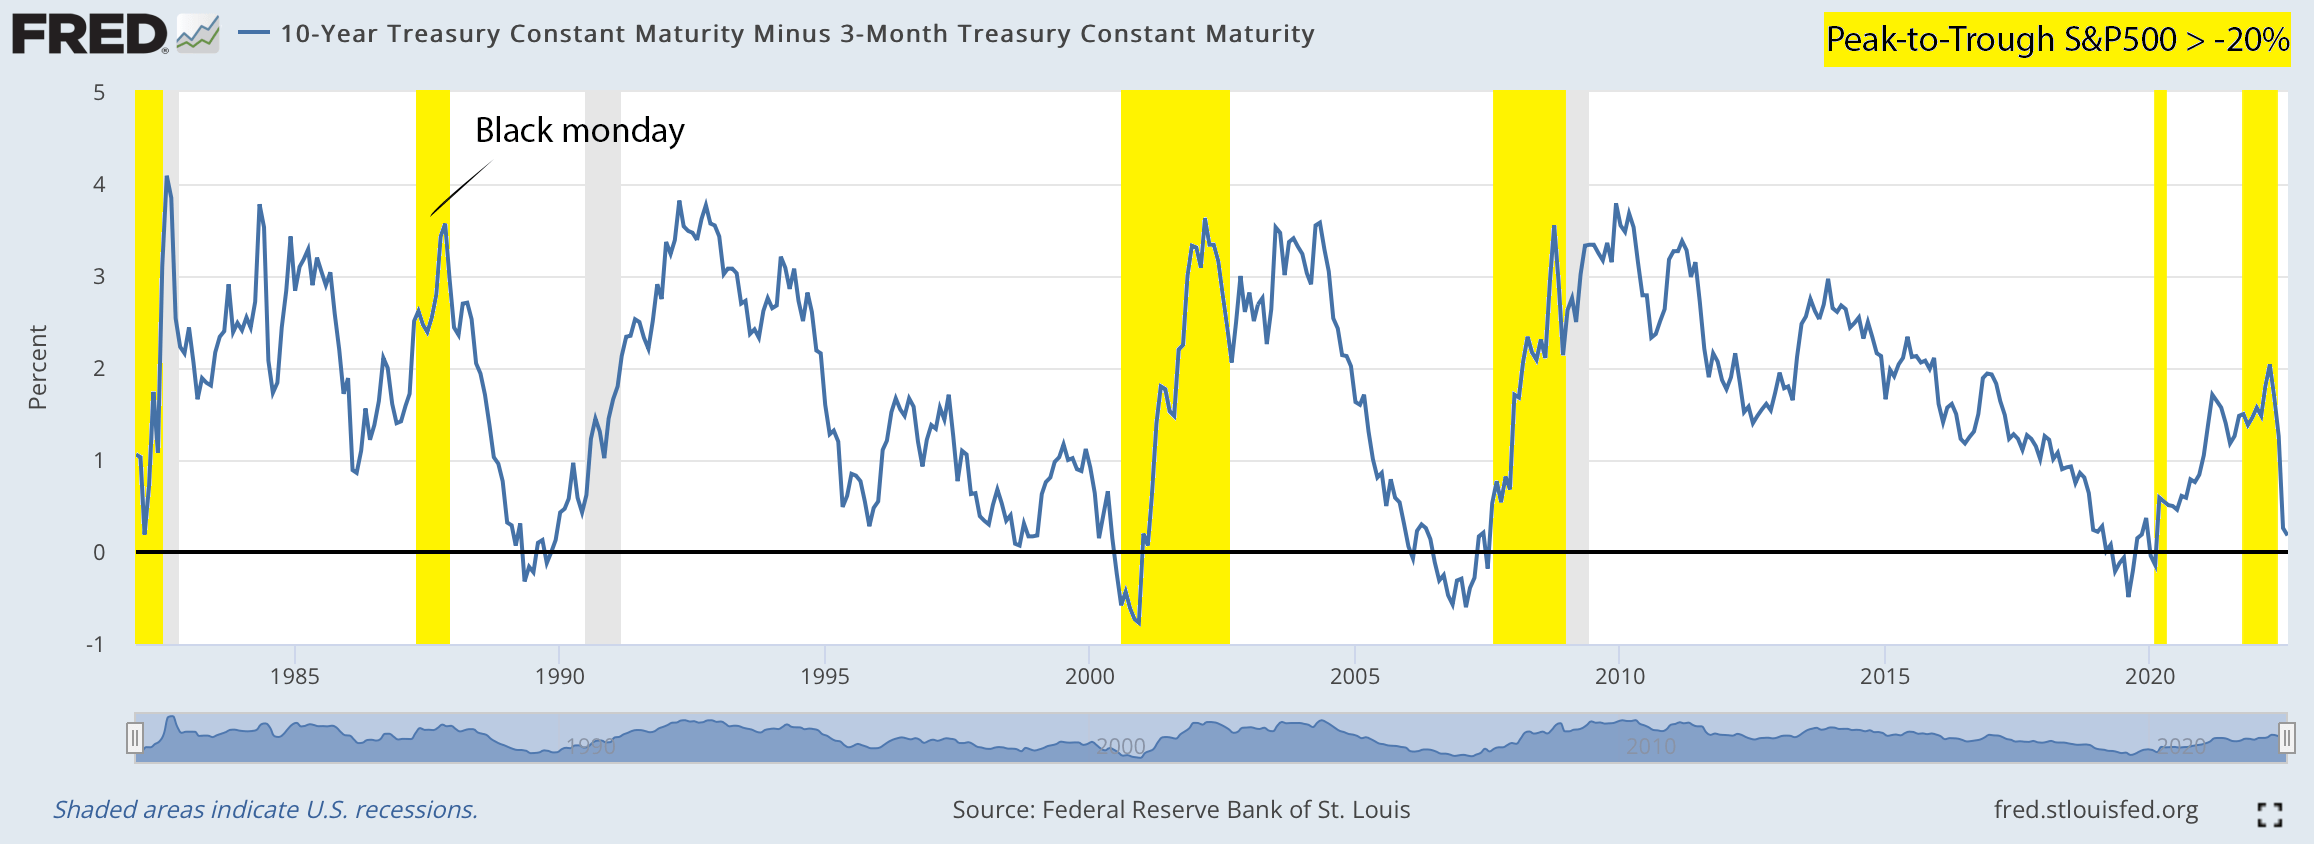
After the sharp decline of the S&P 500 in early 2020, a rapid recovery followed. At the beginning of this year, the S&P 500 started a downtrend again. Inflation is red-hot and investors correctly expected the FED to step in and raise interest rates, triggering the impending yield curve inversion and economic recession.
So, which investments are currently attractive during high inflation? These are stocks that meet Warren Buffett’s criteria but also have a low beta. Those stocks can outperform the market in times of high inflation. Bonds should be avoided when interest rates rise. During high inflation and rising interest rates, the rental of real estate can be interesting. But in an earlier article I wrote that real estate prices are historically high. Rising rates can cause real estate prices to fall. High inflation destroys the value of money, and there may be opportunities in commodities. Nevertheless, it is better to wait until the treasury yield spread is wide and take a position in, for example, the S&P 500.
Be the first to comment