

bankrx/iStock via Getty Images
I often get this question from my readers and followers.
“What is the best REIT to own?”
Of course, you know that diversification is a critical part of being an intelligent REIT investor, as I explained in a recent article,
“Every investor has his or her own risk tolerance limitations, and it’s important to consider both systematic risk (market risk) and unsystematic risk (asset specific). How many eggs to put in your basket depends on you, as you seek to balance these risks versus the potential rewards.”
Now I generally recommend owning at least 10 REITs and possibly up to 20 names. Our Durable Income Portfolio has over 40 REITs – both equity REITs and mortgage REITs – and it has generated impressive returns since inception (since August 2013) of over 20% annually (compared with 9.0% for VNQ).
Whether you own 10, 20, 30, 40, or more REITs is an important question to ask, as it really boils down to your risk tolerance level. I know many of you are comfortable with owning around 10 REITs, a few BDCs, and some MLPs, and I’m betting that’s because you want consistent income.
The great thing about REITs is that there are so many flavors.
My youngest daughter just started scooping ice cream at Bruster’s and she told me that the chain carries over 24 ever-changing flavors made fresh daily. She said that Bruster’s also has 150 recipes in rotation too.
There are more than 225 REITs in the U.S. registered with the SEC that trade on one of the major stock exchanges — the majority on the NYSE. These REITs have a combined equity market capitalization of more than $1 trillion.
With more than 500,000 properties owned by REITs (in the U.S.), you can find a REIT-owned property near you. REITs Across America is an interactive map highlighting REIT-owned assets in every state and major metropolitan area.
Nareit
In my home state of South Carolina, there are 104 REITs that own property that represents 9,603 properties. In SC, 41% of households invest in REITs (national average is 44.1%) and REITs pay around $220 million in property taxes in my home state.
Nareit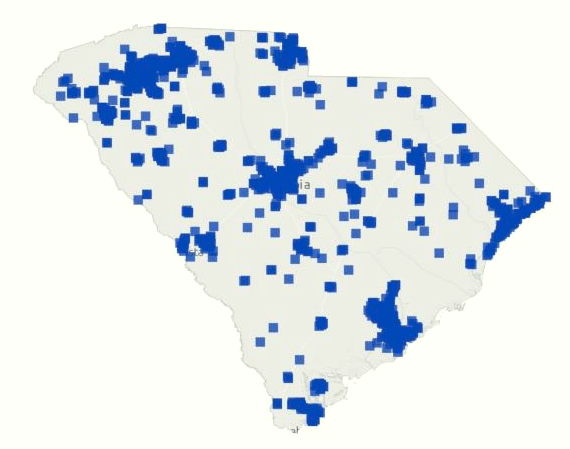
Now, as you know, REITs provide exceptional diversification attributes for the individual investor to own properties in various regions – like the southeastern US where I leave – or on the west coast.
Covid-19 has given investors a new reason to own real estate in sunbelt markets like SC, GA, FL, and TX.
While I love the Palmetto State (South Carolina) there are also risks to consider – like having all of your eggs in one basket. According to this website,
“South Carolina is one of the most vulnerable states in the nation to be impacted by hurricanes and tropical storms. Six coastal counties border the Atlantic Ocean. These counties have more than 200 miles of general coastline, and another 21 inland counties may be directly affected by these storms.”
Also, my home state averages 10 to 15 earthquakes per year below magnitude 3. The largest earthquake to hit (at 7.3 magnitude) was in Charleston, SC in 1886 (killed 60 people and destroyed much of the city).
As I reflect on geographic diversification, and the question of owning just one REIT, what if I told you that this REIT owns over 11,000 properties (more than all REIT-owned properties in SC) located in all 50 states.
What if I told you that this REIT also owns properties in Europe, specifically 173 assets worth $4.3 billion?
What if I told you that this REIT is also an S&P 500 company, and also one of 65 companies in the elite S&P 500 Dividend Aristocrats® Index?
What if I told you that this one REIT has generated 15.5% compounded annual returns since going public in 1994?
What if I told you that the one REIT that I would recommend owning without any reservations whatsoever is “the monthly dividend company” known as Realty Income (NYSE:O)?
The Basics About Realty Income
Realty Income is a net lease REIT that was founded in 1969 and since listing in 1994 (on the NYSE) it has increased:
- Properties in the portfolio from 630 to 11,136 in all 50 states, Puerto Rico, the UK and Spain
- Real estate assets (at cost) from $451 million to $36 billion
- Different clients in the portfolio from 23 to 1,040
- Total number of industries in the portfolio from 5 to 60
- Total annual revenue from $49 million to $1.976 billion (as of 12/31/2021)
- AFFO from $39.2 million to $1.489 billion (as of 12/31/2021)
- Annualized cash dividends from $0.90 per share to $2.958 per share
Yahoo Finance 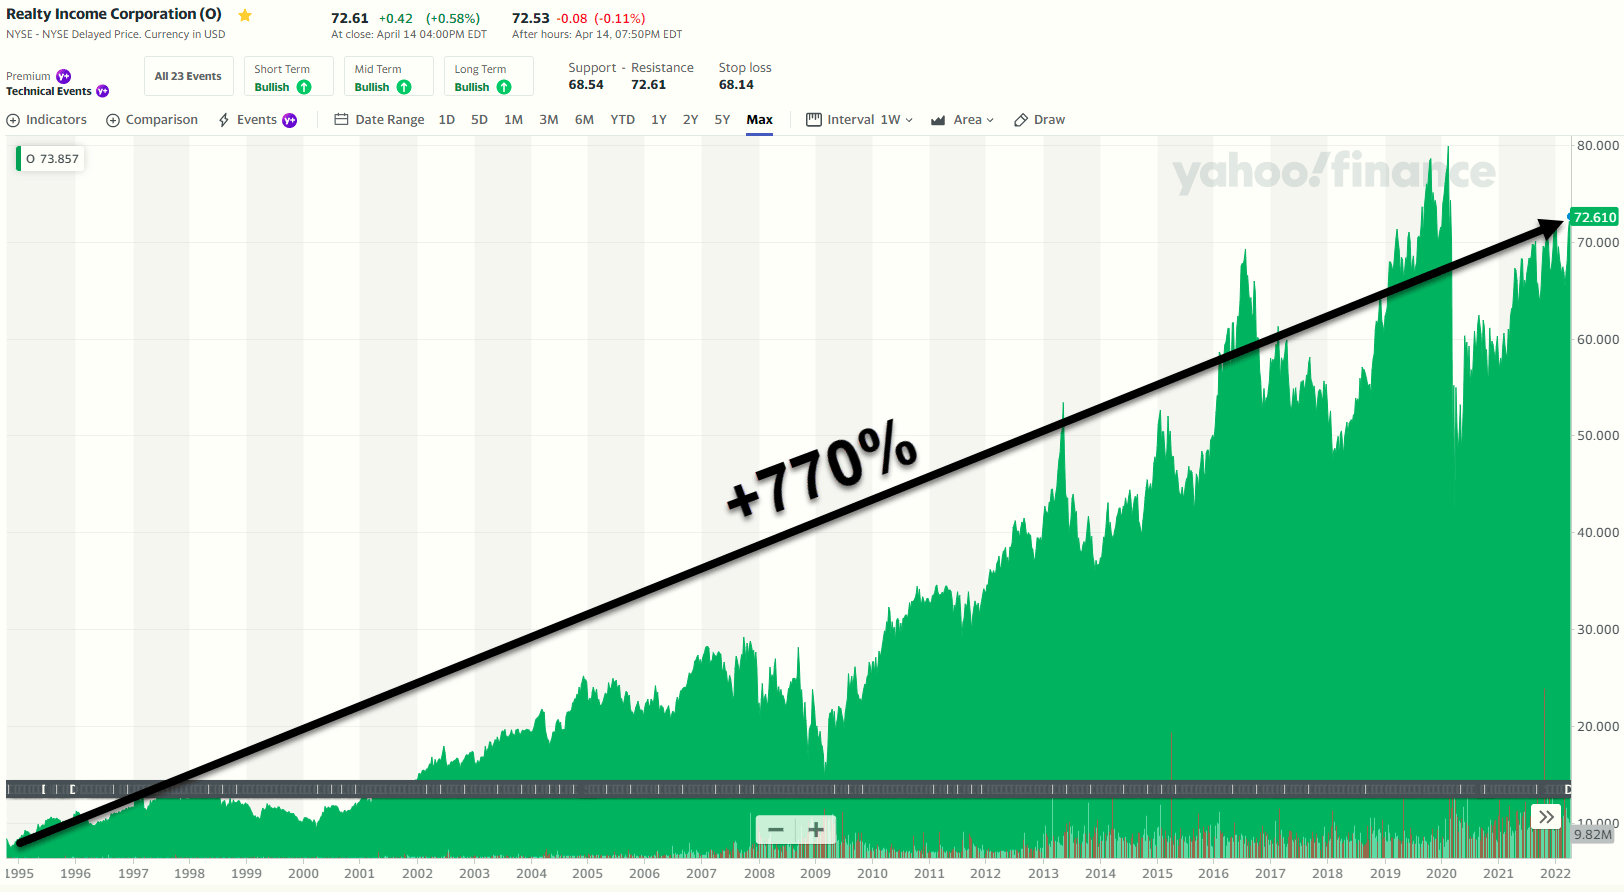
As you can see (above), Realty Income has grown shares by 770% since listing and including the dividend, shares have returned 15.5% per year (4.4% compound annual dividend growth rate since 1994).
With over 11,000 properties in the portfolio, Realty Income has one of the most diversified platforms in the REIT sector, with over 1,000 customers in 60 different industries. Around 94% of total rent is resilient to economic downturns and/or isolated from e-commerce pressures.
Realty Income Presentation 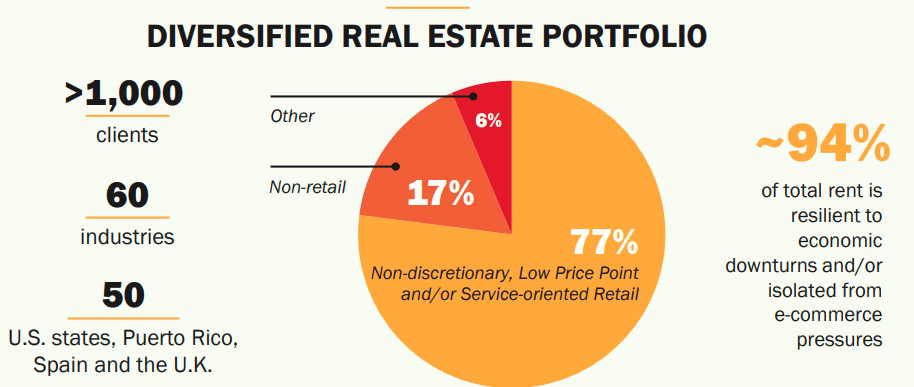
As illustrated below, Realty Income’s industry exposure in weighted highly to necessity-based businesses:
Realty Income Presentation 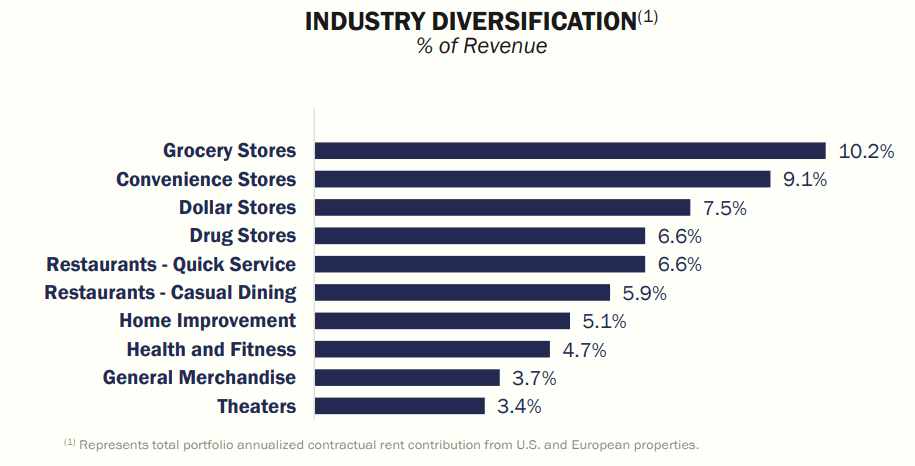
Although the company has exposure to gyms (4.7%) and theaters (3.4%), it managed to grow earnings (or AFFO per share) during the worst of Covid-19. Realty Income is one of just three net lease REITs that was able to grow AFFO (per share) during that time:
Realty Income Presentation 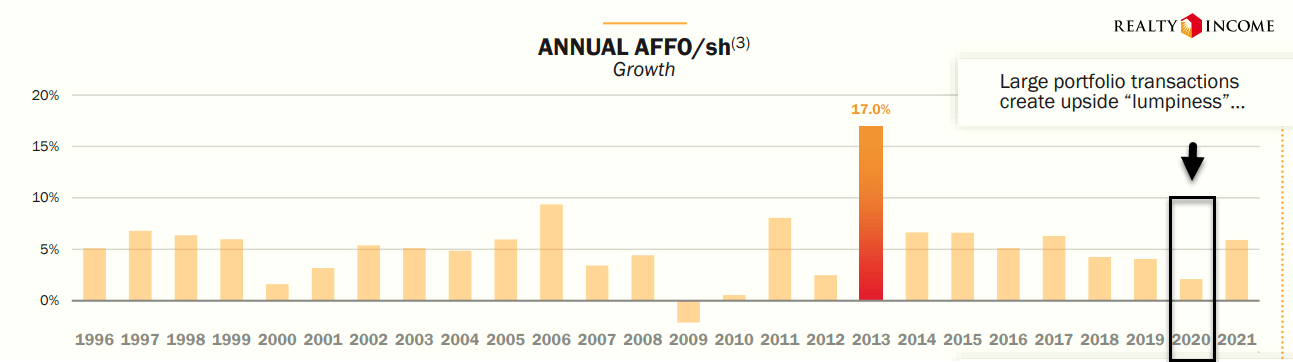
Realty Income has generated 5.1% historical (median) growth since 1996, stronger that the historical growth rate vs. REITs (3.9%). And Realty Income has generated positive earnings growth in 25 of 26 years, with modest annual downside volatility of 2.8%.
Moreso, Realty Income has a proven track record of maintaining 5%+ earnings CAGR since listing regardless of size. In 2012, the portfolio GREAV was < $6B and earnings CAGR was 4.5%. Earnings growth has accelerated as portfolio real estate value crossed $10 billion: 6.4% AFFO/sh CAGR since 2012.
Realty Income Presentation 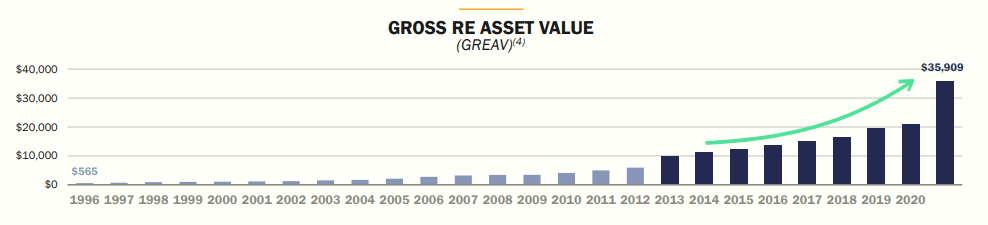
Recently, the company announced a new deal, that will also become a new category: the company is purchasing the Encore Boston Harbor (Encore) Resort and Casino for $1.7 billion at a 5.9% cash cap rate. The transaction is consummated under a 30-year triple net lease with favorable annual escalators.
The tenant, Wynn Resorts (WYNN) is a $20 billion S&P 500 company and one of the preeminent developers and operators of integrated resorts in the world, reflecting Realty Income’s strategy of partnering with industry blue chips.
Realty Income’s exposure to the gaming sector is expected to be < 3.5%, preserving prudent diversification and also demonstrates the growth profile of the business model. Realty Income’s entry into the gaming industry demonstrates that its growth opportunities are unconstrained by industry, property type or geography.
Realty Income Presentation 
The Wynn deal in Boston should close in Q4-22 and we expect to see Realty Income pursue other gaming deals, possibly the Wynn in Las Vegas. Also, remember that Realty has established a footprint in Europe and could easily pursue sale-leasebacks within the gaming category.
Realty Income’s Fortress Balance Sheet
Within the REIT sector, there are just a handful (7) of REITs with A-rated balance sheets and Realty Income happens to be one of them (A3 Moody’s and A- S&P).
The company entered 2022 from a position of strength with a net debt to annualized pro forma adjusted EBITDAR of 5.3x.
Subsequent to year-end, the company issued $500 million in sterling-denominated senior unsecured notes, pricing 5-year and 20-year notes at a blended all-in yield of 2.28%, with a weighted average term of 12.5 years.
Realty Income Presentation 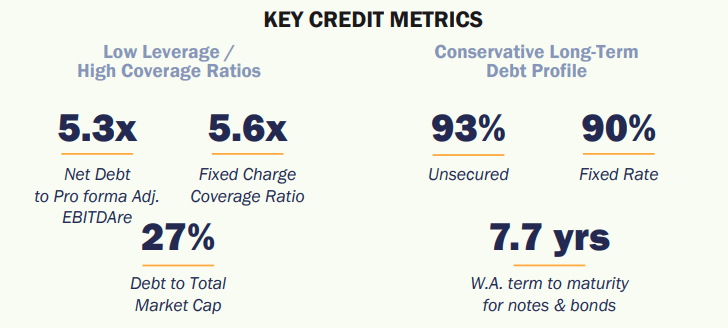
As viewed below, Realty Income has ample liquidity to capitalize on acquisition opportunities, with around $1.5 on the revolver and $259 million in cash.
Realty Income Presentation 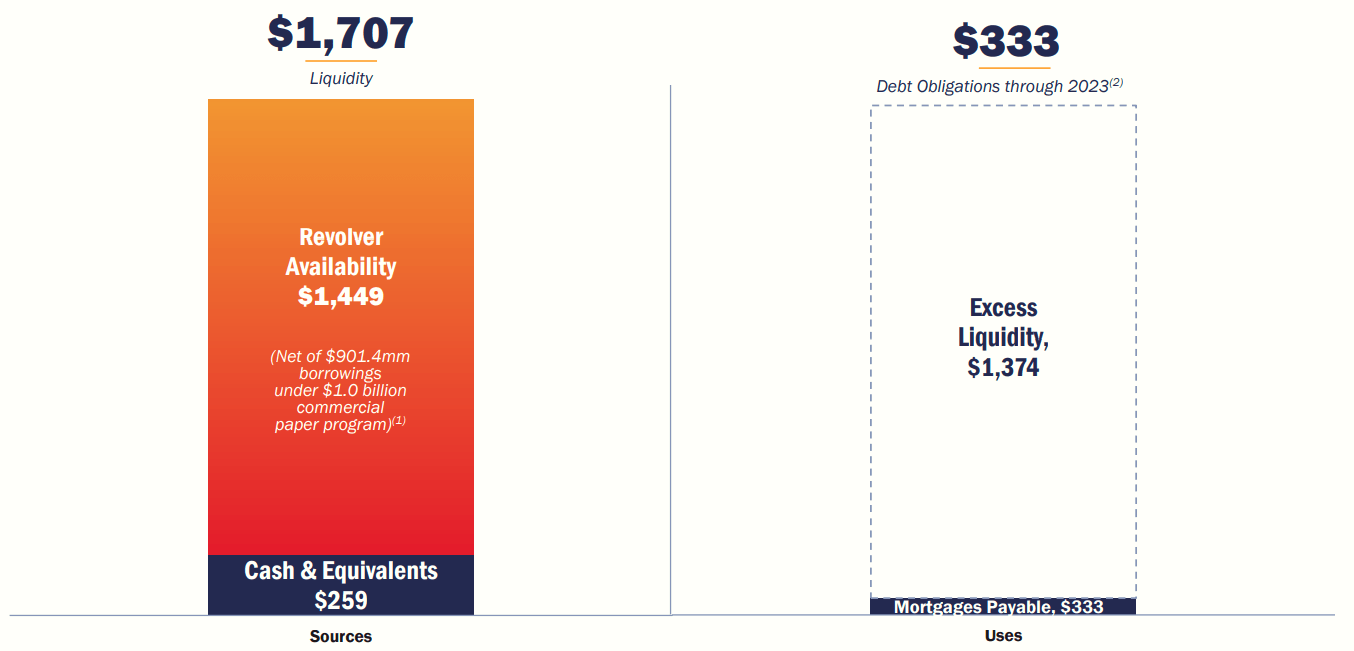
The latest Wynn deal is attractive based upon the 5.9% cap rate and annual rent escalators. Realty’s weighted average cost of capital is around 4.4% (see more below) and this should provide solid growth in one big bite. As I explained in a recent article,
“…it takes as many as 500 drug store purchases to equal a single casino…Individual transactions naturally take longer to close, and cap rates remain attractive.
Most importantly, the earnings needle moves much faster with a trophy trade, which is one of the reasons we recently saw Realty Income put a few chips on gaming.”
Meanwhile, Realty Income’s equity cost has improved quite a bit over the last 30 days (shares +11%), which has driven the AFFO yield down to 5%.
Yahoo Finance 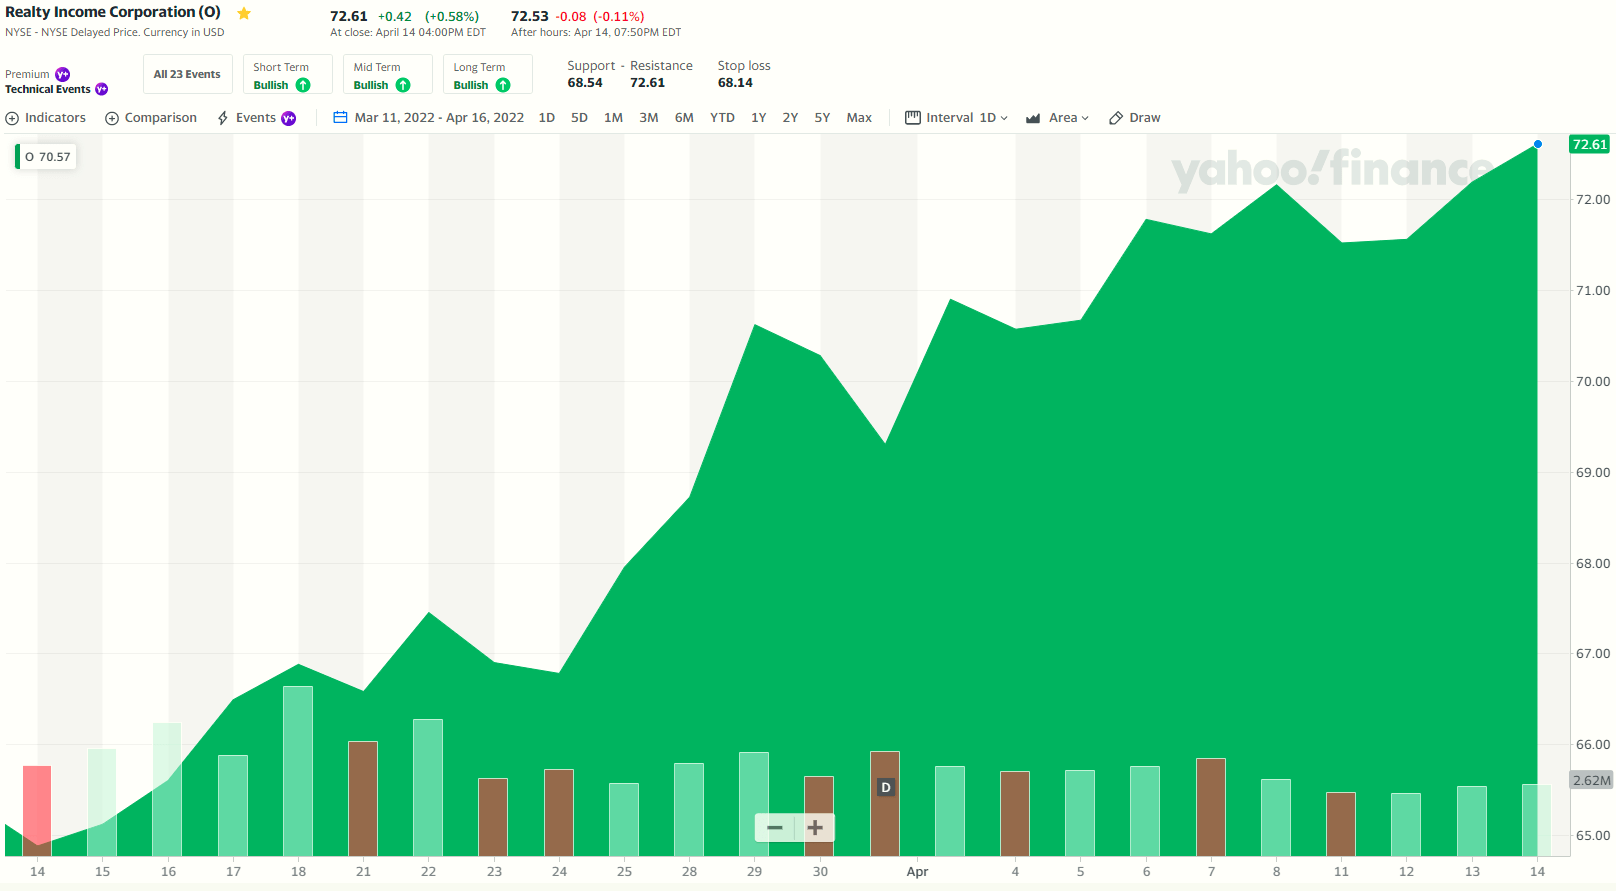
This is important because the WACC (weighted average cost of capital) balances near-term earnings per share growth with long-term value accretion. In this nominal 1st year WACC example, we can measure Realty Income’s initial (year one) earnings accretion – a higher stock price (lower cost) supports faster growth:
Realty Income Presentation 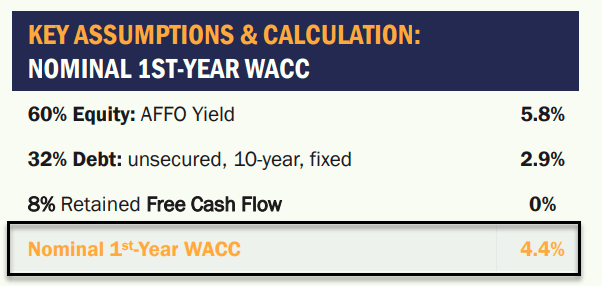
A low WACC supports Realty Income’s ability to spread invest in high-quality real estate opportunities:
Realty Income Presentation 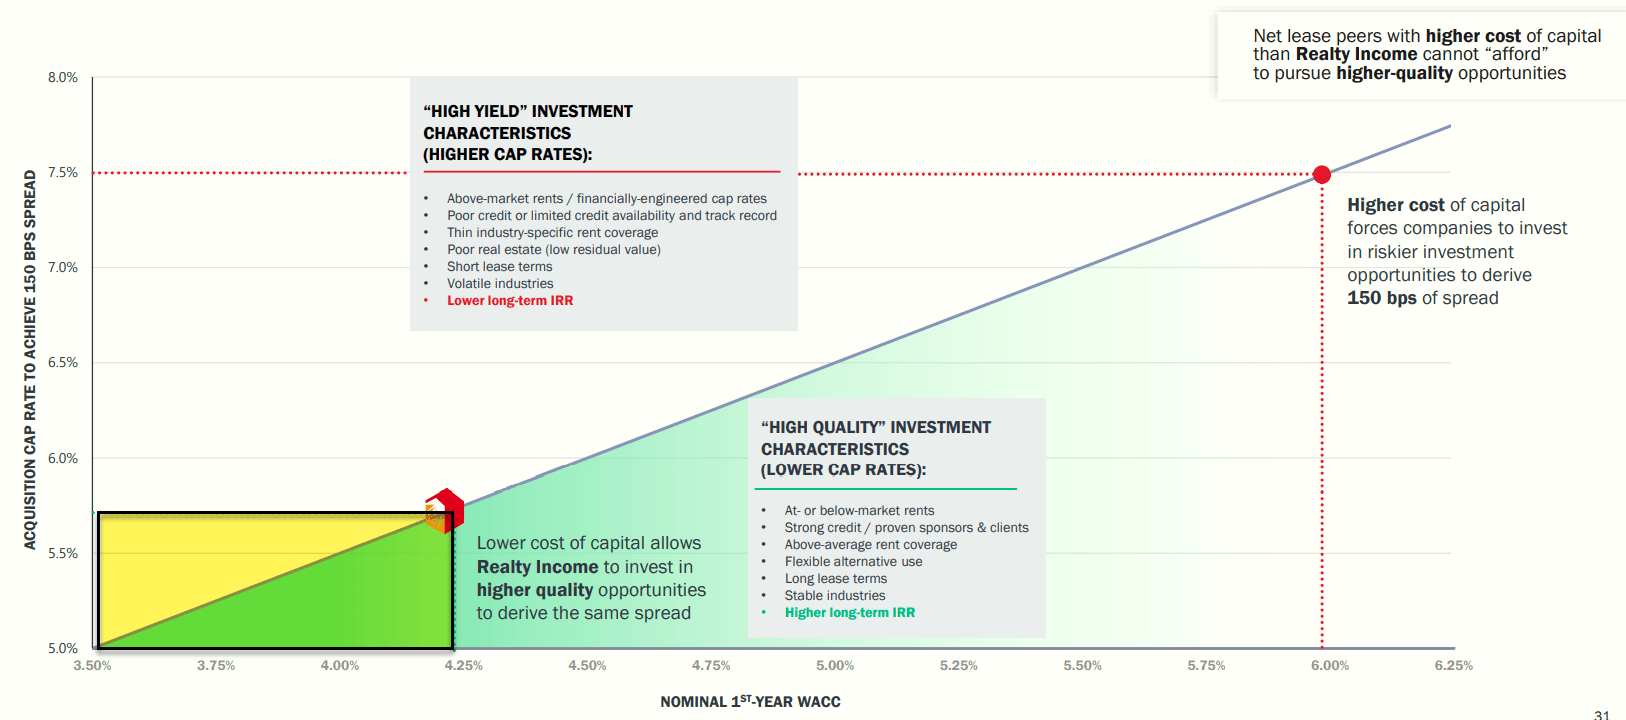
My Largest Holding
One of the most important catalysts for Realty Income and other net lease REITs is the opportunistic growth set that exists among large corporations. As seen below, Realty Income’s target market accounts for 7% of real estate owned by public companies:
Realty Income Presentation 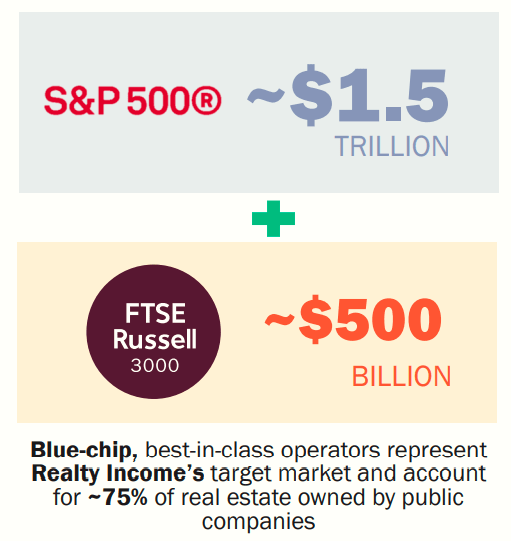
This is often overlooked…. Realty Income is well-positioned to continue to execute on large-scale sale-leaseback transactions.
Realty Income Presentation 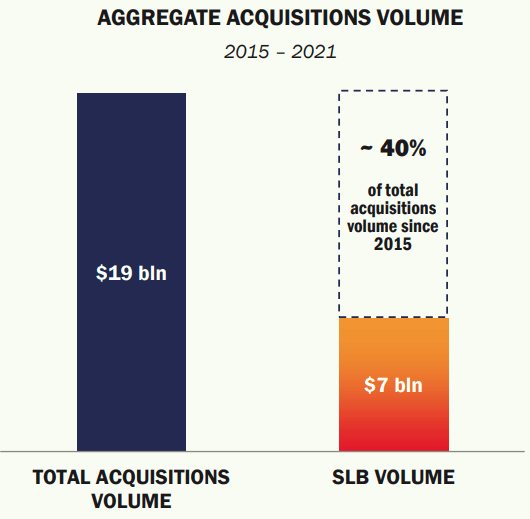
As viewed below, rising interest rats do not pose significant earnings headwinds for the net lease business model:
Realty Income Presentation 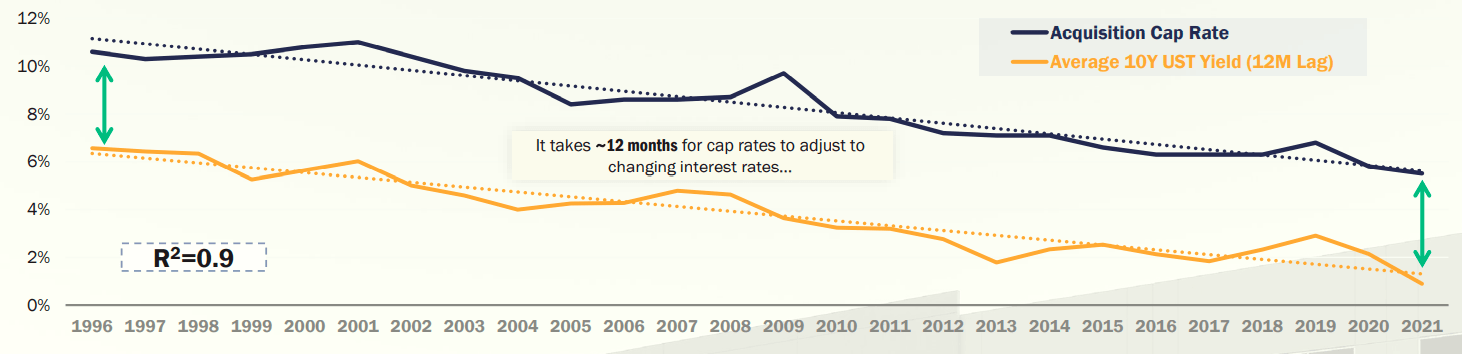
Also, as viewed below, recessionary environments present attractive acquisition opportunities (measured as acquisition cap rate spread over average 10-year Treasury during a given year):
Realty Income Presentation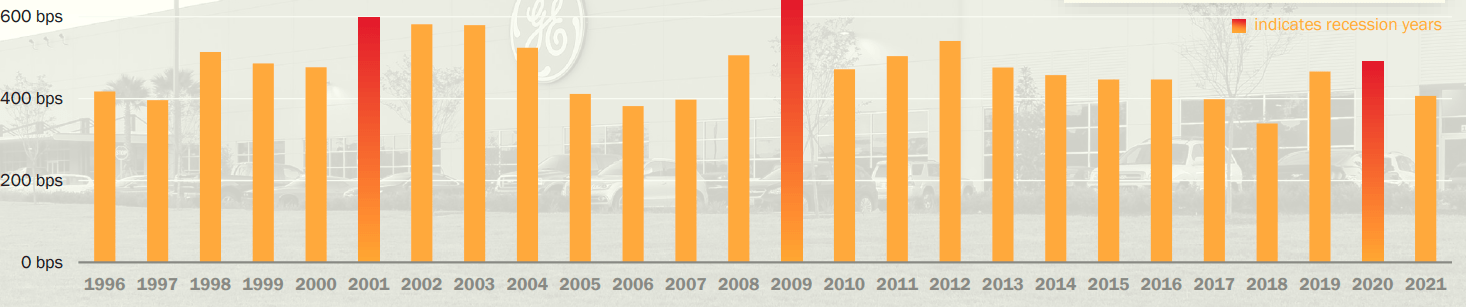
The point here is that Realty Income is an all-weather REIT that has not only survived, but also thrived, in good times and bad. As seen below, Realty Income is a textbook example of “repeatability” and “predictability”.
Fast Graphs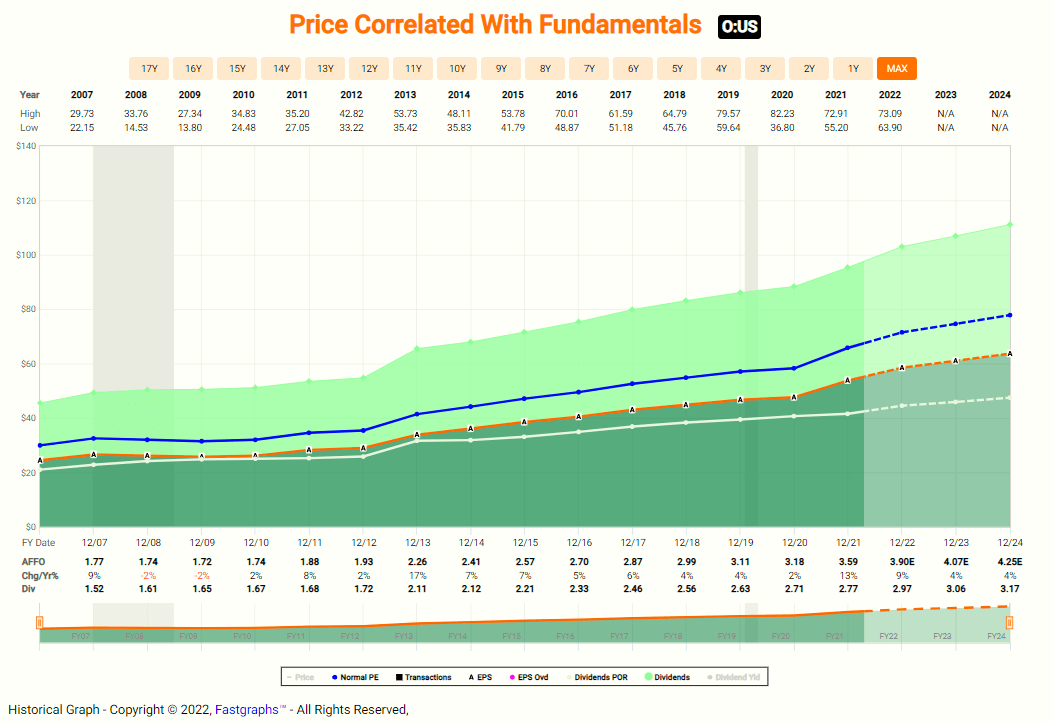
A few days ago the company announced it had declared its 622nd consecutive common stock monthly dividend ($0.247 per share, representing an annualized amount of $2.964 per share payable on May 13th).
The company has declared 622 consecutive common stock monthly dividends throughout its 53-year operating history and increased the dividend 115 times since listing in 1994.
Realty Income Presentation 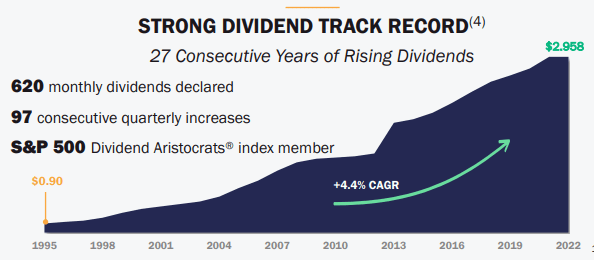
So now, the Fed is trying to slow down the economy and, in this stage, (in which a recession is looming) what stocks benefit?
- You want stable and predictable returns
- You want low volatility
- You want a stock with scale advantage
- You want a stock with low-cost advantage
- And that trades at a premium to get that low-cost advantage
Fast Graphs
As you can see, Realty Income is trading at $72.61 with a P/AFFO of 19.7x.
What happened when the Fed raised rates at the outset of 2016?
How did Realty Income do?
Fast Graphs
The P/AFFO multiple went from 20.9x to 26.1x….
Now is the time that you want to own Realty Income…
We believe the company has plenty of room to run, and analysts concur:
Fast Graphs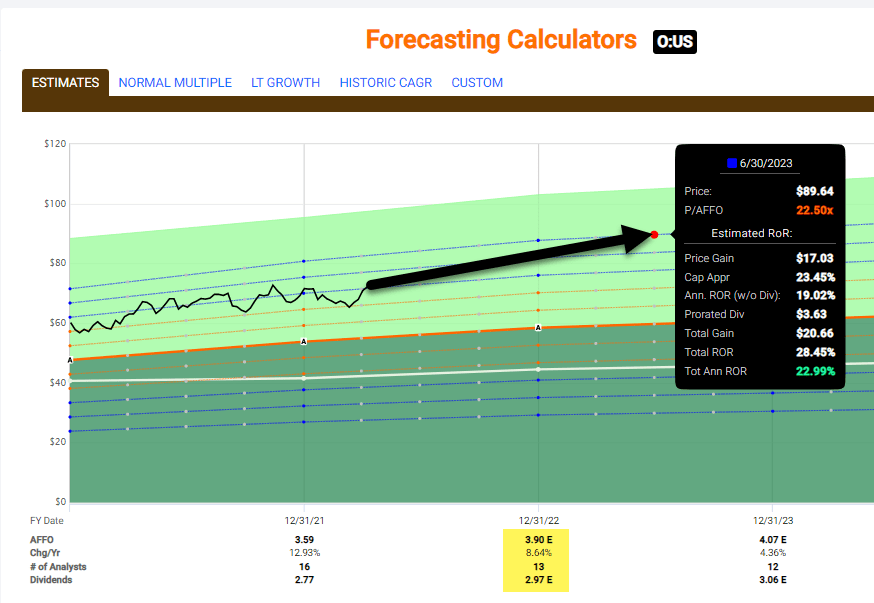
As seen above. there are 19 analysts in the pool with an average growth forecast of 8.6%. iREIT has bumped the “buy below” target to $74.00 and our 12-month total return forecast is 20%. The dividend yield is 4.1% and the payout ratio is in great shape:
REIT Base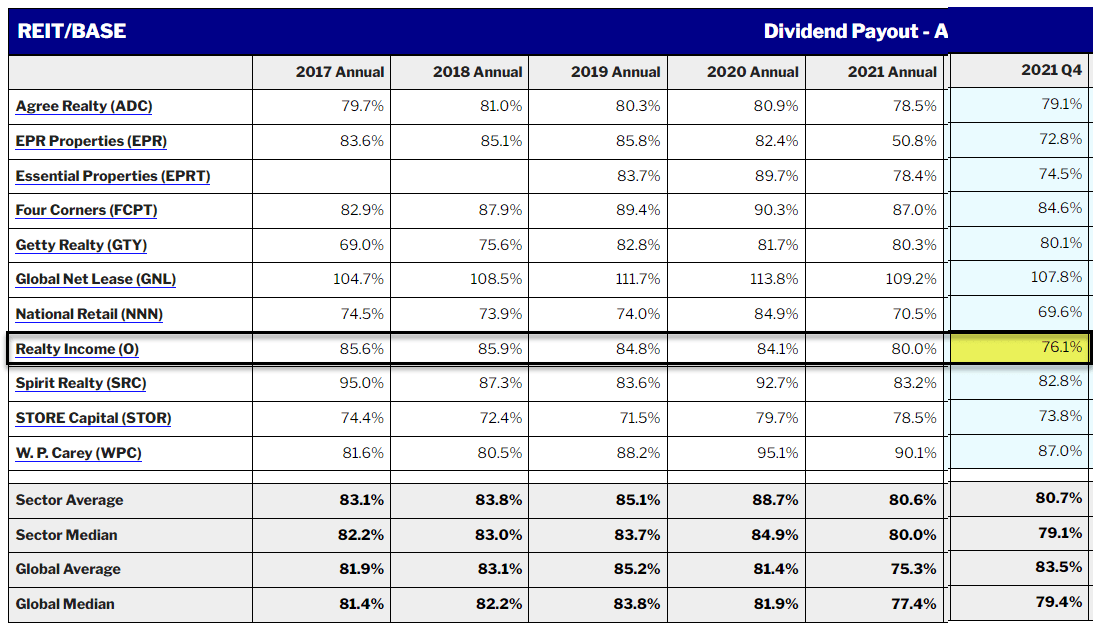
Which of course this means that Realty Income can pump out more dividends, without financial engineering. In a few days, I plan to travel to San Diego to speak at the Oxford Club’s Investment U Conference and while there I will be meeting with Realty Income’s top brass.
There are many reasons to travel to San Diego – weather, food (eating at a Kilroy property), relaxation, and speaking – but I’m most excited about meeting with Sumit Roy, CEO at Realty Income, what I consider to be the “greatest REIT of all time”.
Happy SWAN Investing!
Be the first to comment