

RAND TALKING POINTS & ANALYSIS
- Recovering South African current account encouraging for ZAR.
- NFP to determine short-term guidance.
- USD/ZAR bears eye rising wedge breakout.
Macro-economic fundamentals underpin almost all markets in the global economy via growth, inflation and employment – Get you FREE guide now!
Foundational Trading Knowledge
Macro Fundamentals
Recommended by Warren Venketas
USD/ZAR FUNDAMENTAL BACKDROP
The South African rand gained traction against the USD this Thursday as a weaker dollar and broad-based commodity gains supported the Emerging Market (EM) currency. South African current account for Q3 (see economic calendar below) improved significantly but remains below positive territory. Overall, a net positive for the rand but the primary driver for this week has been US specific factors. Prior to the US open, jobless claims data missed expectations but stayed within recent ranges. No real surprises leave tomorrow’s Non-Farm Payroll (NFP) report under the spotlight. Barring the headline figure and unemployment, softening average earnings will be closely monitored to see whether or not this trend continues.
Later today, US consumer credit change close out the trading session and could provide some short-term volatility.
USD/ZAR ECONOMIC CALENDAR (GMT +02:00)
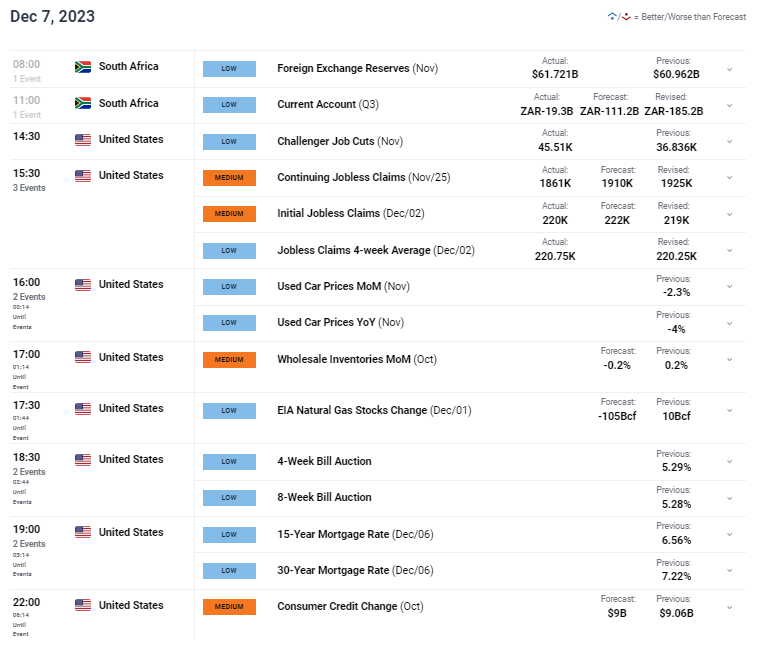
Source: DailyFX Economic Calendar
Want to stay updated with the most relevant trading information? Sign up for our bi-weekly newsletter and keep abreast of the latest market moving events!
Trade Smarter – Sign up for the DailyFX Newsletter
Receive timely and compelling market commentary from the DailyFX team
Subscribe to Newsletter
TECHNICAL ANALYSIS
USD/ZAR DAILY CHART
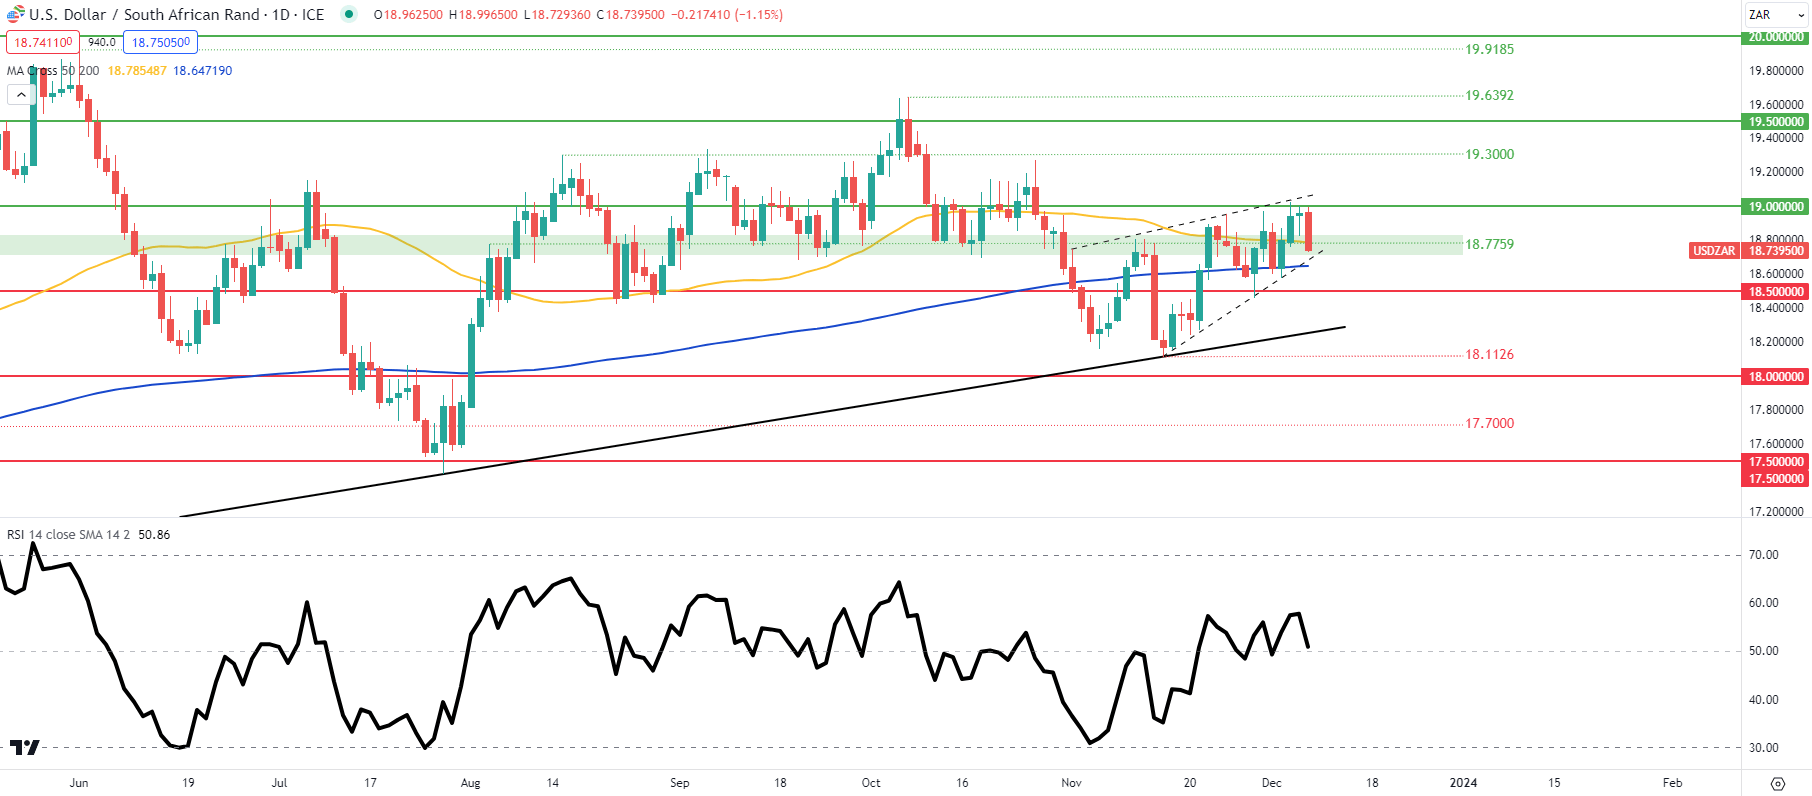
Chart prepared by Warren Venketas, TradingView
The daily USD/ZAR chart now looks to approach the apex of the rising wedge formation (dashed black line) coinciding with wedge support. A confirmation candle close below could spark further downside but I would like to see a close below the 200-day moving average (blue) as well. The key inflection zone around the 18.7759 level has proved to be a potential turning point in the past which supports the indecision by traders to favor any particular directional bias as shown by the Relative Strength Index (RSI). In summary, an NFP beat could negate the rising wedge while a significant miss could bring the 18.5000 psychological support handle into consideration once again.
Resistance levels:
- 19.0000
- 18.7759/50-day MA (yellow)
Support levels:
- Wedge support/200-day MA (blue)
- 18.5000
Contact and followWarrenon Twitter:@WVenketas
Be the first to comment