

Liudmila Chernetska
While the Brookfield Real Assets Income Fund Inc. (NYSE:RA) (the “Fund”) pays an attractive current distribution yield of over 14%, I don’t think this yield is sustainable over the long run, as the underlying assets have only generated an average annual total return of 1.5% over 5 years.
Fund Overview
The Brookfield Real Assets Income Fund Inc. is a closed-end fund (“CEF”) that provide investors with high current income and growth of capital. The Fund primarily invests in securities of real asset companies such as real estate, infrastructure, and natural resource companies.
RA’s Strategy
The RA fund has a fairly broad investment mandate, as long as the issuer is considered a Real Asset Company as determined by Brookfield. For example, within real estate, the fund can invest in real estate investment trusts (“REITs”), operating real estate companies, real estate developers and builders, property management firms, companies engaged in mortgage finance, lodging companies, and debt securities which are predominantly supported by real estate assets.
For infrastructure investments, the Fund can invest in physical structures such as airports and toll roads, other infrastructure assets such as telecoms, utilities, and pipelines, and even MLPs.
For natural resources, the company needs to derive at least 50% of its revenues, profits or value from natural resource assets such as hydrocarbons, timberland, agriculture, precious metals or base metals.
In terms of concentration, the Fund will not invest more than 5% of the Fund in securities from a single issuer, and will not hold more than 10% of the voting securities of an issuer. The Fund also expects to invest at least 65% of assets in fixed income securities and equivalent derivatives, and up to 35% in common equities, including common stock, preferred stock, and other similar securities.
Finally, in terms of leverage, the Fund can employ up to 33% leverage to enhance returns.
Portfolio Holdings
As of August 31, 2022, the RA fund had approximately 71% of assets invested in fixed income securities and 27% of assets in equities. The Fund had a total of 509 positions and a duration of 2.0 years for the fixed income portfolio. Approximately 70% of the fixed income portfolio is fixed rate, and 30% is floating rate (Figure 1).
Figure 1 – RA Fund Holdings (RA Fund August 31, 2022 Factsheet)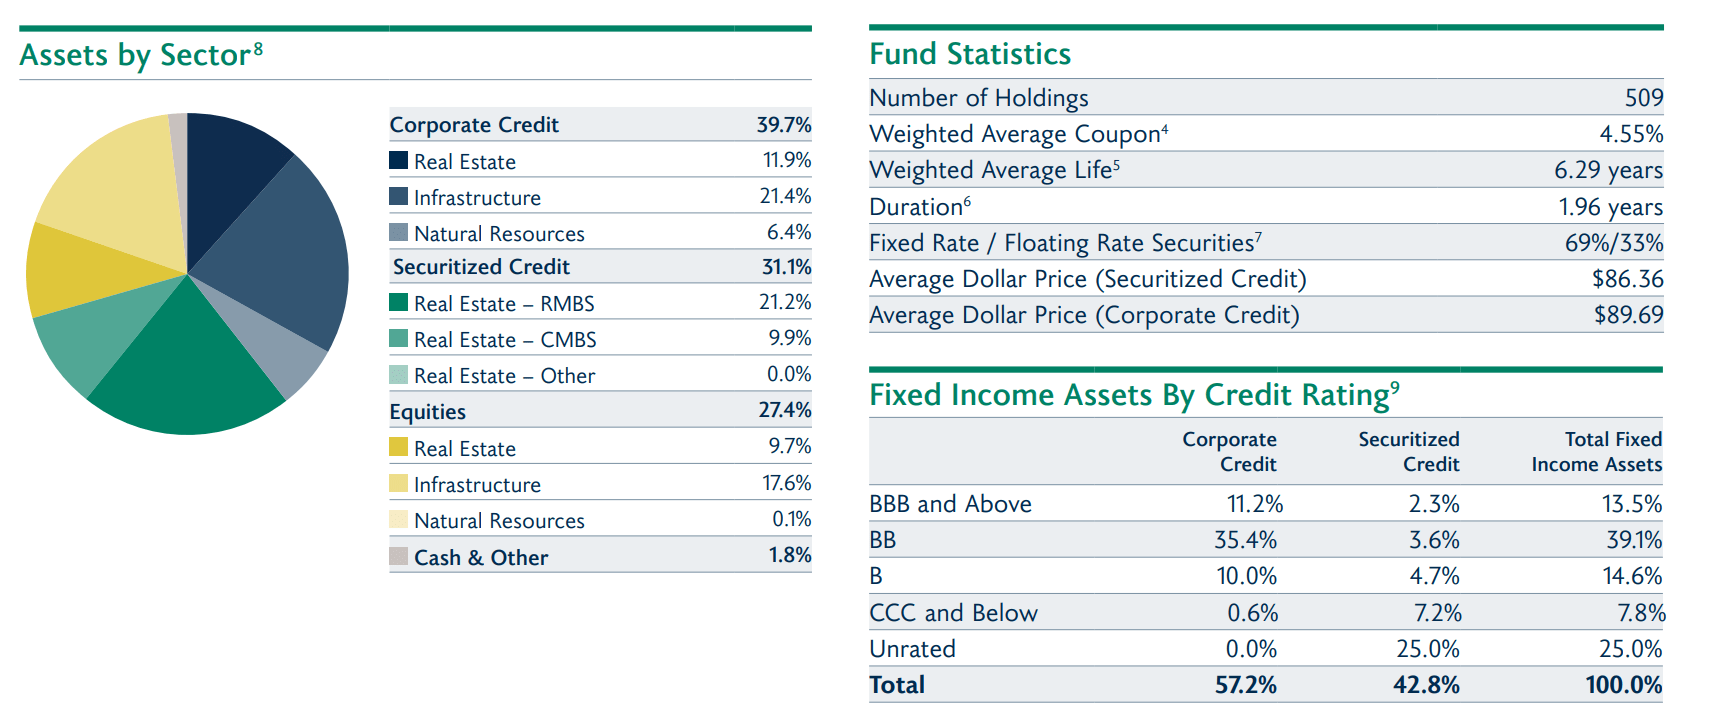
As of August 31, 2022, the Fund had leverage of 28% of gross assets (Figure 2).
Figure 2 – RA Fund Leverage (RA Fund August 31, 2022 Factsheet)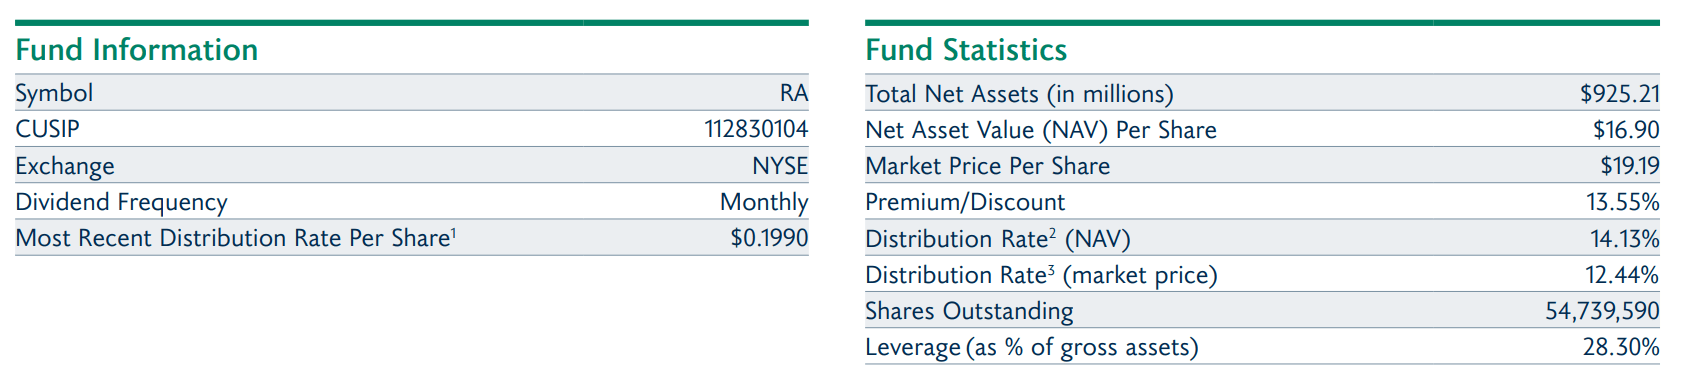
Investors should note that the fund’s holdings and allocations can change very rapidly. For example, although equity exposure was 27.4% and leverage was 28% as of August 31, 2022, the figures jumped to 42.7% and 42.3% respectively as of the September holdings report.
Returns
As of September 30, 2022, the Fund has generated 1/3/5 yr average annual total returns of -11.5%/-1.7%/1.5% respectively. YTD, the RA fund is down 14.6% to September 30 (Figure 3). Investors should note that the total returns quoted include the reinvestment of distributions.
Figure 3 – RA Fund Performance (Brookfield website)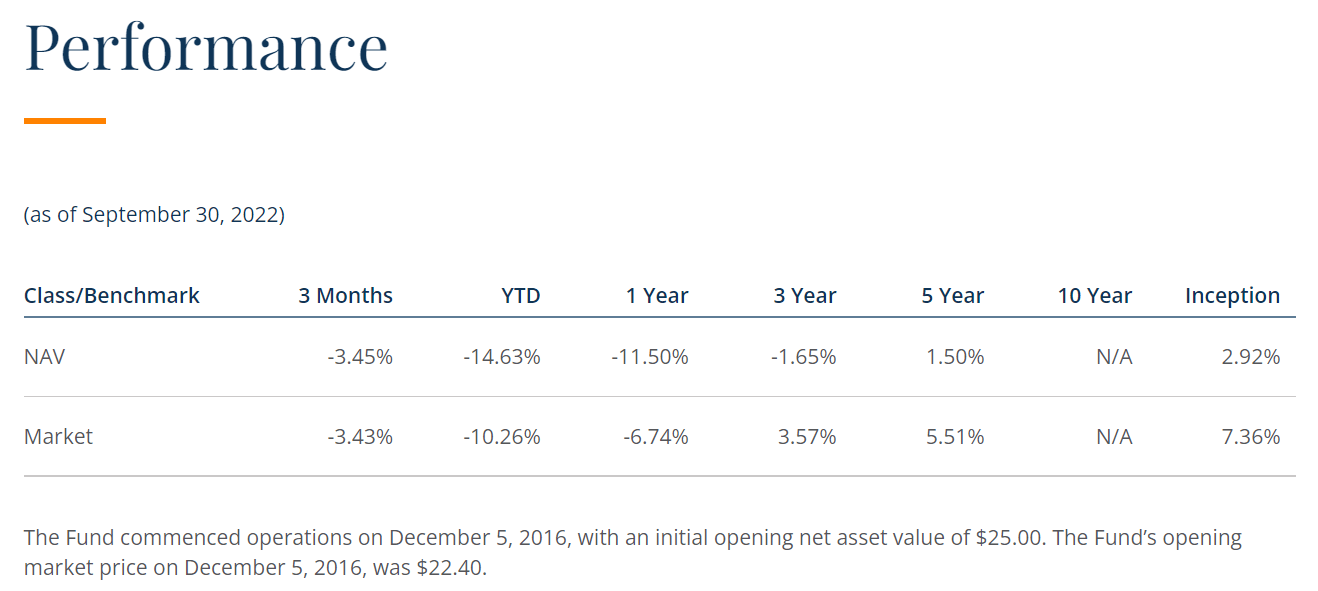
The poor performance of the RA fund is surprising, especially since the securities held by the fund are issued by “real asset companies” that theoretically should do well in an inflationary environment. For example, natural resource companies, as represented by the SPDR S&P Global Natural Resources ETF (GNR), have outperformed the market, declining by only 6.4% YTD to September vs. -23.9% for the S&P 500 Index.
Also, the fund’s fixed income holdings only have a duration of 2.0 years, meaning they should be relatively less affected by the interest rate increases in 2022.
I believe the main culprit for the Fund’s poor performance is the riskiness of the fund’s bond portfolio. Notice from Figure 1 above, the Fund has 87% of its corporate credit and securitized credit portfolio rated BBB or lower. YTD, we have seen high-yield credit spreads (non-investment grade) widen considerably (Figure 4).
Figure 4 – HY Credit Spreads Have Widened Considerably YTD (koyfin)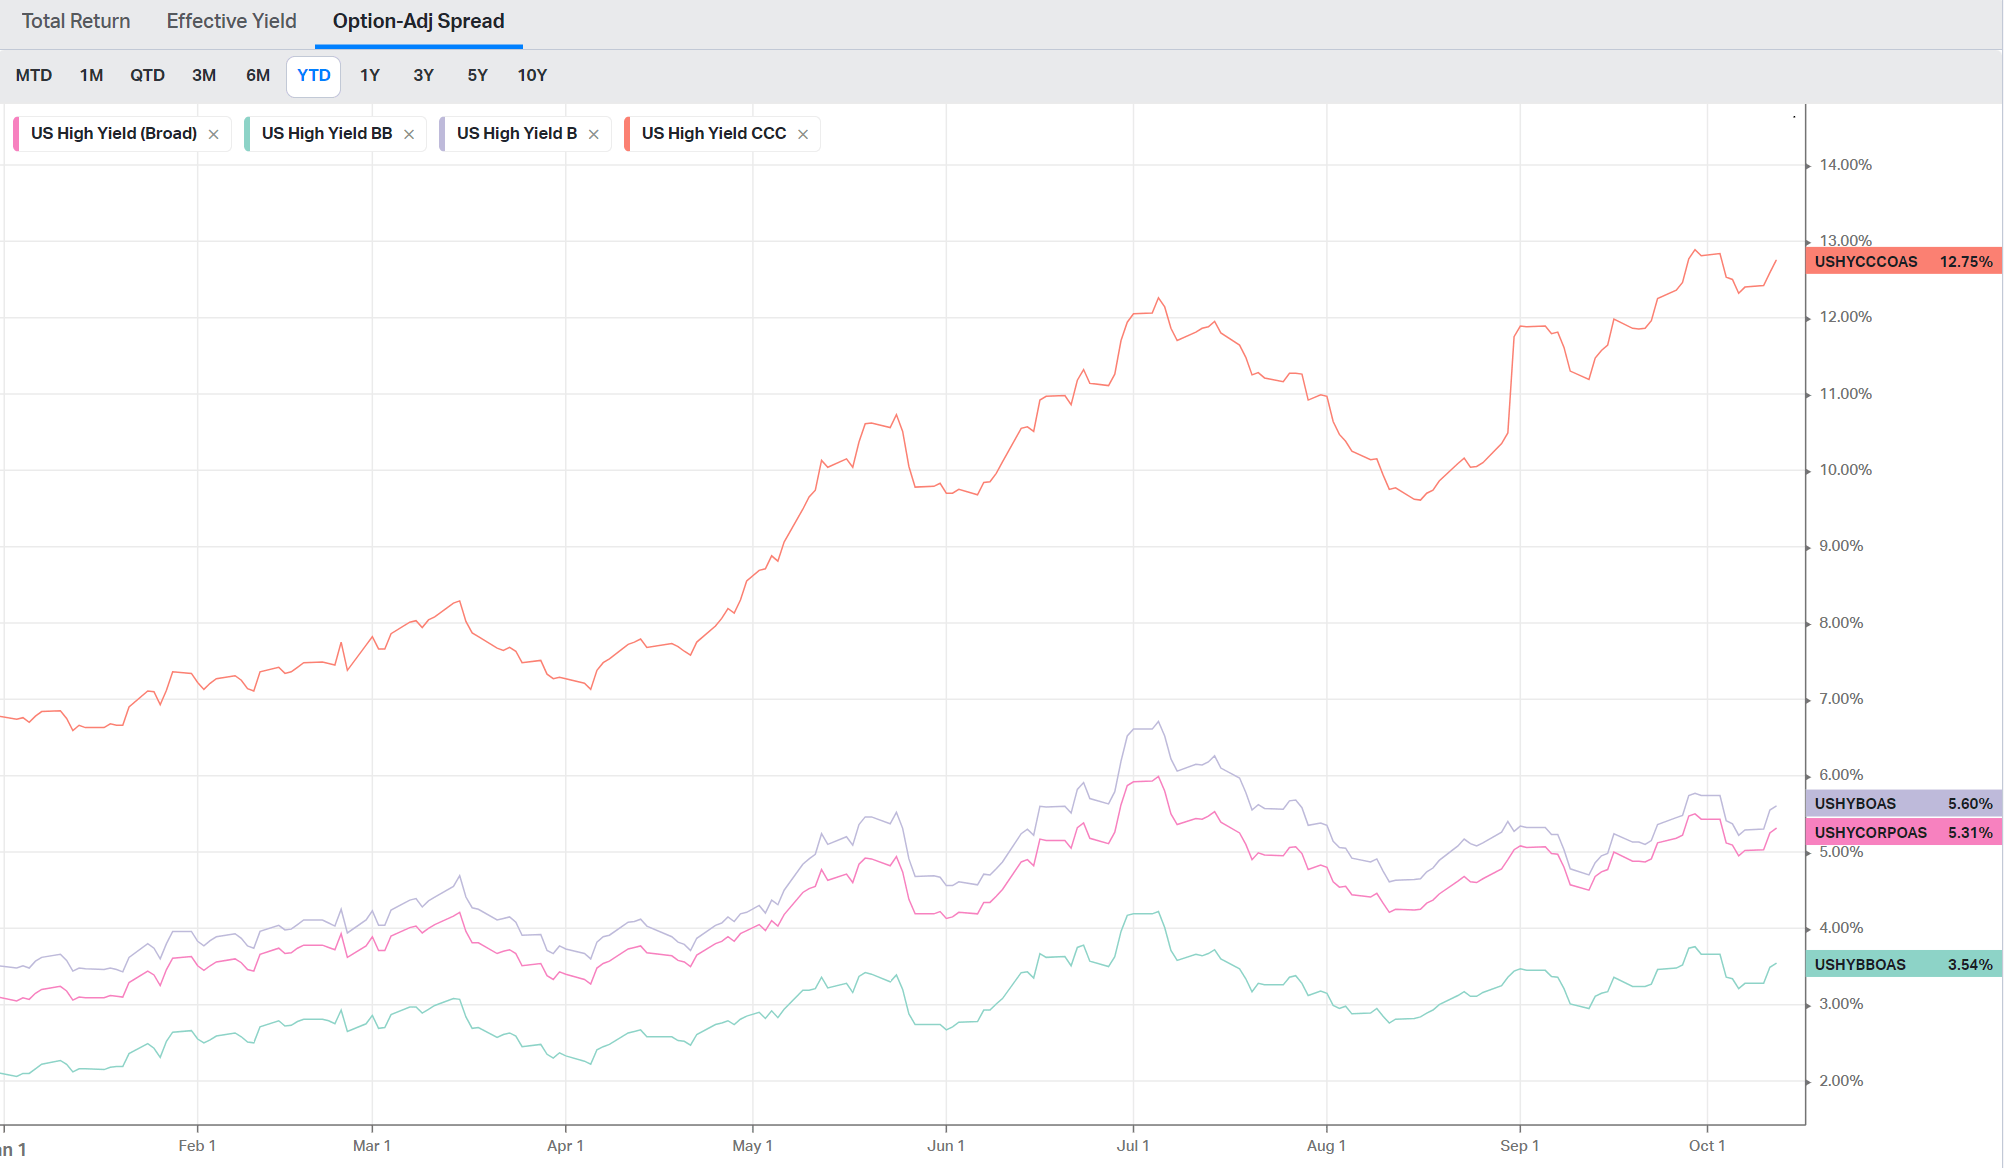
Low Returns For The Risk Assumed
The RA fund has a 13.8% standard deviation of returns over 5 years (Figure 5). Hence on a per unit of volatility, the RA fund only generated 0.11% in returns.
Figure 5 – RA Fund Risk Profile (morningstar.com)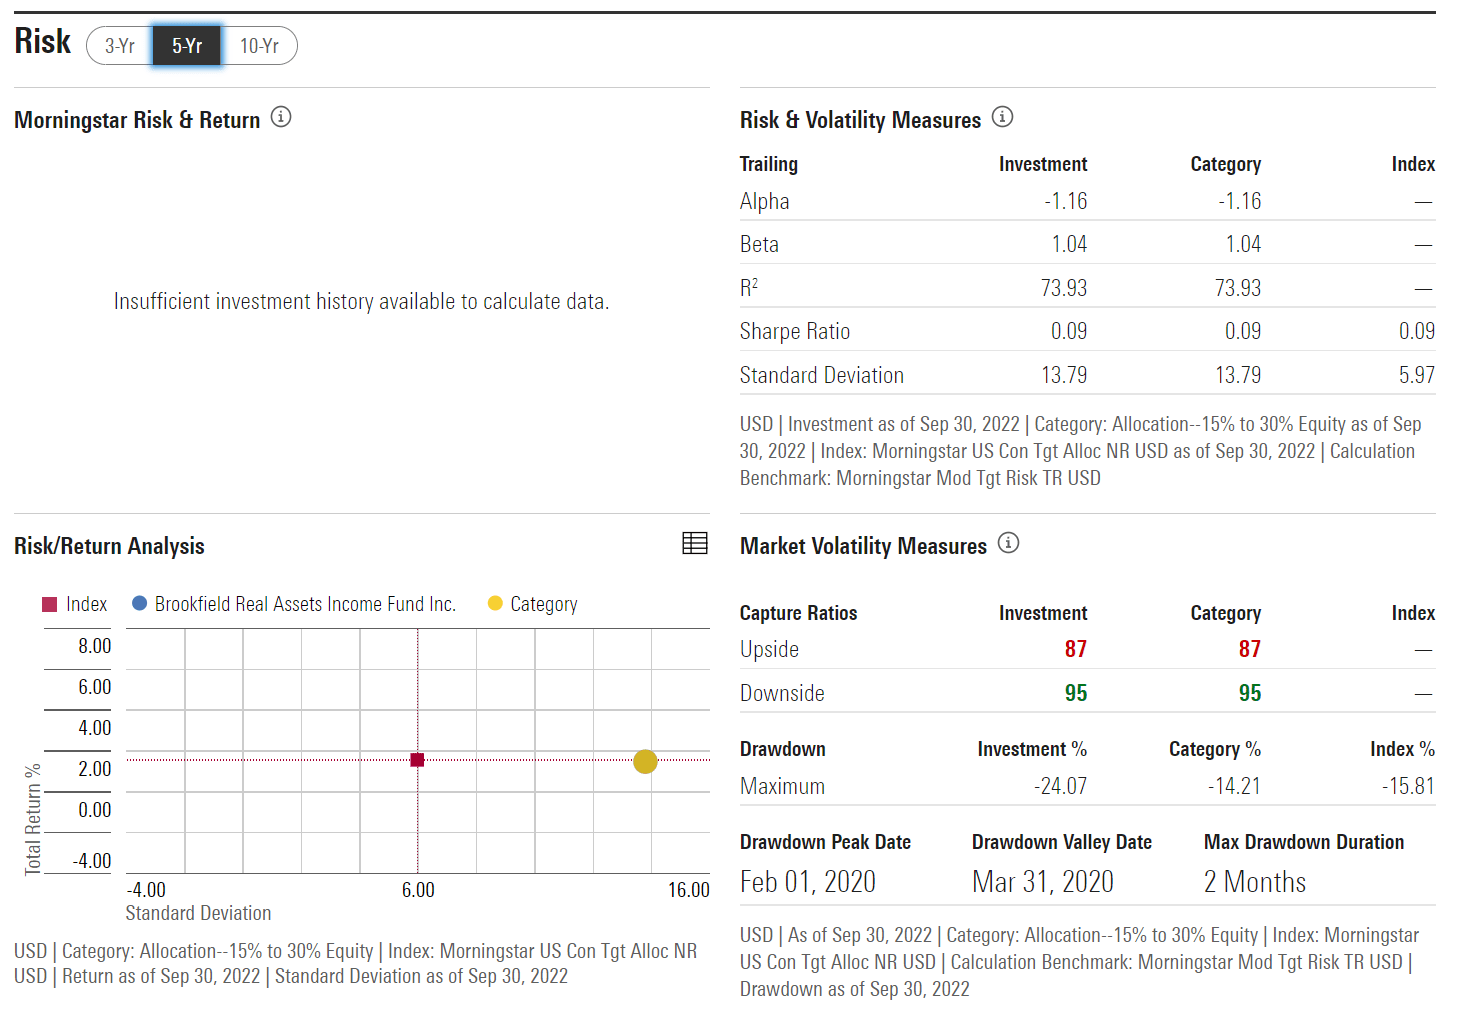
For context, the SPDR S&P 500 Trust ETF (SPY) has a 5 yr average annual total return of 8.8% and a standard deviation of returns of 20.0%, or 0.44% return per unit of volatility.
Distribution & Yield
The RA fund pays a handsome monthly distribution of $0.199 / share, which translates to a 14.2% current yield. The monthly distribution has been held constant since inception, however, its funding has been variable. YTD, $0.52 of the $1.60 (or 32%) in distribution has been funded via net investment income (“NII”), and 68% of the distribution has been funded via return-of-capital (“ROC”). In 2021, NII was 38% of the distribution (Figure 6).
Figure 6 – RA Fund Monthly Distributions (Brookfield website)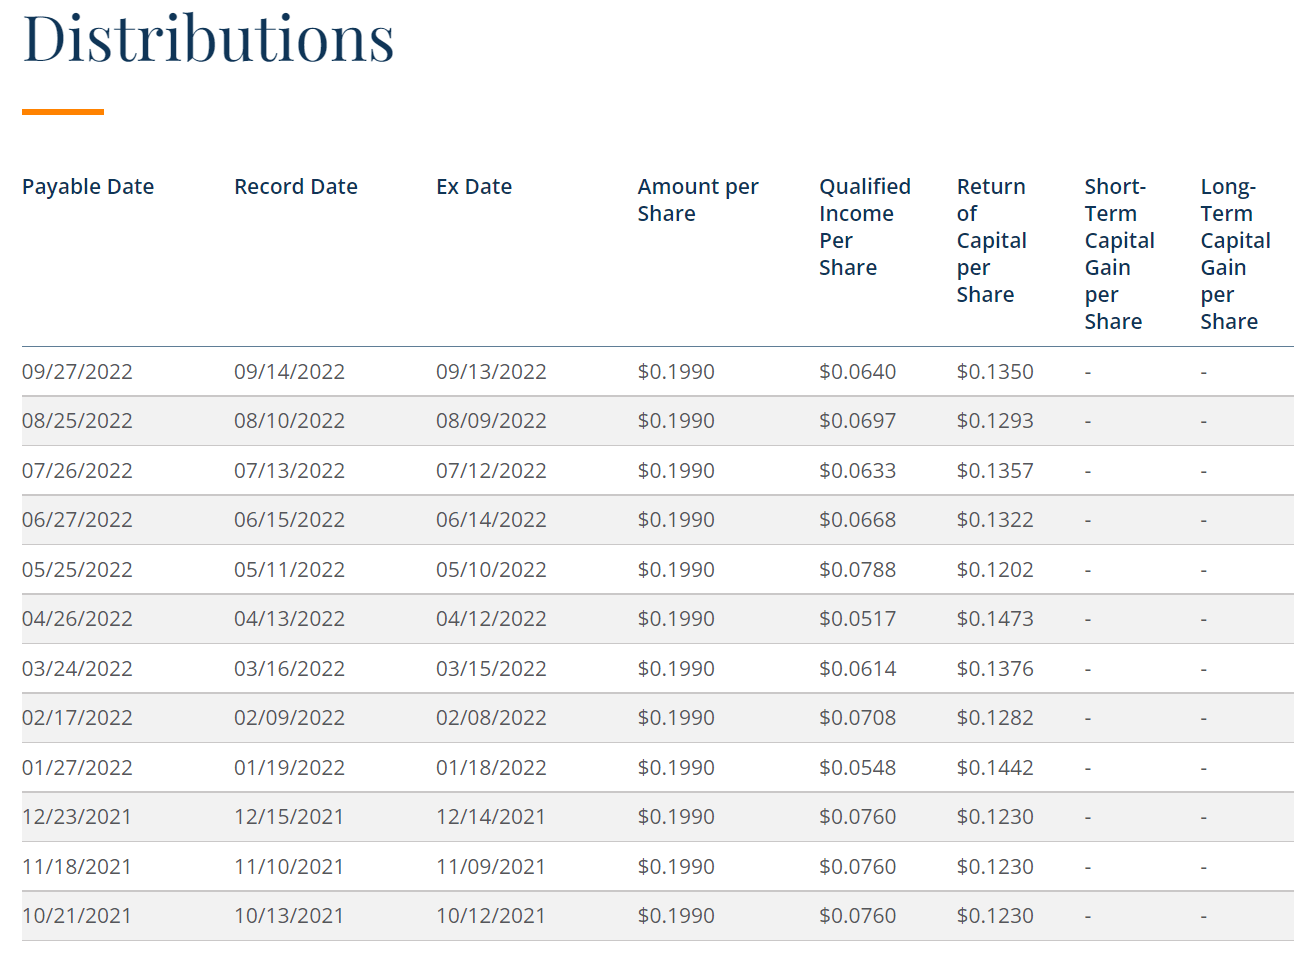
Fees
The RA fund charged a moderately high total expense ratio 2.13% in 2021 (Figure 7). Management fee on the RA fund is charged at 1.0% of gross assets.
Figure 7 – RA Fund Summary Financials (RA Fund 2021 Annual Report)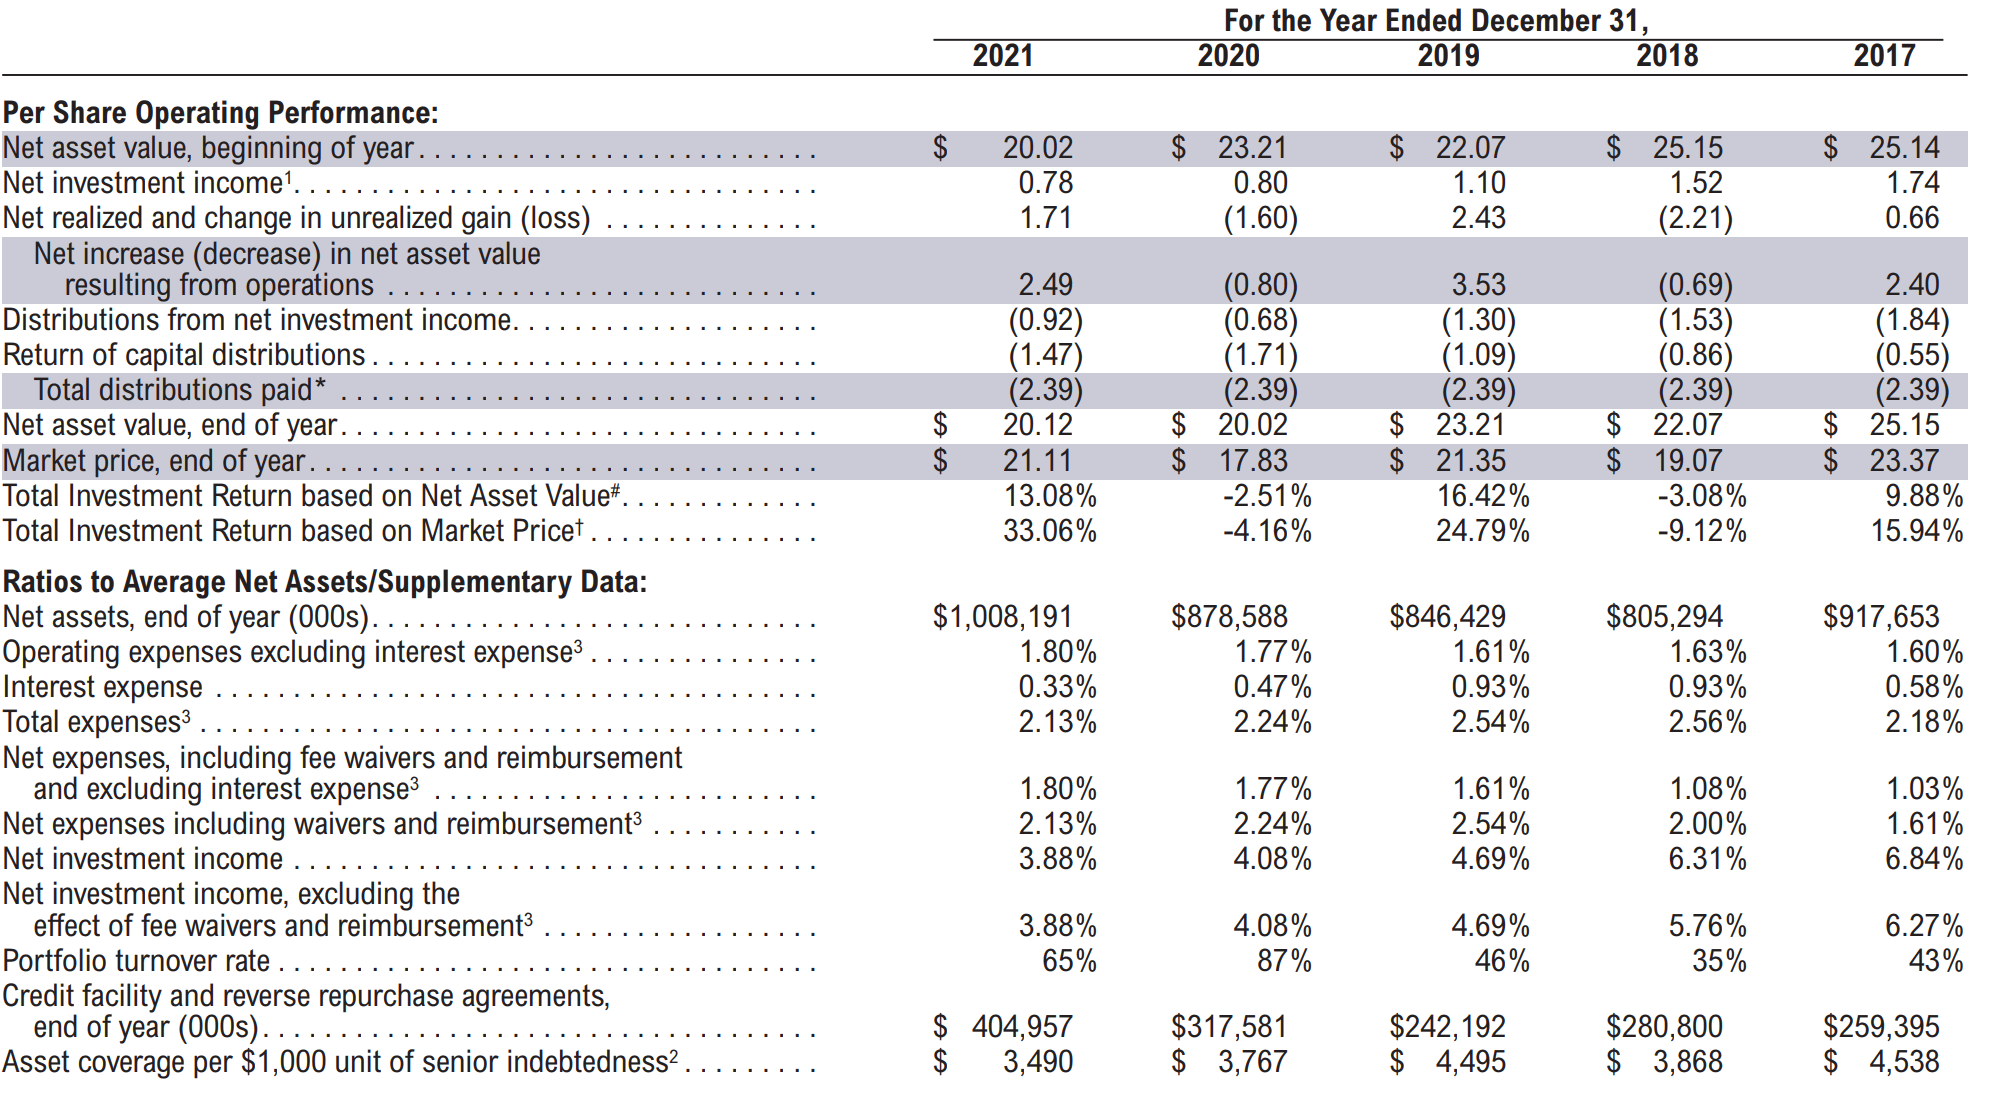
Is The Distribution Sustainable?
The biggest question in my mind regarding the RA fund is whether its distribution is sustainable. From day 1, we know the RA fund has been funding its distribution via a combination of NII and ROC through the data in Figure 5.
Although calendar year returns on a NAV basis have not been impressive, somehow, the RA fund has turned from trading at a steep NAV discount to a NAV premium in early 2021 (Figure 8).
Figure 8 – RA Fund Premium To NAV (CEFConnect.com)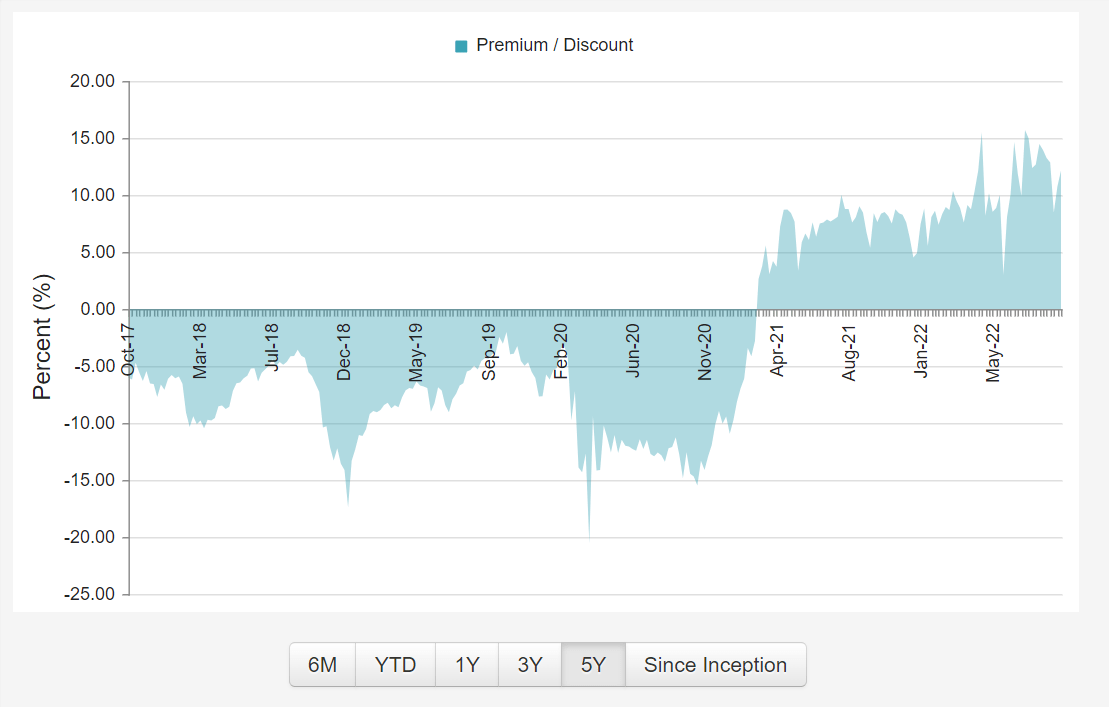
Perhaps it was because the fund was able to consistently pay its monthly distribution despite the COVID pandemic that attracted an investor following.
However, if we step back and think about the distribution rate, we have to ask ourselves, is a 14% yield on market price (or a 15.6% yield on NAV) sustainable, when the Fund earns average total returns of 1.5% per year? If not, then the fund is simply paying investors back with their own money via ROC.
While the distribution may continue at the same rate for many months and quarters, every distribution paid just increases the risk to the future distribution rate and share price.
The analogy I would make is like playing the boardgame Jenga; every distribution paid with ROC increases the premium to NAV and is akin to a Jenga block being removed from the block tower. Eventually, the tower becomes unstable and prone to collapse. The collapse can potentially happen during the next financial crisis when investors may lose both income and capital if the distribution is cut and the shares re-rate.
DRIP & ATM Offering Add To Net Assets But Do They Add Value?
One “feature” that appears common to many CEFs is the constant issuance of shares through an at-the-market (“ATM”) offering and a discounted dividend reinvestment plan (“DRIP”). The RA fund employs both.
Many CEF investors swear by these features, presumably because issuance of shares above NAV is “accretive,” and investors can get more shares at a “discount” to market prices via the DRIP. I am not a big fan of either when the underlying assets themselves do not earn a sufficient return.
Think of this example: On a $15 NAV per share, and $17 market price, if a fund earns only $1 per share in investment income, but pays $2 per share in distribution, then after 1 year, NAV will have declined to $14 per share. Even if investors are able to DRIP shares at a 5% discount, they are effectively paying $16.15 for assets that are worth a declining NAV of $14 after 1 year.
Furthermore, investors typically buy CEFs for their high distribution yields to fund retirements. If one of the conditions to attain the marketed total returns is to reinvest distributions via a DRIP, then that defeats the purpose of buying the CEF investment in the first place.
On the ATM, remember the RA fund only earn 35-40% of its distribution in income. Hence, any capital raised through the ATM offering is most likely added to short-term liquidity and paid right back to unitholders through the next monthly distribution. Viewed under a harsher light, some might even say it has semblance of more nefarious “Ponzi” schemes.
Conclusion
In conclusion, while the Brookfield Real Assets Income Fund Inc. may pay an attractive current distribution yield of over 14%, I don’t think this yield is sustainable over the long run as the underlying assets have only generated a disappointing average annual total return of 1.5% over 5 years. If the assets don’t earn a sufficient return, the premium to NAV just keeps on increasing due to the high distribution payout. Increasing premium to NAV is symptomatic of increasing risk, i.e., it is an unstable system that may normalize with a distribution cut due to some future financial crisis.
Be the first to comment