

Bet_Noire
A guest post by D Coyne
The OPEC Monthly Oil Market Report (MOMR) for November 2022 was published recently. The last month reported in most of the OPEC charts that follow is October 2022 and output reported for OPEC nations is crude oil output in thousands of barrels per day (kb/d). In most of the OPEC charts that follow the blue line is the monthly output and the red line is the centered twelve-month average (CTMA) output. I also show a number of charts from the recent World Energy Outlook 2022, published by the IEA in October. I focus on a selection of charts from Chapter 7 of that report which covers oil.
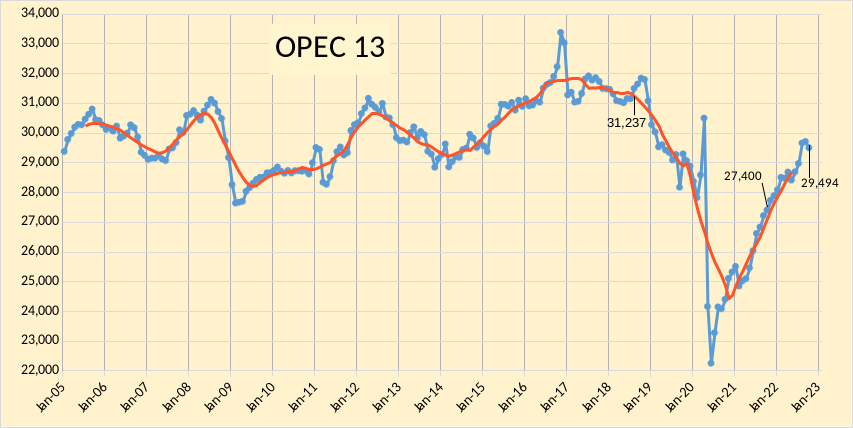
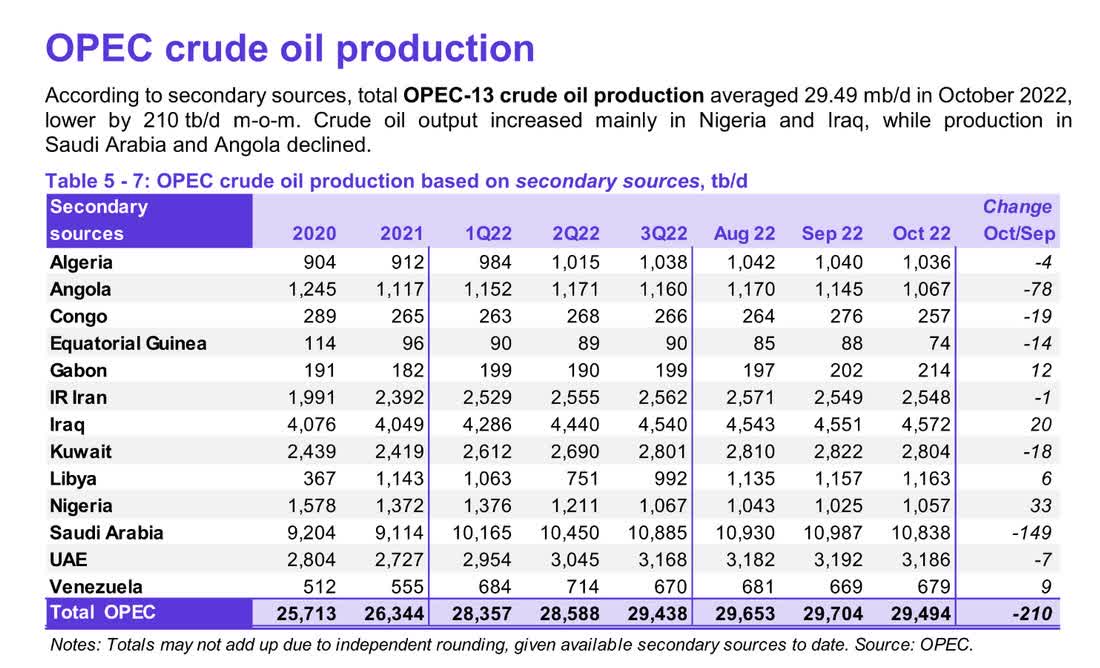
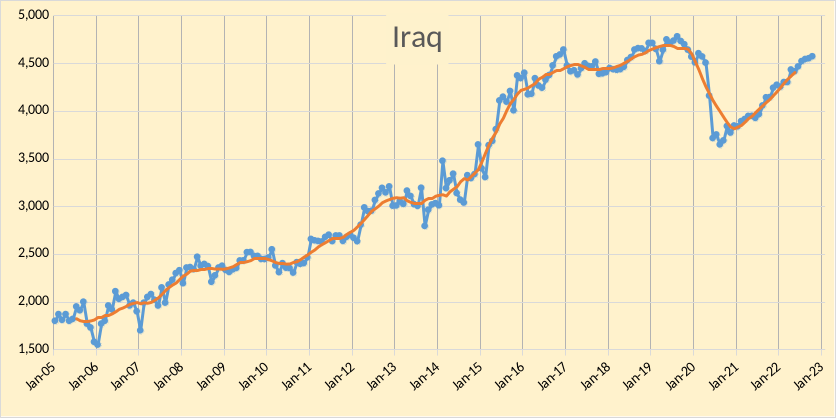
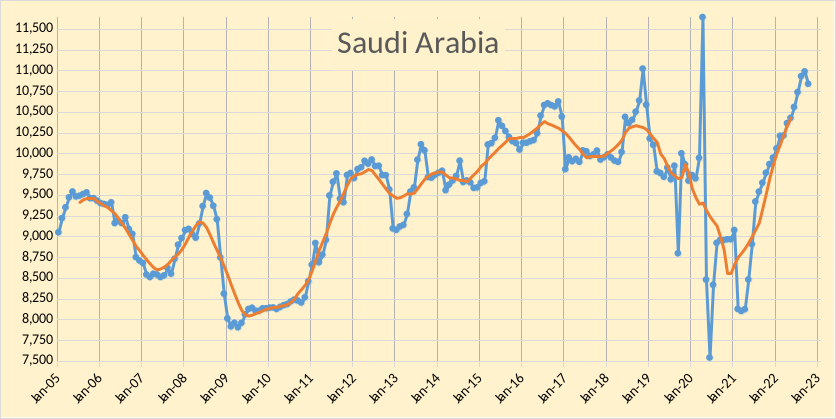
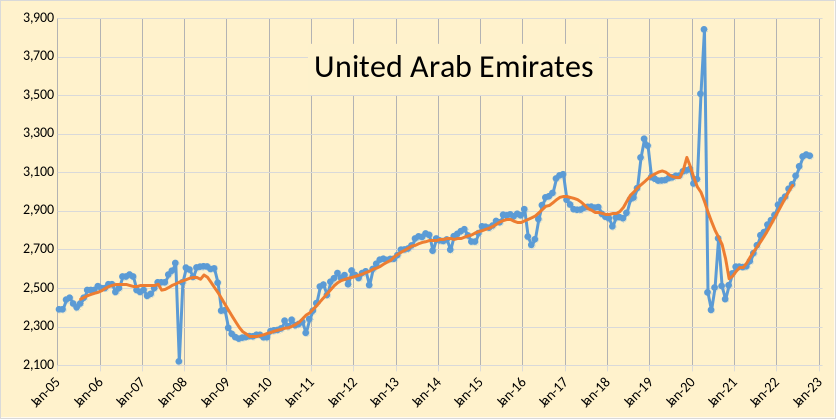
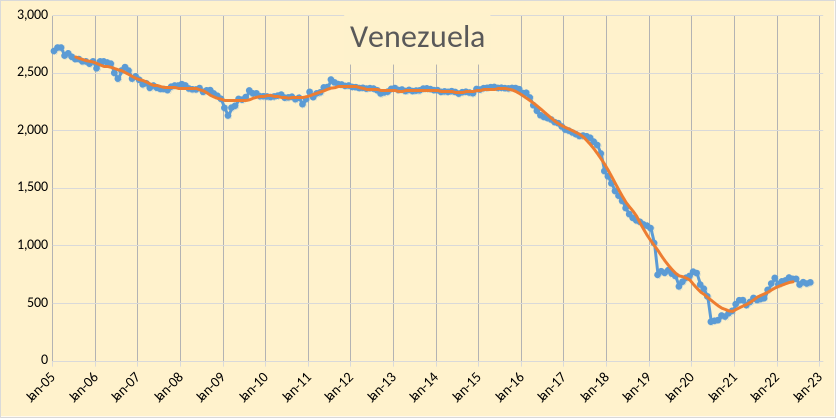
OPEC crude output was revised lower in September 2022 by 63 kb/d compared to last month’s report and August 2022 OPEC crude output was revised higher by 83 kb/d. OPEC output has increased by 2094 kb/d since Sept 2021, from 27400 kb/d to 29494 kb/d. When the World was at its centered twelve-month average peak for C+C output in August 2018, OPEC crude output was 31237 kb/d (as shown on the chart), September OPEC crude output was 1743 kb/d below that level.
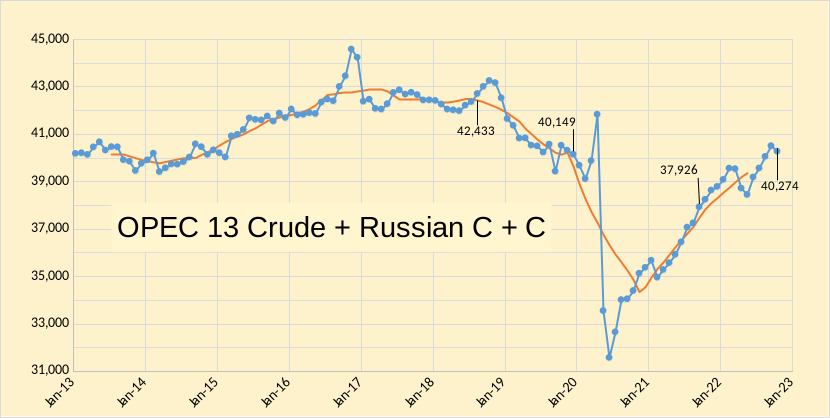
In the chart below, we have Russian C+C and OPEC crude oil output. Output for OPEC13 crude and Russian C+C was 42433 kb/d in August 2018 when World C+C output was at its centered 12-month average peak, output for Russia and OPEC was 2159 kb/d below the August 2018 level at 40274 kb/d in October 2022. In the past 12 months, OPEC and Russian output has increased by 2348 kb/d from 37926 kb/d in October 2021.
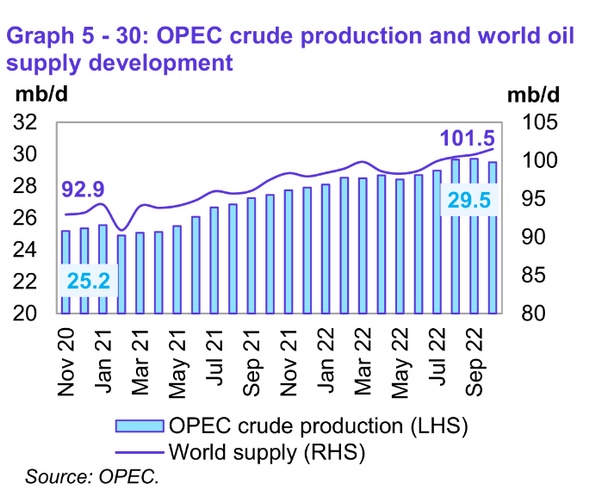
World Oil Supply (including NGL) was 101.5 Mb/d in October 2022, 8.6 Mb/d higher than output in November 2020, about half of this increase was due to the 4.3 Mb/d increase in OPEC crude oil output from 25.2 to 29.5 Mb/d over the same 23-month period.
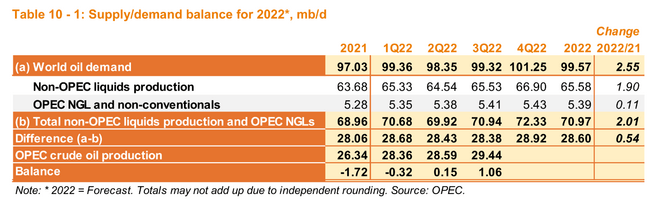
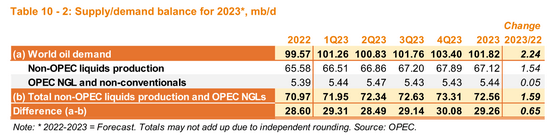
The demand estimate for 2022 was revised from 99.67 Mb/d last month to 99.57 Mb/d this month and 20224Q demand was revised lower by 390 kb/d, with the call on OPEC falling to 28.92 Mb/d for the fourth quarter of 2022, with October output at 29.49 Mb/d, it is clear why OPEC believes that a reduction in OPEC output is necessary. In 2023, the World oil demand forecast was reduced by 200 kb/d from last month’s OPEC report and the call on OPEC remains below the October 2022 output level until the fourth quarter of 2023, with the average level for the year being 230 kb/d below the October output level.
Note also that in the recent Oil Market Report from the IEA demand growth in 2022 is expected to be only 2.1 Mb/d and 1.6 Mb/d in 2023 vs OPEC’s estimate of 2.55 Mb/d in 2022 and 2.24 Mb/d in 2023. If the demand estimates by the IEA are correct, this suggests that OPEC cuts may need to be 640 kb/d larger, if the OPEC estimates for non-OPEC supply are accurate.
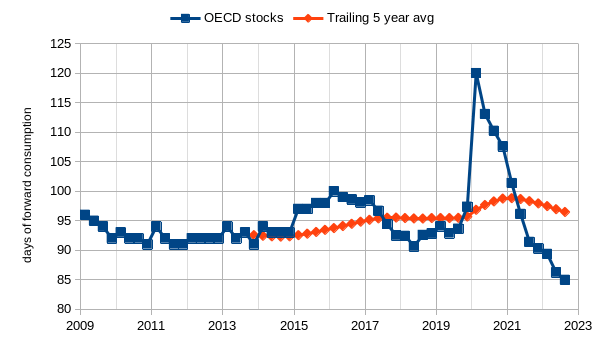
OECD total stocks, including both SPR and commercial stocks, have fallen even lower than last month’s estimate to 85 days of forward consumption (last month we were at 87 days). Perhaps stocks will build in the fourth quarter of 2022 and in 2023 as the likely recession may reduce demand for oil. If not, we should expect oil prices to increase.
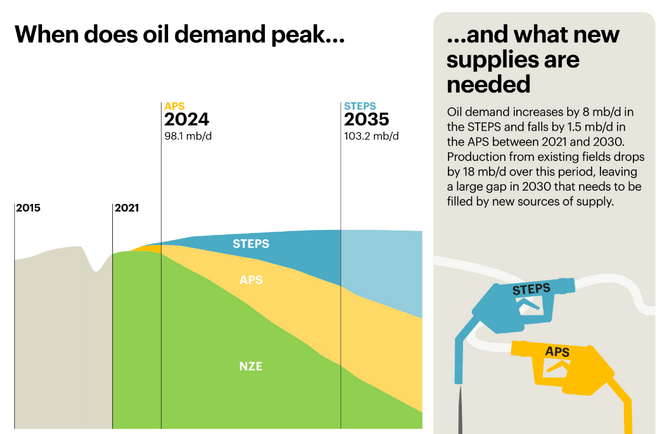
Based on BP data on NGL output and the recent trend in natural gas output and the barrels of NGL produced per MCF of natural gas production recently, I estimate that the peak for the APS scenario in 2024 corresponds with World C+C output of about 84.5 Mb/d. I did not try to estimate for the STEPS scenario as it does not seem realistic, likewise, I am skeptical that the NZE scenario can be achieved but hope I will be wrong. Something roughly midway between the APS and NZE scenarios might be achievable in my opinion.
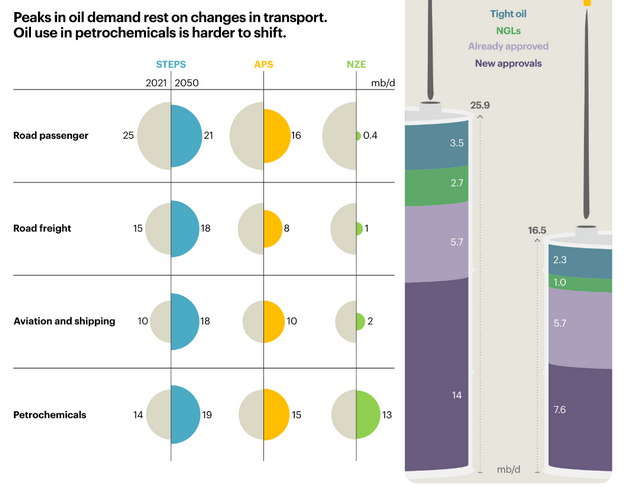
About 26 Mb/d of new oil output is needed between 2021 and 2031 (see right side of figure 8) and in figure 9 on the right side, it shows how this supply gap will be filled for the STEPS and APS scenarios. On the left side of figure 9, it shows how demand is expected to change in various sectors from 2021 to 2050 for the 3 scenarios.
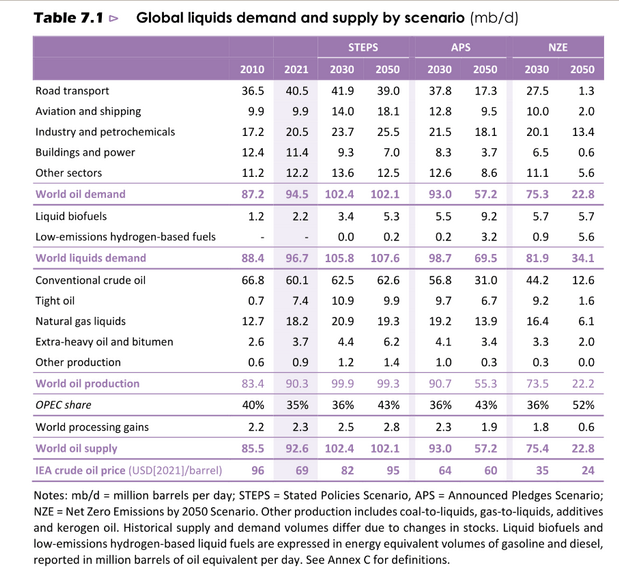
Demand and supply for oil for the 3 scenarios are covered in figure 10 above.
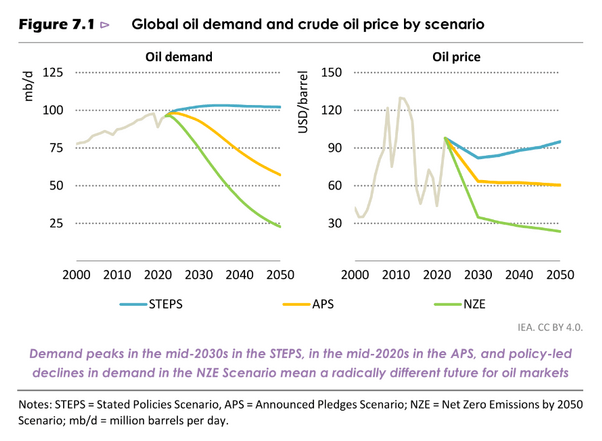
Oil demand in figure 10 includes NGL, at the peaks C+C output would be roughly 14% lower. Note the difference in oil prices in the three scenarios in the right panel of figure 11.
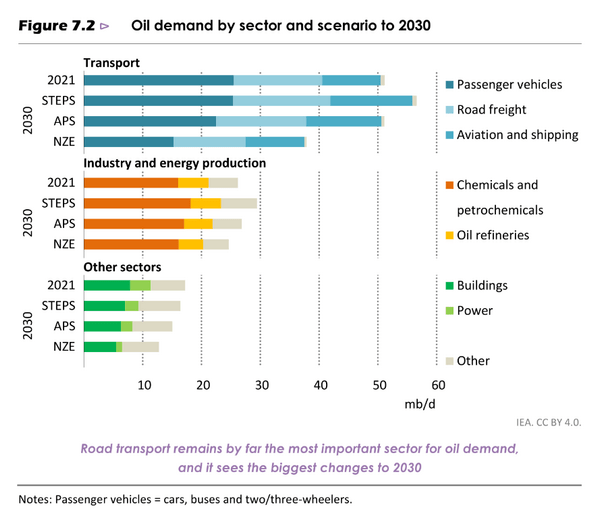
Note that by 2030, only the NZE scenario has a significant change in oil demand in the transport and industry and energy sectors relative to 2021, there is a slight decrease in oil demand in the “Other Sectors” demand in both STEPS and APS, with the higher reductions in the NZE.
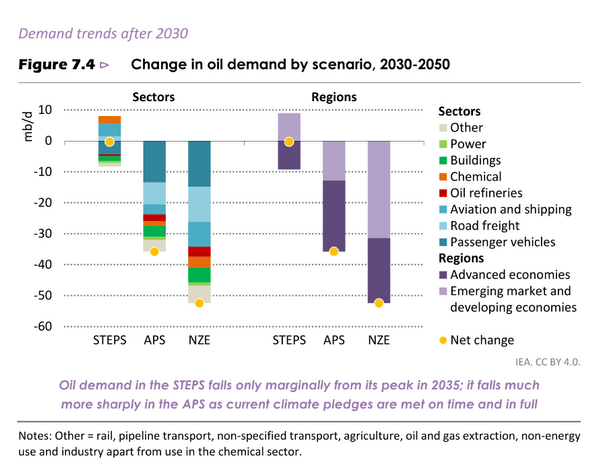
The chart above focuses on changes from 2030 to 2050, where the previous 2 charts looked at changes from 2021 to 2030.
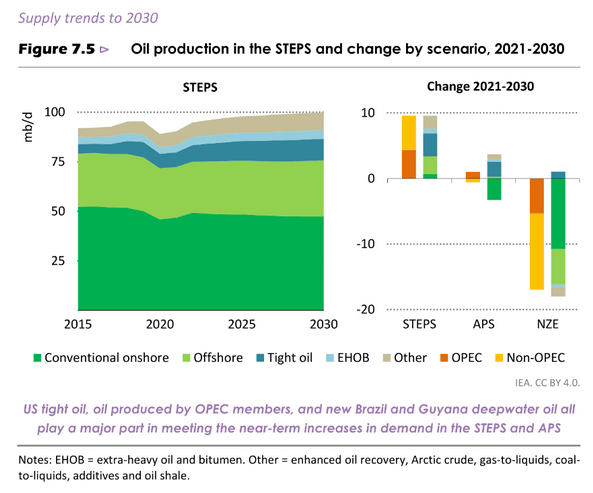
The panel on the right looks at changes for the 3 scenarios from 2021 to 2030.
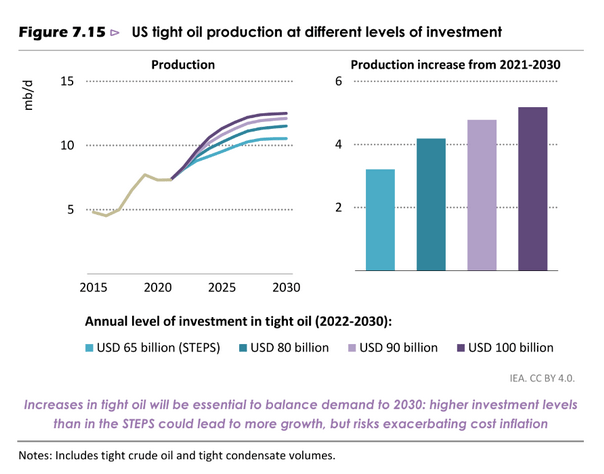
My best-guess scenario has US tight oil output at 10.7 Mb/d in 2028, between the two lowest scenarios shown in Figure 16 above with the difference that my scenario has output decreasing to under 10 Mb/d by 2030.
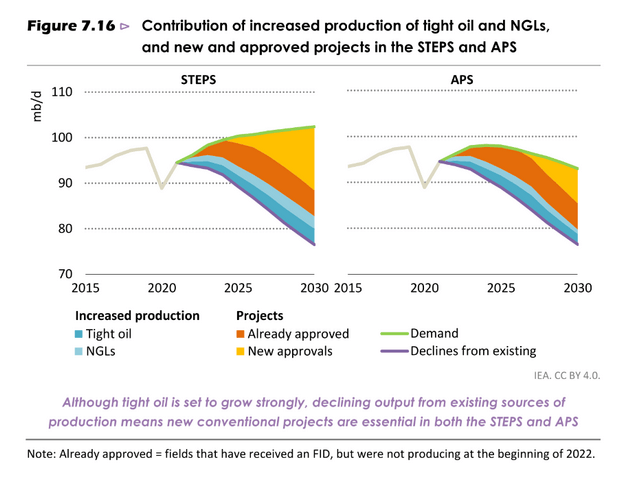
To me, the APS scenario with no new approvals looks reasonable, that would put 2030 output at about 73 Mb/d for C+C (85*.86=73 Mb/d). Between 2030 and 2040, I expect demand for oil may be falling even more rapidly and the decline curve may steepen.
Editor’s Note: The summary bullets for this article were chosen by Seeking Alpha editors.
Be the first to comment