

ozgurdonmaz
Author’s note: This article was released to CEF/ETF Income Laboratory members on September 25th.
I’ve covered several covered call ETFs in the recent past, as their strong, fully-covered dividend yields make them enticing investments for many income investors and retirees. These same funds tend to suffer from declining long-term asset values and dividends, a significant negative for investors. The Nasdaq 100 Covered Call & Growth ETF (NASDAQ:QYLG) seeks to ameliorate these issues, by only selling covered calls on 50% of its holdings. Doing so boosts the fund’s dividend yield to 6.4%, quite a bit higher than average for an equity fund, while still retaining moderate upside potential and the potential for moderate long-term dividend growth. QYLG is a buy, and particularly appropriate for income investors looking for tech-heavy equity funds.
QYLG is structured as to be very similar to a 50% investment in Global X NASDAQ 100 Covered Call ETF (QYLD), and a 50% investment in the Invesco QQQ ETF (QQQ). QQQ is quite a bit cheaper than QYLG, so going for the 50-50 portfolio is the cheaper, stronger choice, but a bit more complicated to set up. QYLG is a fine investment, but do consider an investment in QYLD and QQQ instead.
QYLG – Basics
- Investment Manager: Global X
- Underlying Index: Cboe Nasdaq-100 Half BuyWrite V2 Index
- Expense Ratio: 0.60%
- Dividend Yield: 6.43%
QYLG – Overview
QYLG invests in Nasdaq-100 components, and sells covered calls on 50% of its holdings.
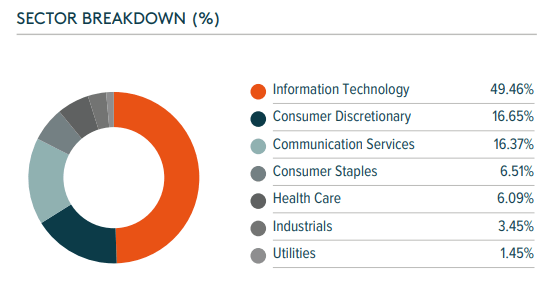
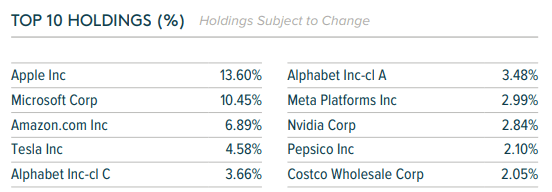
The Nasdaq-100 index is a well-known U.S. equity index investing in the 100 largest non-financial companies trading in the Nasdaq exchange. Said index overweight its largest components, currently all mega-cap tech stocks. The result is a reasonably well-diversified portfolio, but one which is significantly overweight tech as an industry, and mega-cap tech stocks in particular. Industry exposures and largest holdings are as follows.
QYLG
QYLG
Being significantly overweight tech means the fund’s performance is somewhat dependent on the performance of the tech industry. Tech underperformance decreases QYLG’s returns, and vice versa.
QYLG sells covered calls on around 50% of its holdings. Selling a covered means selling most potential capital gains for cash, most of which is distributed to shareholders in the form of dividends. Potential capital losses remain unchanged.
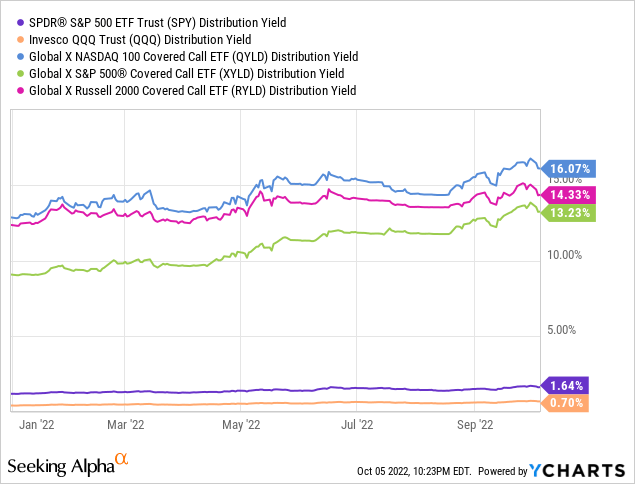
Selling covered calls leads to increased dividend yields, with QYLG itself yielding 6.4%, excluding a special capital gains distribution in late 2021. QYLG’s dividend yield is quite strong, and significantly higher than average for an equity index fund. On the other hand, it is significantly lower than the yield offered by funds selling covered calls on 100% of their holdings, most of which sport double-digit yields.
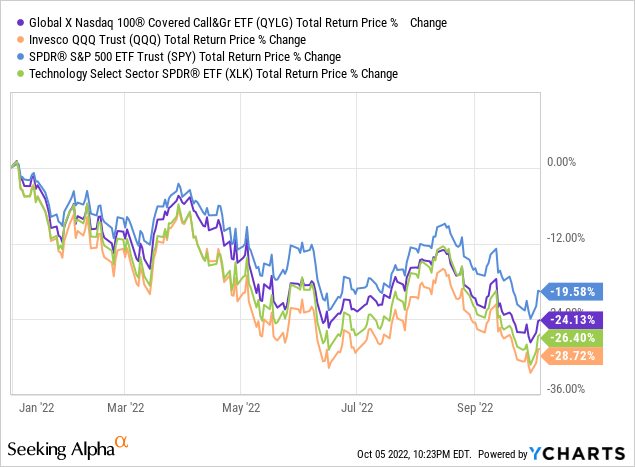
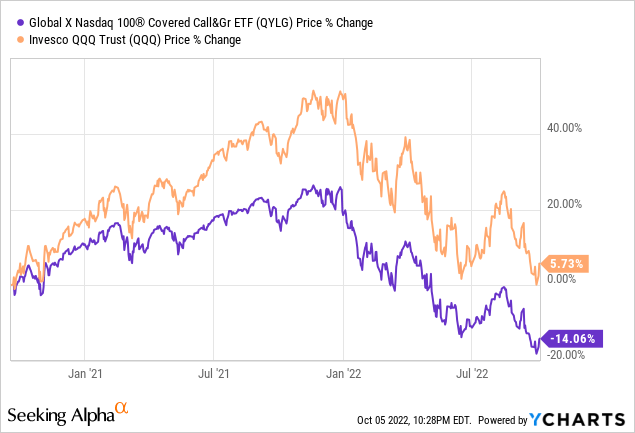
QYLG’s strong dividend yield is a benefit for the fund and its shareholders, and particularly impactful when markets drift down or are flat. As an example, QYLG’s dividends have allowed the fund to outperform relative to its index, the Nasdaq-100, YTD / during the current bear market. QYLG has underperformed relative to broader equity indexes, including the S&P 500, due to tech underperformance.
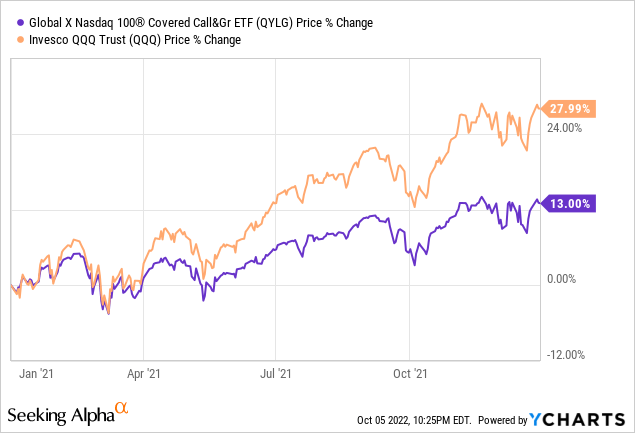
Selling covered calls significantly reduces potential capital gains. QYLG sells covered calls on 50% of its holdings, which means potential capital gains are reduced by around 50%. QYLG saw capital gains of 13.0% during most of 2021, during which the Nasdaq-100 rose 28.0%, consistent with expectations.
Selling covered calls boosts a fund’s dividend yield, which increases total returns, while reducing potential capital gains, which reduces total returns. The net effect should be negative, as equity capital gains tend to be quite high, and common. Stocks mostly go up, and by a lot, so reducing capital gains is generally a bad idea.
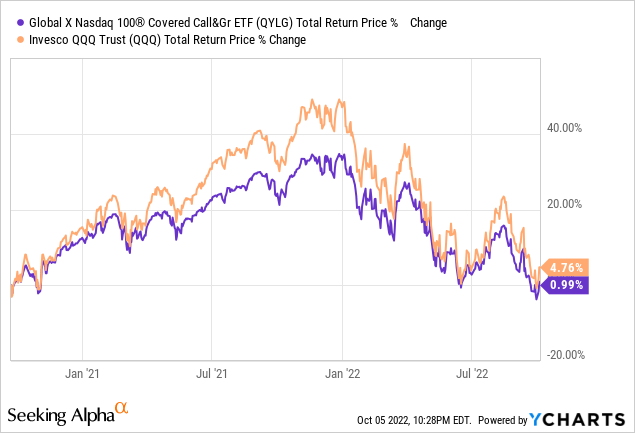
QYLG has slightly underperformed since inception, consistent with expectations. Outperformance was almost entirely due to experiencing lower capital gains during 2021, during which tech soared.
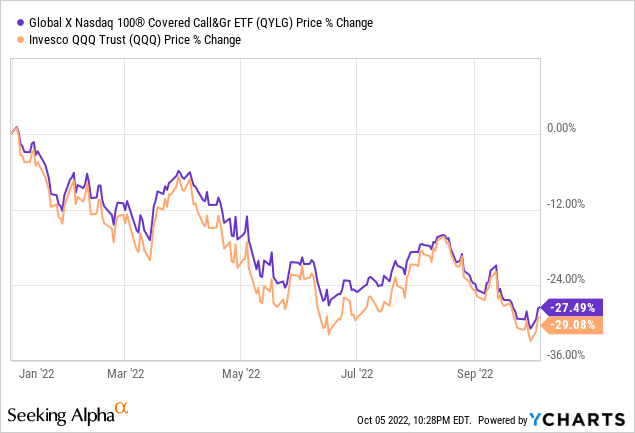
Selling covered calls has no impact on downside potential, so expect average capital losses for QYLG, and for said capital losses to equal those of the Nasdaq-100. QYLG has seen broadly similar, very slightly lower, capital losses relative to its index YTD, as expected.
QYLG’s upside potential is moderately reduced, while downside potential remains unchanged. As bull markets are much more common than bear markets, the result should be a fund experiencing moderate long-term capital gains, albeit lower than average for an equity fund. That has not been the case since inception, as the fund is relatively new, and has (mostly) being mired in a bear market since inception.
Let’s summarize the above.
QYLG invests in Nasdaq-100 components, and sells covered calls on 50% of its holdings. Doing so serves to boost the fund’s dividend yield, moderately reduces its potential capital gains, and has no impact on downside potential. The net effect should be slightly negative, but the increased yield might make the fund an attractive investment opportunity for some income investors and retirees.
QYLG versus QYLD, XYLD, and RYLD
QYLG is somewhat similar to other covered call funds in the market, so thought to do a quick comparison between QYLG and some of its peers.
The three largest, most well-known covered call ETFs in the market are:
- the Global X NASDAQ 100 Covered Call ETF (QYLD), which invests in Nasdaq-100 components and sells covered calls on 100% of its holdings
- the Global X S&P 500 Covered Call ETF (XYLD), which invests in S&P 500 components and sells covered calls on 100% of its holdings
- the Global X Russell 2000 Covered Call ETF (RYLD), which invests in Russell 2000 components, and sells covered calls on 100% of its holdings
Relative to the funds above, QYLG’s most significant difference is the fact that the fund only sells covered calls on 50% of its holdings. Doing so lessens the impact of its covered call strategy, making the fund a more vanilla choice, with characteristics which are more similar to those of its underlying index. In other words, QYLG is a less extreme version of QYLD, XYLD, and RYLD.
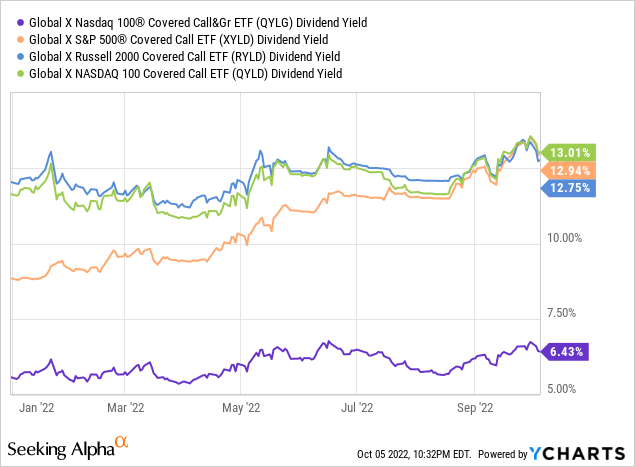
QYLG has a lower dividend yield than its peers, although it still has a reasonably good yield on an absolute basis.
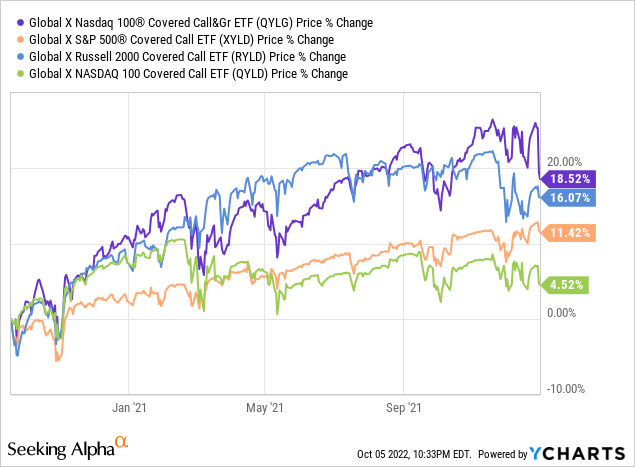
QYLG’s potential capital gains are higher than those of its peers, although somewhat complicated by differencing industry exposures and holdings. Below, a graph showing the capital gains / price change of these four funds since inception until early 2022. I’m excluding YTD performance, to focus on capital gains / avoid capital losses.
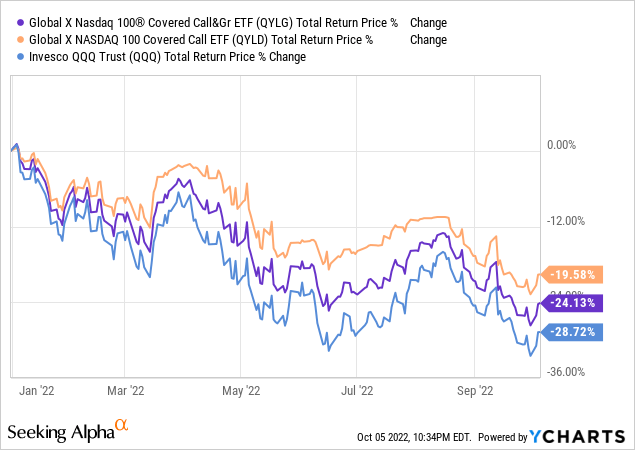
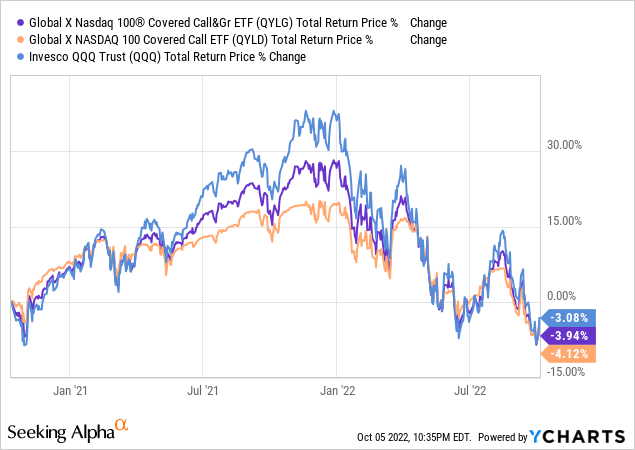
QYLG outperforms when markets drift downwards or flat, but by less than its peers. Graph below only compares QYLG with QYLD, as the fund’s increased tech exposure led to lower total returns YTD. Increased tech exposure does not change QYLG’s potential outperformance during these market movements, however.
QYLG should underperform on a long-term total return basis than its peers, as selling fewer covered calls means greater upside potential (more accurately, lessens the decrease in upside potential). This has technically been the case since inception, but, in practice, these three funds have seen equal performance since inception.
In my opinion, if forced to pick one fund between QYLG and its peers, I would pick QYLG, as it is a much more balanced fund. QYLG has a good yield without significantly jeopardizing its potential capital gains, long-term total returns, or performance during bull markets. Its peers have a much higher yield, but are inferior to QYLG in most other aspects. QYLG’s more balanced characteristics, fundamentals, and payment profiles are a significant benefit for the fund and its shareholders, and make it a better standalone fund.
On the other hand, there is nothing stopping investors from combining QYLD, XYLD, or RYLD with other funds, and that combination might make for a more balanced, overall stronger portfolio. Going 50% QYLD and 50% QQQ would lead to a very similar portfolio to that of QYLG itself, while slightly reducing expenses. Combining any of these three funds with more normal equity or bond funds could also potentially lead to balanced, but high-yielding, portfolios. This is the best choice, in my opinion at least.
Besides the above, investors could also invest in QYLD, XYLD, or RYLD, and re-invest a portion of their excess dividends themselves.
Consider these possibilities before choosing to invest in QYLG.
Conclusion
QYLD’s strong 6.4% dividend yield and potential outperformance during sideways market movements make the fund a buy.
Be the first to comment