

ChristianChan
While the Nasdaq 100 Covered Call ETF’s (NASDAQ:QYLD) 15.7% looks very attractive, investors need to be aware of the massive tradeoff between upside versus income they are making. Judging from recent history, the QYLD has only delivered 30% of the upside of the Nasdaq 100 Index during the 2020-2021 bull market, while it has delivered more than 64% of the downside of the of the 2022 bear market. I believe this is a poor risk/reward bet.
Fund Overview
The Nasdaq 100 Covered Call ETF owns the stocks in the Nasdaq 100 Index and seeks to generate high current income through selling call options. The QYLD is a popular ETF with over $6.6 billion in assets.
Strategy
The QYLD ETF achieves its investment objective by owning the stocks that make up the Nasdaq 100 Index and selling covered call options on the index.
Call options can be written in-the-money (“ITM”), at-the-money (“ATM”), or out-of-the-money (“OTM”). Moneyness refers to the strike price of options relative to the market price. Moneyness determine how much premiums are received and the upside potential of the fund (Figure 1).
Figure 1 – Moneyness of options sold (globalxetfs.com)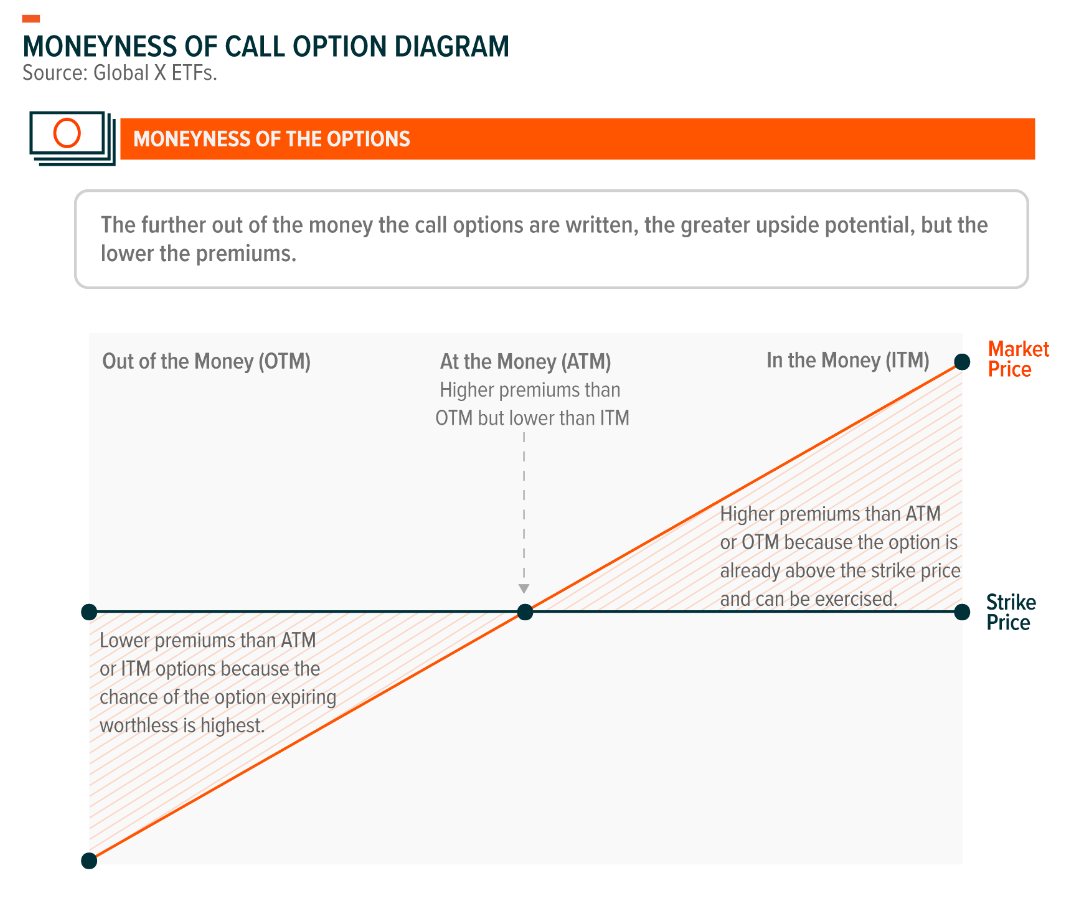
The QYLD ETF write one-month at-the-money (“ATM”) call options that are rolled monthly. The covered calls encompass 100% of the notional value of QYLD’s portfolio. Figure 2 illustrates the mechanics of the fund’s operation.
Figure 2 – QYLD operations explained (globalxetfs.com)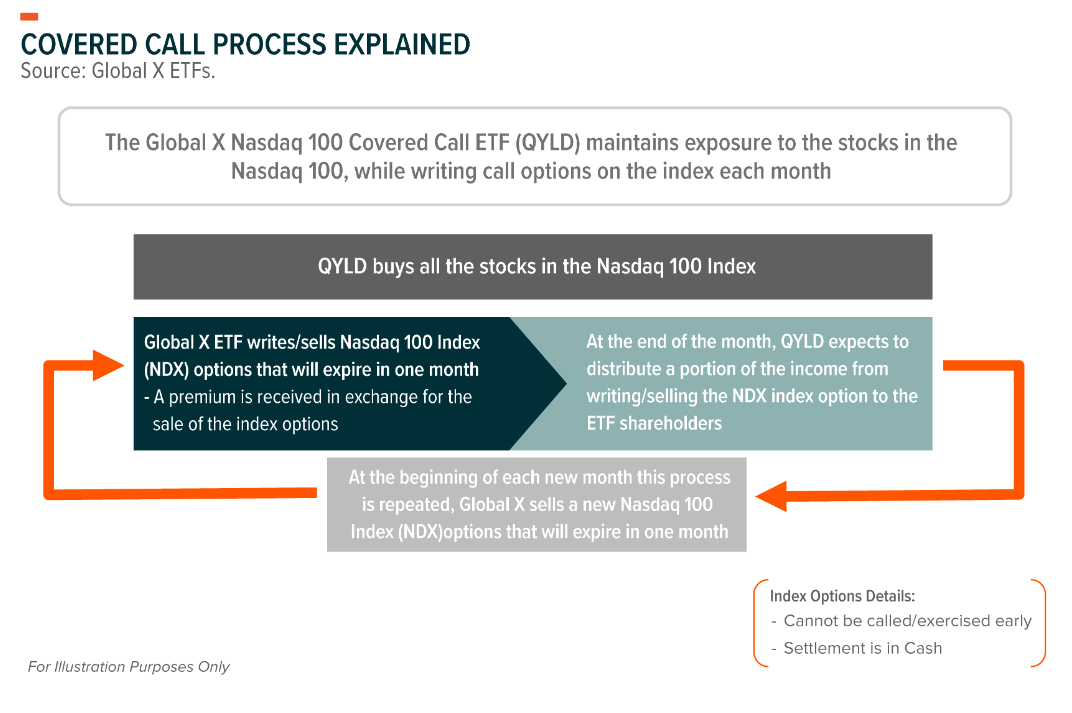
Portfolio Holdings
The QYLD ETF holds all the stocks in the Nasdaq 100 Index (Figure 3). What’s not shown in the fund’s holdings reports are the call option positions that have been sold.
Figure 3 – QYLD holds all the stocks of the Nasdaq 100 (globalxetfs.com)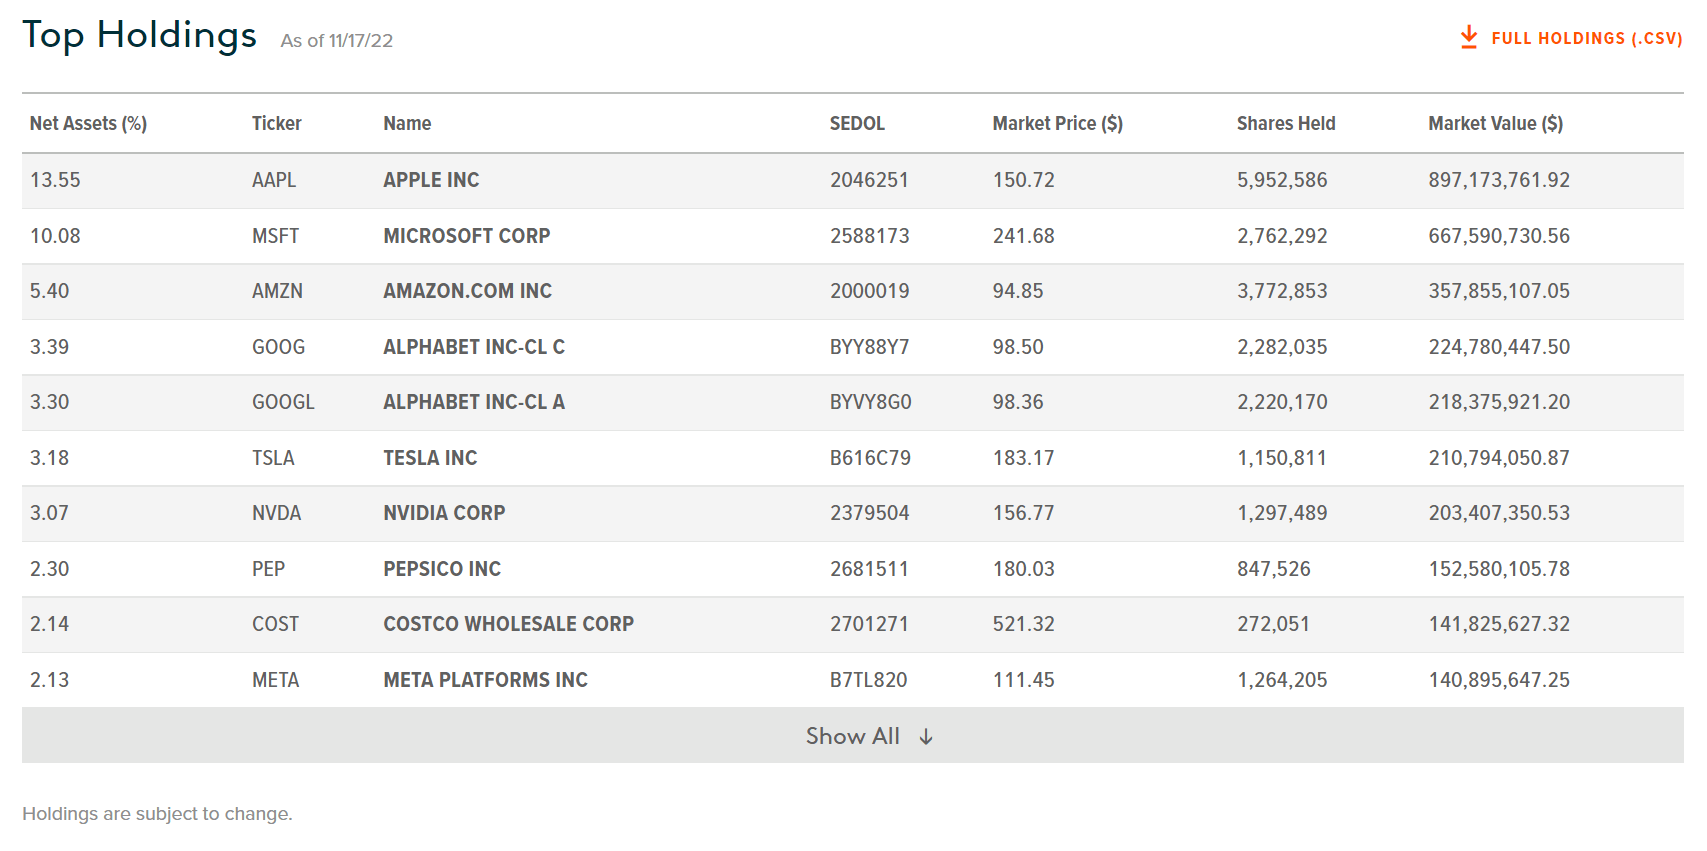
Returns
The QYLD has generated modest total returns over the long run, with 3 and 5Yr average total returns of 0.1% and 3.4% respectively (Figure 4). 1Yr performance has been poor, as the stocks underlying the Nasdaq 100 Index have been hit hard by the current bear market.
Figure 4 – QYLD ETF returns (globalxetfs.com)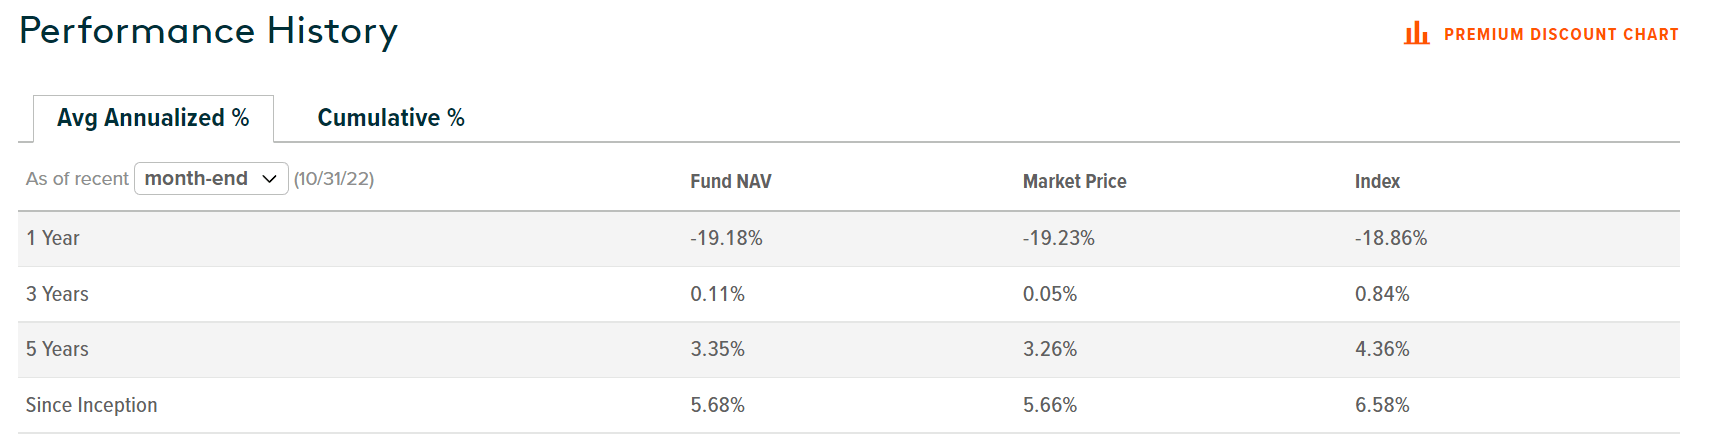
Figure 5 shows the returns of the Invesco QQQ ETF (QQQ), a popular ETF that is based on the same underlying Nasdaq 100 Index. Note that QYLD has massively underperformed the QQQ on longer term timeframes, with 3 and 5 Yr annual return underperformance of 12.8% and 10.2% respectively.
Figure 5 – QQQ ETF returns (invesco.com)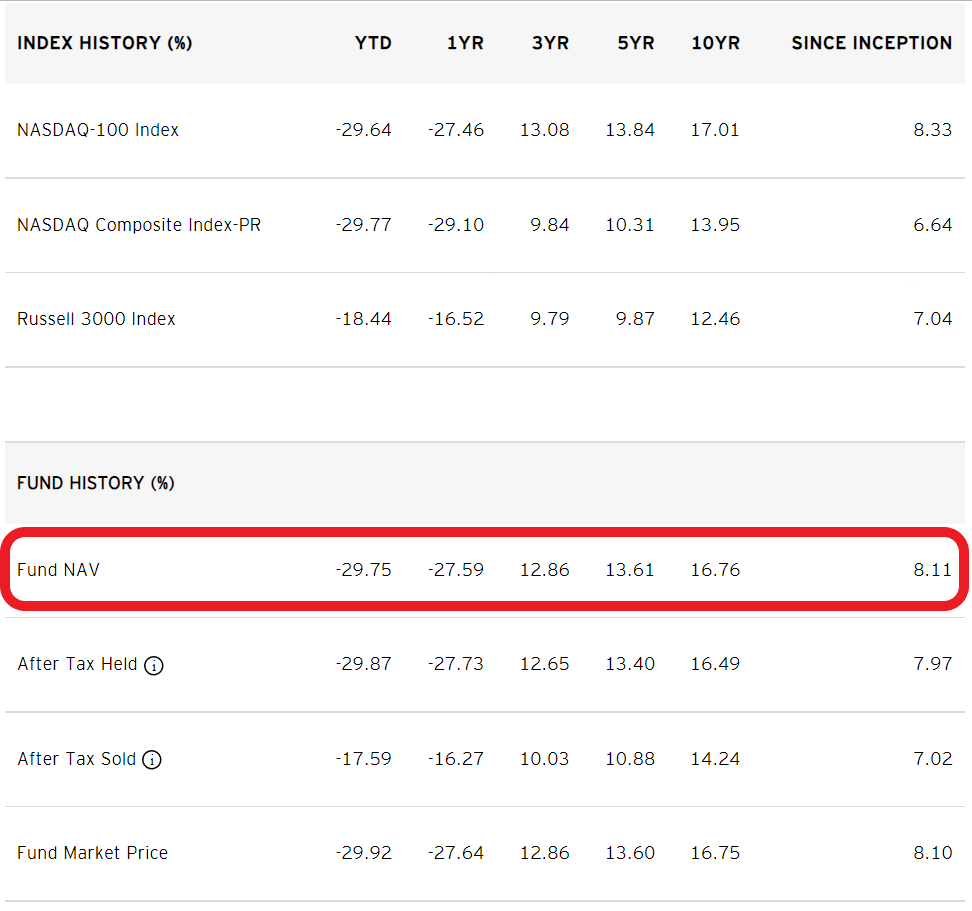
Distribution & Yield
The QYLD has been able to pay a very high distribution yield of 15.7% on a trailing 12 month basis, which is the main selling point of the QYLD ETF (Figure 6). QYLD’s distribution is paid monthly, although the amount is not set.
Figure 6 – QYLD distribution yield (Seeking Alpha)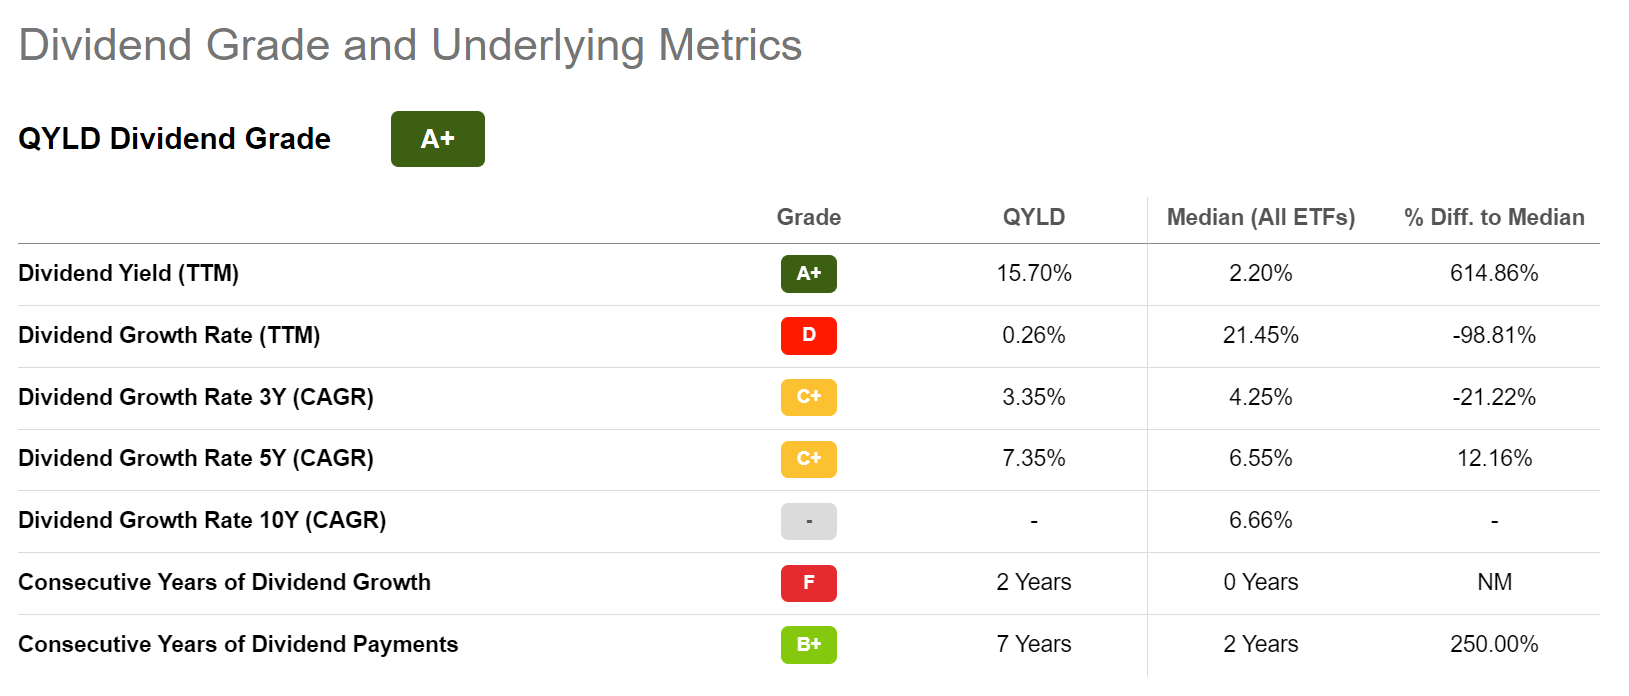
Fees
QYLD charges a 0.60% expense ratio vs. the QQQ, which charges a 0.20% expense ratio.
Tradeoff Upside For Premiums Exercised To The Extreme
I have written about the tradeoff between fund upside vs. income for funds that employ call writing strategies, for example, the BlackRock Enhanced Equity Dividend Trust (NYSE:BDJ). What is different about the QYLD ETF (and its sibling funds) is that it takes the tradeoff to an extreme level, by selling ATM calls.
The benefit of ATM calls is that the premium received from selling the option is higher, as shown in Figure 1. However, the downside is that if the Nasdaq 100 Index’s return is positive at expiry, QYLD will owe the dealer the difference between the index level at month end and the strike price. (Note: the options are not ‘called away’ in the traditional sense as the QYLD trades index options, which are cash settled at expiry, as per Figure 2). Sometimes, this settlement could be greater than the premiums received.
For example, imagine the Nasdaq 100 Index level was 11,600 at the beginning of the month. The QYLD ETF can sell a 1-month ATM call at 11,600 strike. Assume the premium received is 2% of the notional, or $232. If the Nasdaq 100 Index ends the month at less than 11,600, QYLD keeps the full premium. If the index ends the month at say 11,900 (2.59% gain), then at expiry, QYLD will owe the dealer the difference of $300, which is more than the premium received. (Note: this is a simplified example, actual index options also have a $ multiplier)
That is why despite monthly premiums received of between 2% to 4% notional, the QYLD only pays a portion of the premium to unitholders, as it must hold back premiums to smooth out cash flows (Figure 7).
Figure 7 – QYLD premium received vs. distributions paid (globalxetfs.com)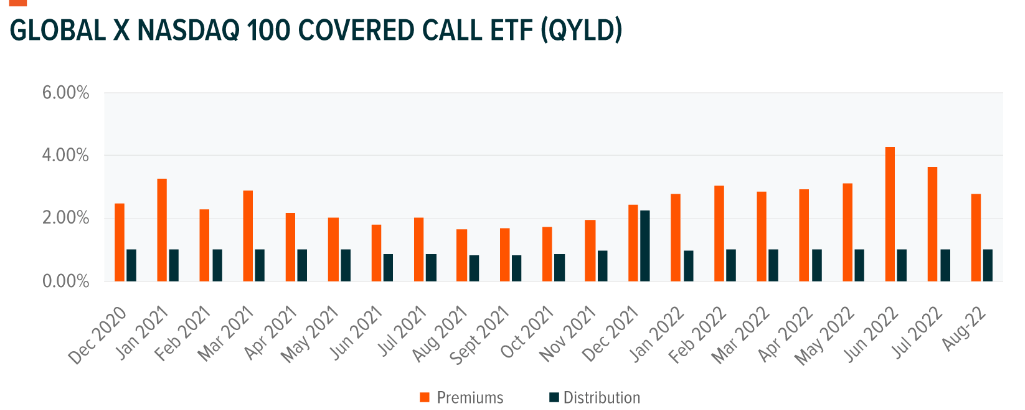
Historical Odds Are Not In QYLD’s Favour
Every month, there are two cases where QYLD investors would lose. First, if the Nasdaq 100 Index falls more than the premiums received, then total-return wise, the investor would lose money. Alternatively, if the Nasdaq 100 Index rallies more than the premiums received, investors also end up losing, as the fund has to cash settle the difference between the month end index level and the option strike (like in the example above).
Historically, there have been 445 monthly observations of Nasdaq 100 returns since the index was incepted in 1985. The Nasdaq 100 Index has returned more than 3% or less than -3% in 266 observations, or 60% of the time. Even if we are generous and assumes the QYLD strategy can sell ATM options for 3% premium per month, based on historical observations, there is a 60% probability that the fund will lose money (Figure 8).
Figure 8 – Historical Nasdaq 100 Index monthly returns (Author created with data from investing.com)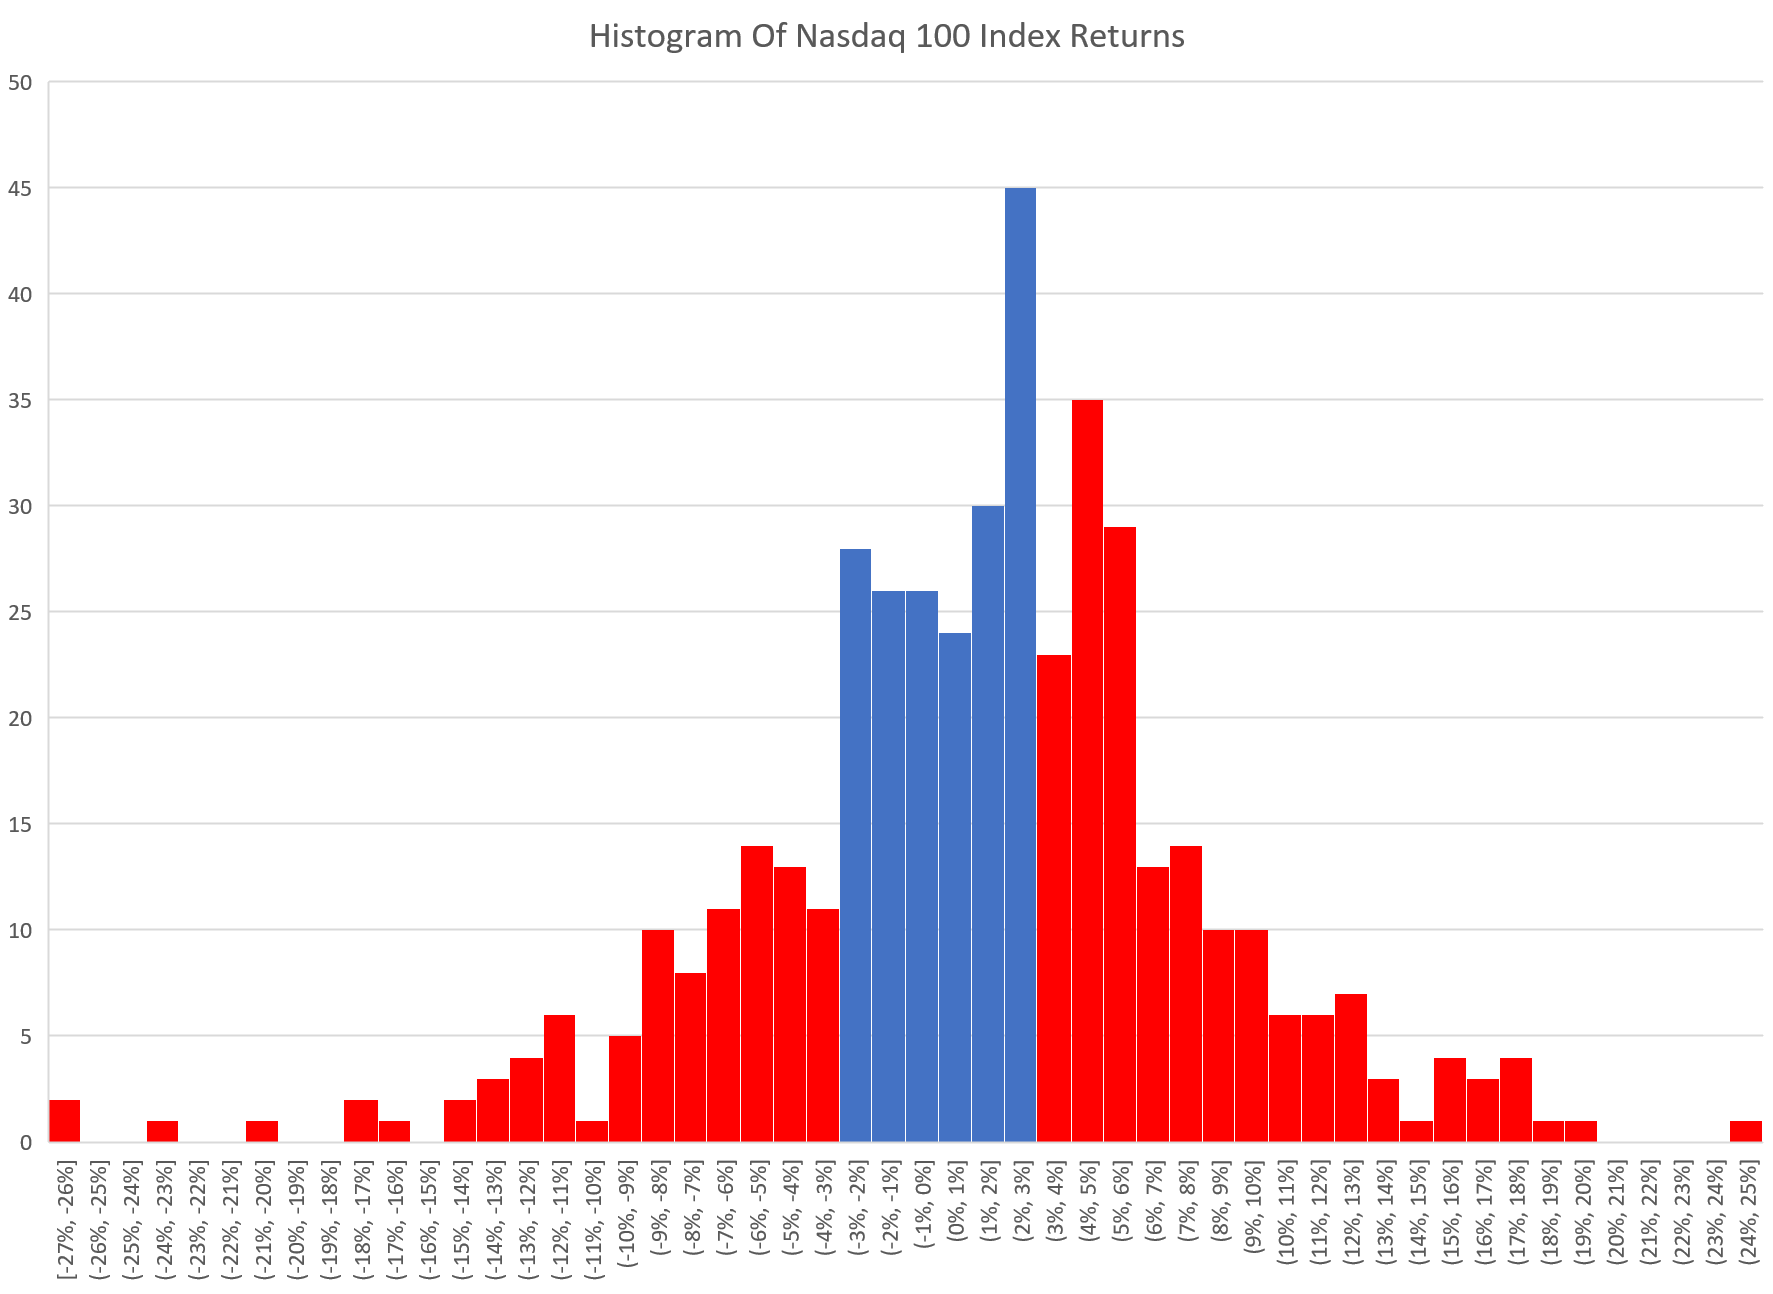
More Downside Than Upside
Another way to think about the upside/premium tradeoff is to look at QYLD’s upside vs. downside capture. From March 2, 2020 to December 31, 2021, QYLD returned 27.6% vs. QQQ’s return of 93.4%, so QYLD captured only 29.6% of the upside of the underlying index during a bull market (Figure 9).
Figure 9 – QYLD captured 30% of upside during bull market (Seeking Alpha)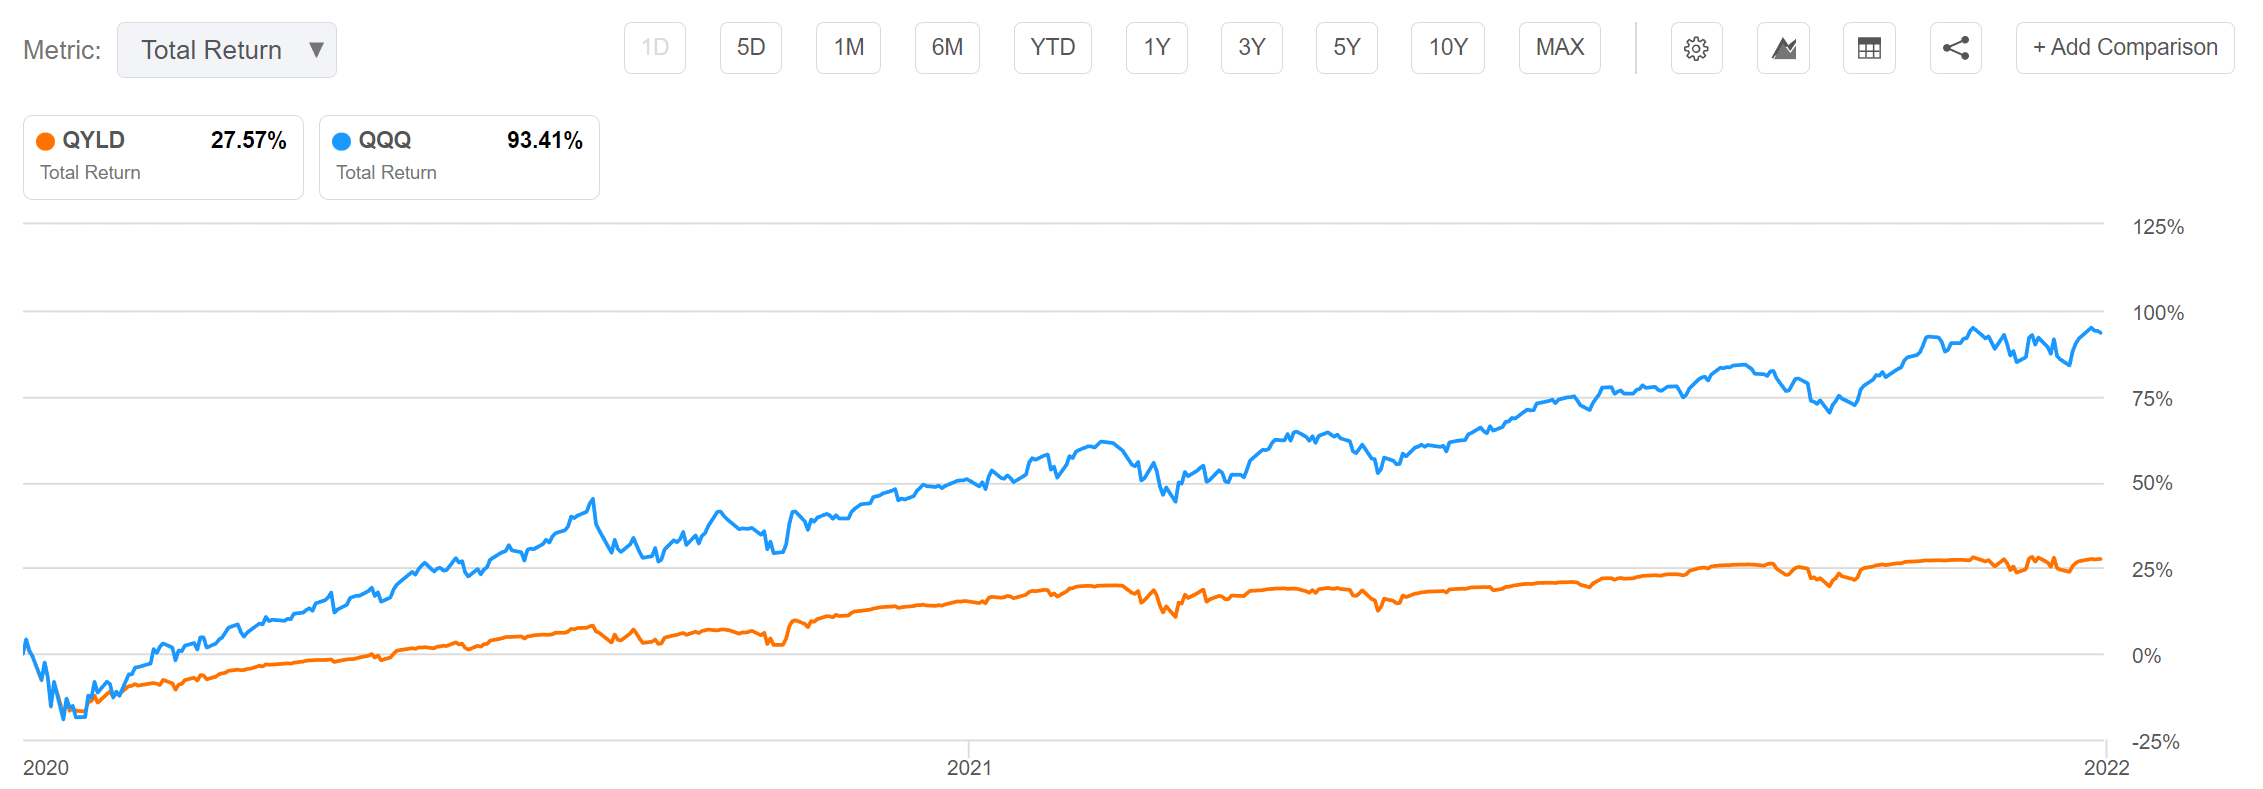
On the other hand, from December 31, 2021 to November 18, 2022, QYLD has returned -18.1% vs. -28.1% for QQQ, or 64.4% capture of the downside (Figure 10).
Figure 10 – QYLD captured 64% of downside (Seeking Alpha)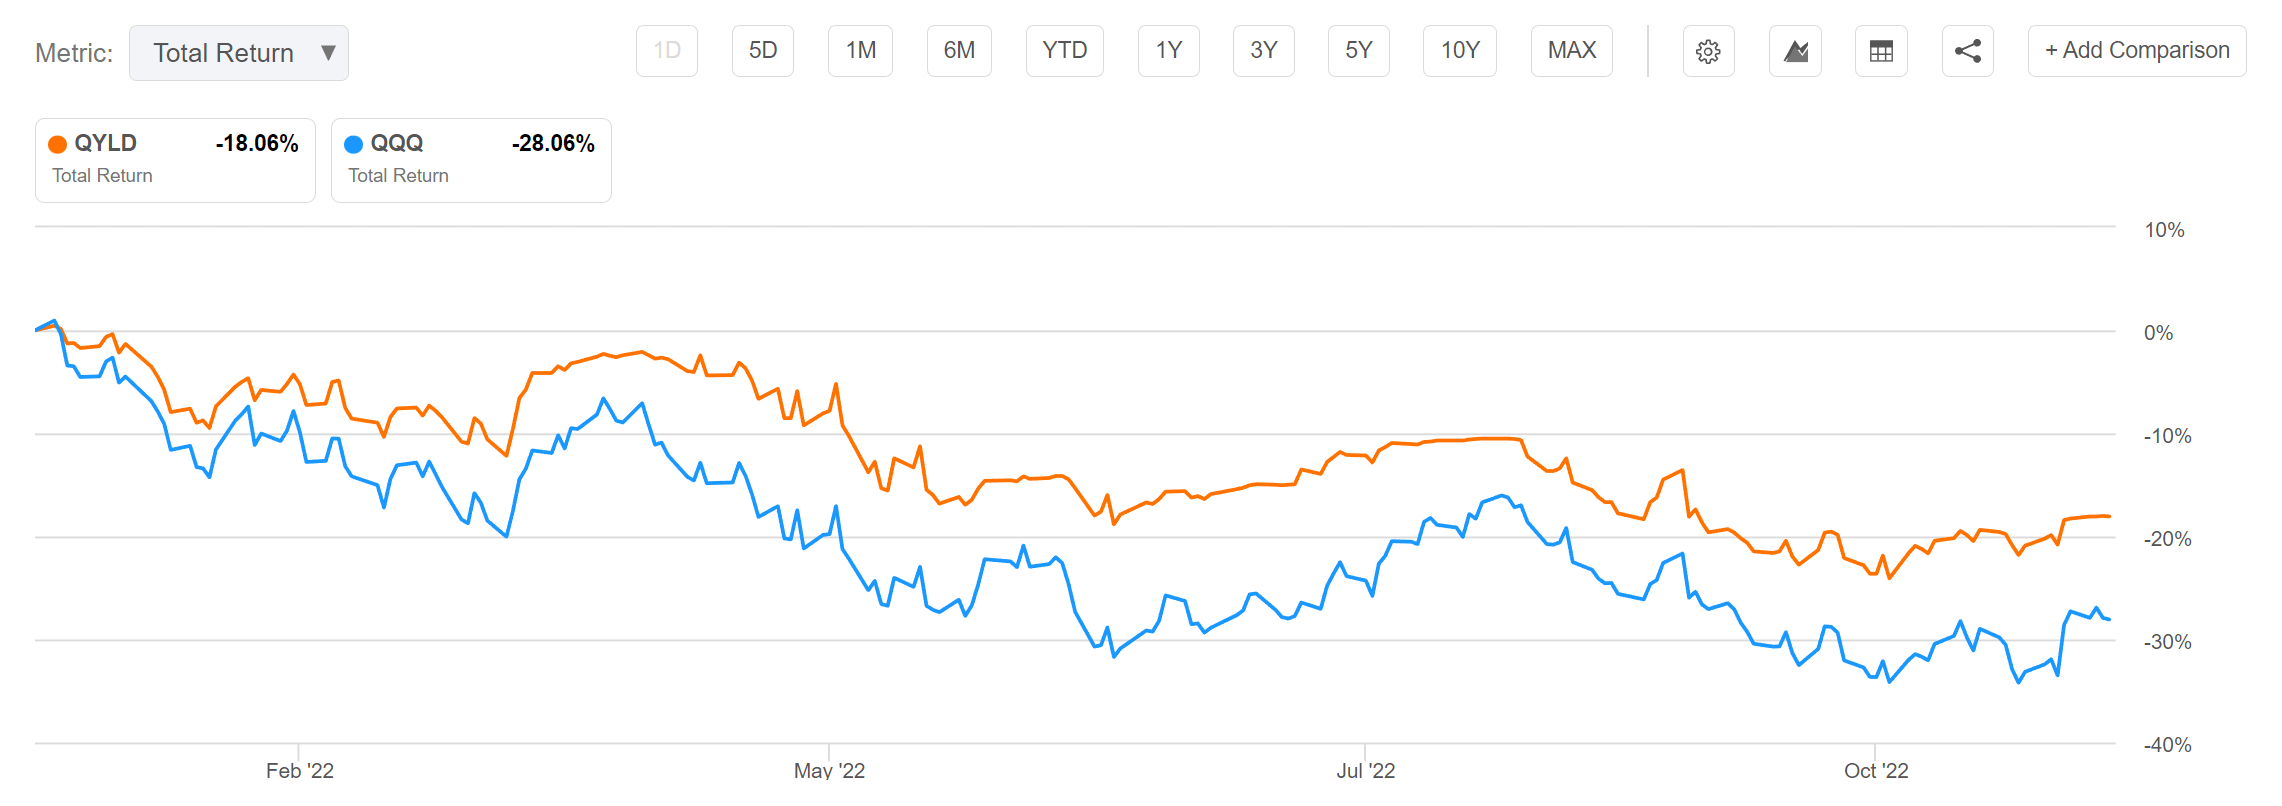
QYLD has captured more than twice as much of the index’s downside as its upside, which is a poor risk/reward.
Conclusion
While QYLD’s 15.7% looks attractive, investors need to be aware of the massive tradeoff between upside vs. income they are making. Judging from recent history, the QYLD has only delivered 30% of the upside of the Nasdaq 100 Index during the 2020-2021 bull market, while it has delivered more than 64% of the downside of the of the 2022 bear market. I believe this is a poor risk/reward bet.
Be the first to comment