

gesrey
Investment Thesis
There are over two dozen U.S. equity ETFs with the word “quality” in the title. The BTC iShares MSCI USA Quality Factor ETF (BATS:QUAL) is by far the most popular, with over $20 billion in assets under management and a reasonable 0.15% expense ratio. Next is the Invesco S&P 500 Quality ETF (NYSEARCA:SPHQ), with over $3 billion in assets under management and the same 0.15% expense ratio. This article aims to compare the two ETFs and decide which one is most attractive today. I believe that SPHQ is the better buy based on its constituents’ lower valuation, superior analyst sentiment, and better overall fit with the S&P 500 Index I own. This article will discuss these points individually, and I hope to answer any questions in the comments afterward.
ETF Overview
QUAL Strategy and Top Holdings
According to iShares, the primary reason to invest in QUAL is to gain exposure to large- and mid-cap U.S. stocks with high returns on equity, stable year-over-year earnings growth, and low financial leverage. By following an index-based approach, investors gain access to a specific factor that, historically, has driven a large part of companies’ return and risk.
The specific Index is the MSCI USA Sector Neutral Quality Index, which QUAL began tracking in September 2015. Sector neutral means that sector exposures will only minimally differ from the parent Index. The following Index performance graph supports the concept that sector exposures are more important than security selections within a sector. The Index’s annual returns rarely deviated from the MSCI USA Index by more than a few points.
MSCI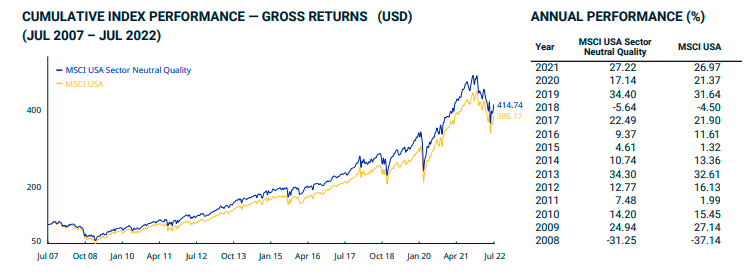
The annual returns reveal when the market favors the quality factor. Investors turn to quality stocks in risk-off years like 2008 and ignore the factor in optimistic years like 2009 and 2020. Through July 2022, the Index gained an annualized 13.02% vs. 13.75% for the broader market.
QUAL’s top ten holdings total 32.04% and are all household names, including S&P Global (SPGI), Apple (AAPL), and NIKE (NKE). Alphabet (GOOG, GOOGL) and its two share classes total 3.63%, making it the third-largest holding.
iShares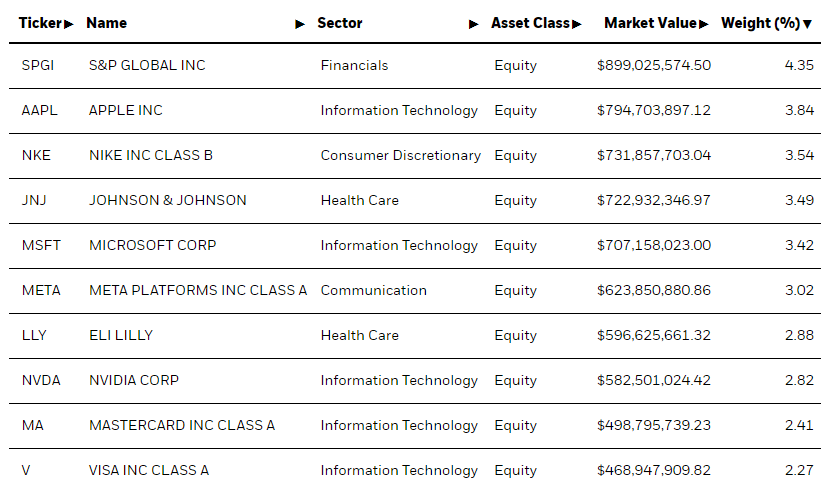
SPHQ Strategy and Top Holdings
SPHQ tracks the S&P 500 Quality Index, rebalancing semi-annually in June and December to select 100 S&P 500 constituents by quality scores. Like QUAL, return on equity and low financial leverage help identify quality stocks. However, SPHQ’s Index looks for companies with low accruals ratios instead of stable year-over-year earnings growth. The accruals ratio measures a company’s change in net operating assets over the previous year divided by its average operating assets over the last two years. If this ratio is low, it’s easier to predict future earnings.
SPHQ’s top ten holdings total 42.18%, indicating it’s less diversified than QUAL. Its principal holdings are Apple, Microsoft (MSFT), and Visa (V), plus Energy names Exxon Mobil (XOM) and Chevron (CVX). According to the ETF Research Center, SPHQ has only a 38% overlap by weight with QUAL, which is surprising given the similarities in their strategies.
Invesco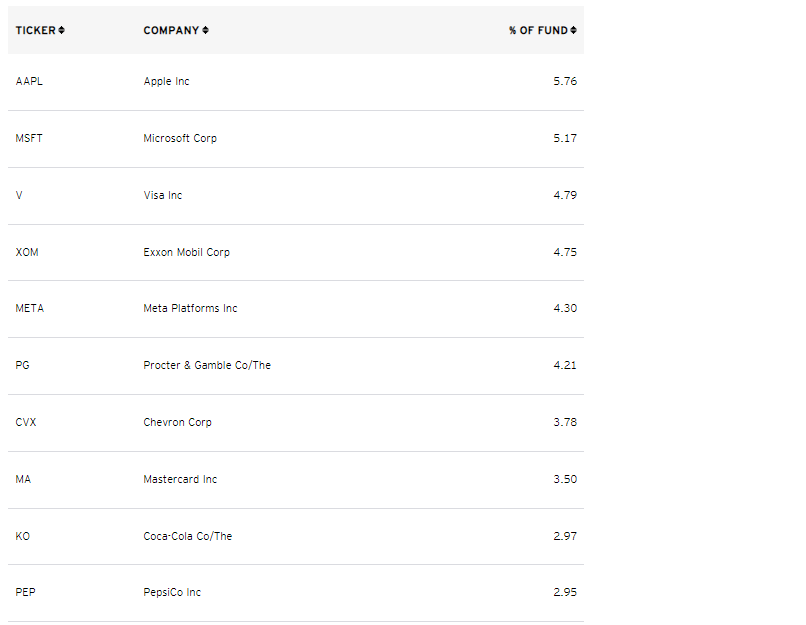
Sector Exposures Comparison
Morningstar provides sector exposures utilizing Global Industry Classification Standards, or GICS. I use it because ETF providers sometimes use competing systems that result in an apples-to-oranges comparison. The following table summarizes QUAL and SPHQ’s sector exposures alongside those of the SPDR S&P 500 ETF (SPY). The key takeaway is that SPHQ overweights Consumer Staples, Energy, and Technology relative to QUAL and underweights Consumer Discretionary, Health Care, and Communication Services.
Morningstar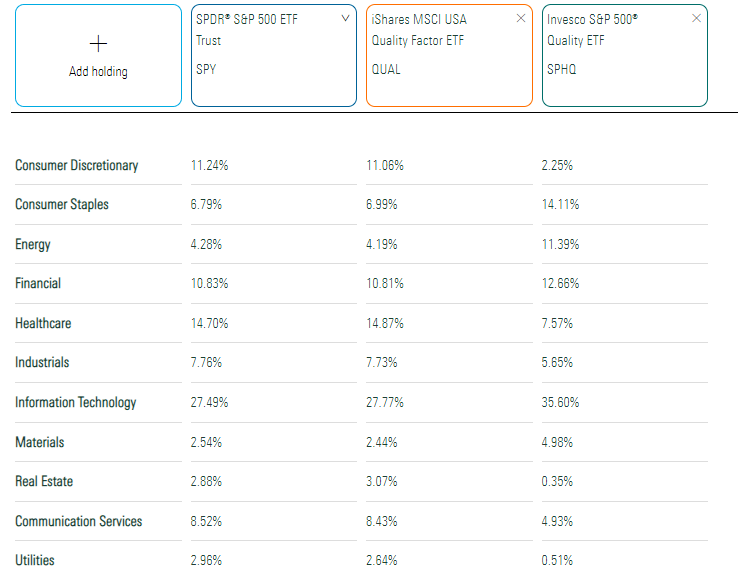
QUAL’s sector-neutral stance is also reflected in the above table. Its sector exposures are nearly identical to SPY. Therefore, it’s reasonable to infer that any performance difference demonstrates the value of the quality factor, as applied by MSCI. The first chart presented didn’t look like the factor had any value, and an evaluation of QUAL’s performance since its inception provides further confirmation. Let’s look at that next.
Performance Analysis
QUAL vs. SPY
Since its June 2013 inception, QUAL has slightly outperformed SPY by 0.05% per year with higher volatility that leads to worse risk-adjusted returns (Sharpe and Sortino Ratios). As the graph highlights, most of this was in a bull market, and QUAL notably had a higher maximum drawdown.
Portfolio Visualizer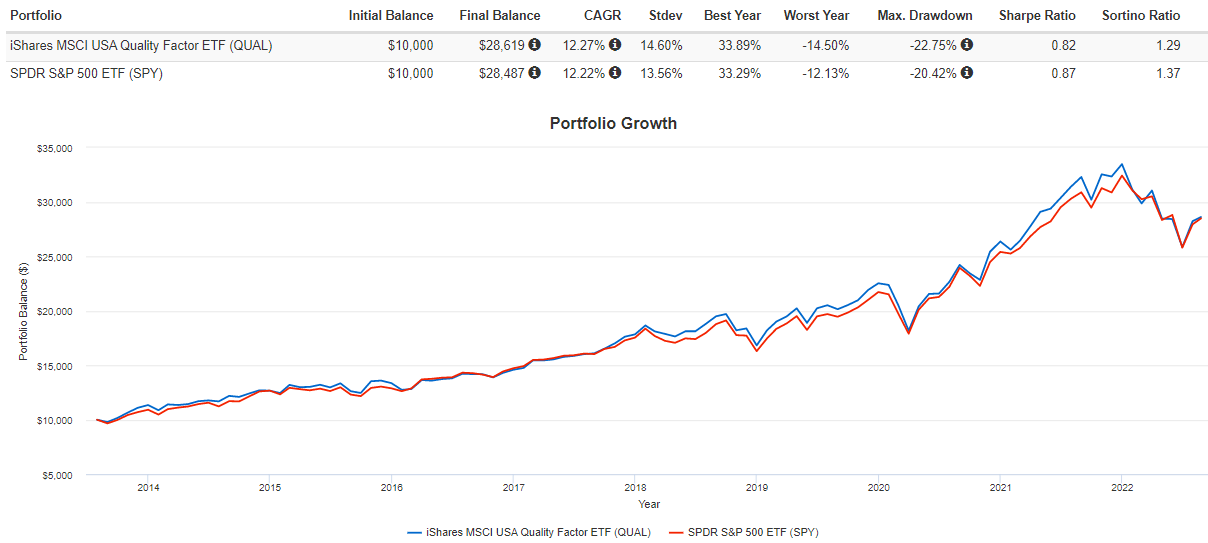
In Q1 2020, QUAL lost 19.23% compared to 17.60% for SPY. Also, in the first half of this year, QUAL declined by 22.75% against 20.42% for SPY. Given the virtually identical sector composition, we can infer that the quality factor does not provide downside protection. It may even serve to reduce returns. One possible reason is that no valuation screen is applied to the Index, nor are there any controls for expected volatility.
Long-term historical data supports the concept of low P/E stocks outperforming in drawdowns, and we even have some recent evidence in the ETF space. Consider the following graph comparing QUAL with the XTrackers Russell 1000 US QARP ETF (QARP), which includes a valuation screen.
Portfolio Visualizer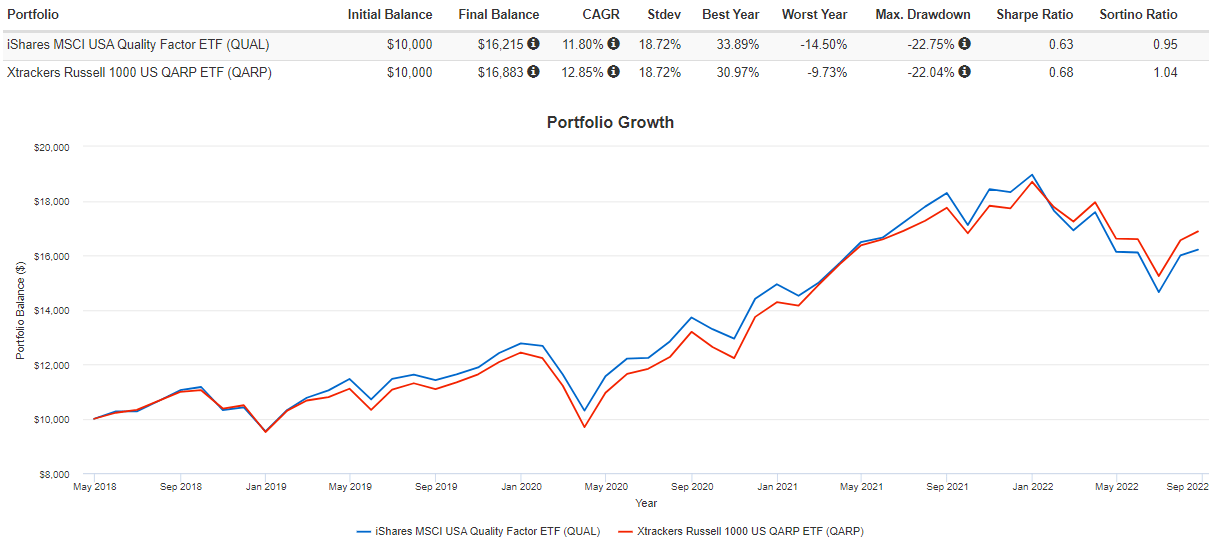
With QARP, we see an improvement in risk-adjusted returns and a 4.26% outperformance in the first six months this year. However, it failed to outperform in Q1 2020, perhaps because of the sudden shift in market sentiment and lower exposure to Technology stocks.
SPHQ vs. SPY vs. QUAL
SPHQ has a much longer history, so its performance history is much more helpful to long-term investors. Since November 2005, SPHQ has underperformed by 1.42% per year. On a $10,000 investment, that amounts to a $9,134 miss and is further evidence that the quality factor, as applied here, hasn’t worked.
Portfolio Visualizer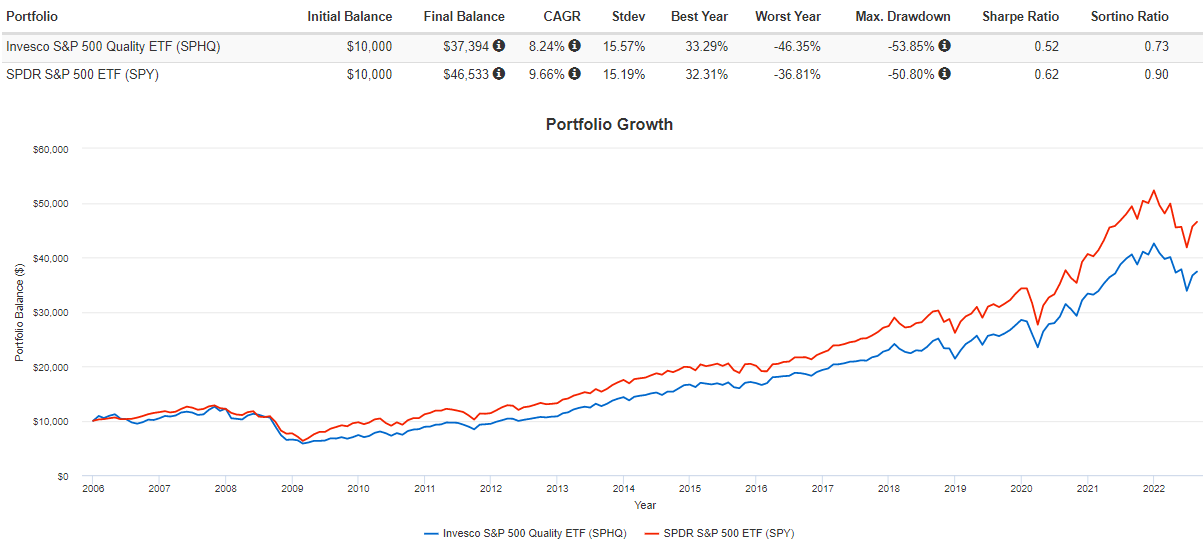
We saw SPHQ experience a larger 53.85% drawdown from November 2007 to February 2009 compared to 50.80% for SPY. Importantly, it took 53 months for SPHQ to recover that loss compared to 37 months for SPY. Finally, we can see that SPHQ and QUAL produced nearly identical returns since QUAL’s inception in 2013, but SPHQ had the lowest total volatility and the best downside risk-adjusted returns (Sortino Ratio).
Portfolio Visualizer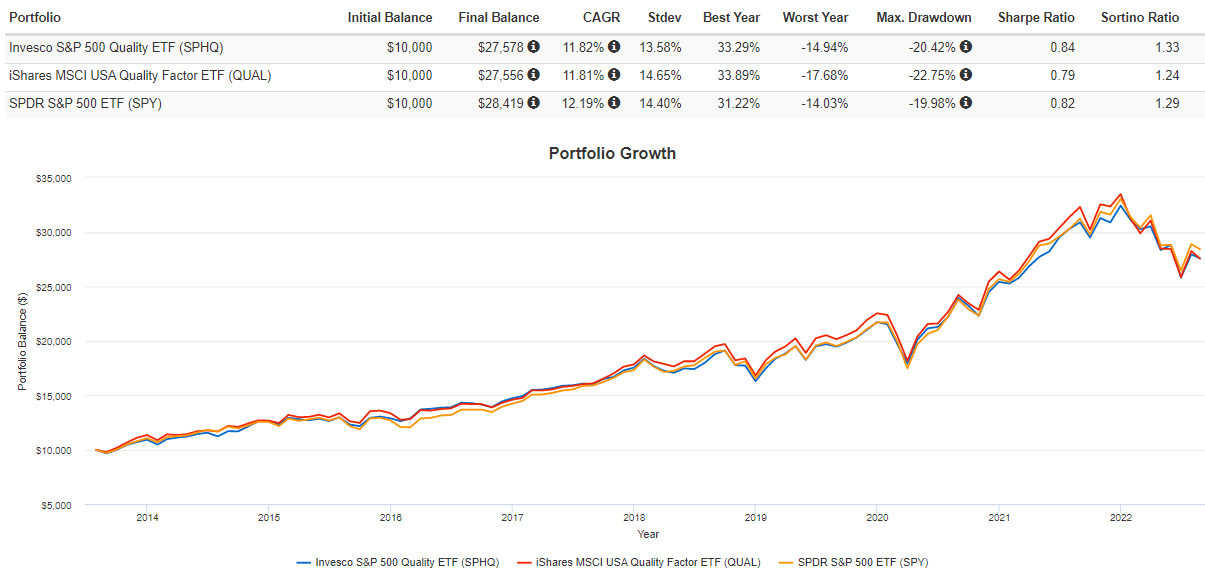
Fundamental Analysis
Assessing Diversification
It is essential to look beyond an ETF’s concentration in its top 10 or 20 assets. I believe sector and industry diversification is far more critical because macro effects are often more potent than micro ones. For example, if an entire sector is out of favor, even the best-performing ones probably won’t perform well. Furthermore, the odds that an Index or active manager could separate those stocks in advance is small. That’s why QUAL tracks SPY so well. In short, if you want a different set of risks and returns than what the market offers, start with sector and industry diversification differences and pay less attention to an ETF’s top holdings.
From this perspective, SPHQ stands out. SPHQ, QUAL, and SPY’s top three sectors total 61.93%, 52.69%, and 53.24%, respectively. We see even greater divides when we look at diversification from an industry level. SPHQ holds 81.02% in its top 20 industries compared to 73.83% and 60.98% for QUAL and SPY. Furthermore, its industry exposures are most unique. Below are the top five industries SPHQ overweights relative to QUAL.
- Integrated Oil & Gas: 9.63% vs. 0.00% = 9.63%
- Data Processing & Outsourced Services: 10.64% vs. 5.95% = 4.70%
- Household Products: 4.24% vs. 0.18% = 4.06%
- Soft Drinks: 5.97% vs. 2.64% = 3.34%
- Regional Banks: 2.84% vs. 0.00% = 2.84%
I favor increased exposure to oil stocks like Exxon Mobil and Chevron. Total exposure is near what I think it should be, as QUAL nor SPY offers any significant exposure, making it more susceptible to a stock market downturn caused by prolonged high inflation. SPHQ is also overweight stocks like Visa (V), Procter & Gamble (PG), and Coca-Cola (KO), all of which with I’m comfortable in the long run.
On the other hand, QUAL overweights the following five industries:
- Pharmaceuticals: 10.63% vs. 0.93% = 9.70%
- Financial Exchanges & Data: 6.85% vs. 2.77% = 4.08%
- Footwear: 3.55% vs. 0.00% = 3.55%
- Asset Management & Custody Banks: 3.84% vs. 0.91% = 2.93%
- Interactive Media & Services: 6.66% vs. 4.26% = 2.40%
This list is interesting because it essentially shows what the Index was “forced” to choose due to its sector-neutral strategy, given the similarities for security selection. The implication is that Pharmaceutical stocks, led by Johnson & Johnson (JNJ) and Eli Lilly (LLY), are not of sufficient quality. Given their strong profitability, I wouldn’t go that far, but Seeking Alpha’s other Quant Ratings for QUAL’s stocks in the industry suggest poor value and growth potential. Furthermore, the EPS Revisions Grades highlight analysts’ negative opinions of the industry.
Seeking Alpha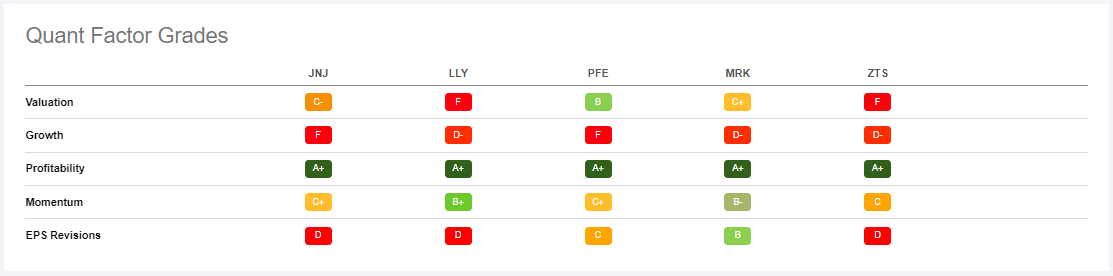
Therefore, I’m more comfortable with SPHQ’s allocations. Furthermore, since I already own an S&P 500 Index ETF, QUAL would hardly enhance diversification for me. I expect this will be true for most readers, too.
SPHQ Has Stronger Fundamentals
The following table highlights the fundamentals for SPHQ’s top 20 holdings, which I believe are superior to QUAL. Also included are summary metrics for SPY, which currently trades at 23.97x forward earnings.
The Sunday Investor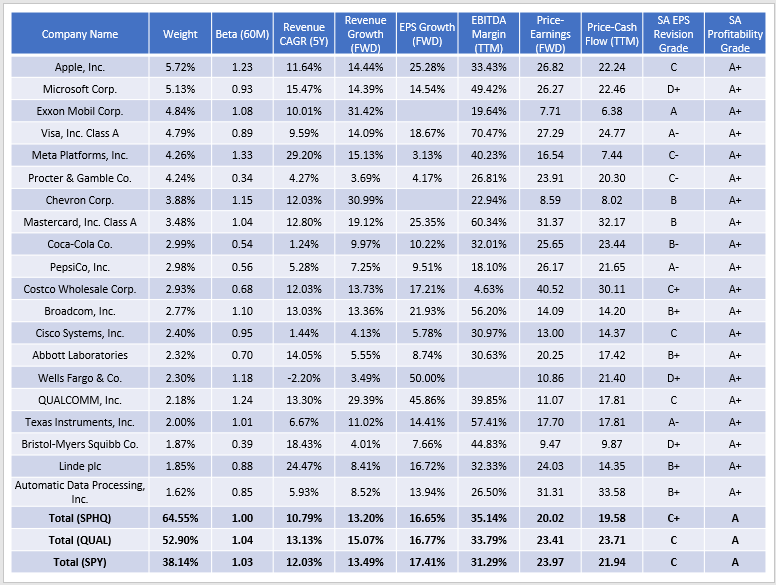
SPHQ trades at 20.02 forward earnings compared to 23.41x for QUAL, despite having a negligible difference in estimated earnings growth and constituent profitability. It still has high exposure to Apple and Microsoft, but these are more mature Tech companies and aren’t trading at excessive valuations compared to others in the QUAL, like NVIDIA (NVDA).
All three ETFs have the same weighted-average “A” Profitability Grade, but SPHQ has a superior EPS Revisions Grade (C+). Whether warranted or not, I pay attention to what analysts think due to their influence over markets. As shown above, the oil giants score well, as do Visa, Mastercard (MA), Coca-Cola, and PepsiCo (PEP). Not coincidentally, all are beating the S&P 500 YTD.
Seeking Alpha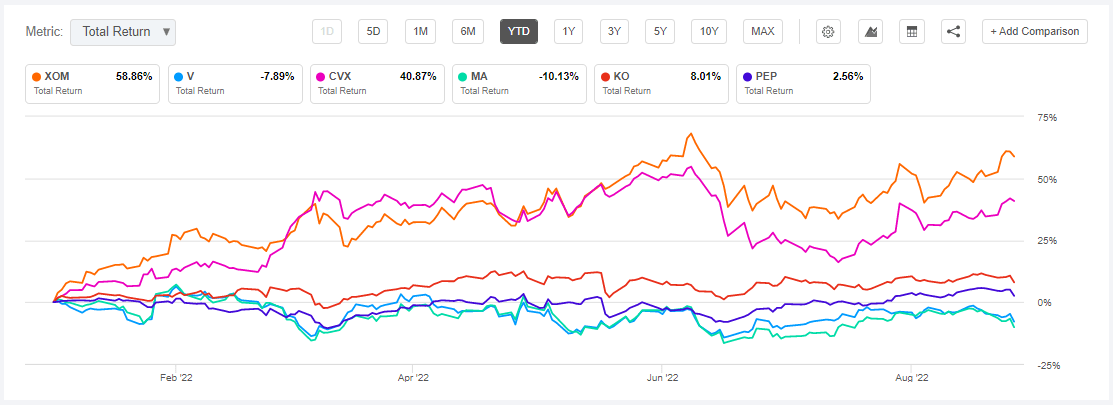
Investment Recommendation
Neither QUAL nor SPHQ has a better track record than SPY, which suggests that “quality at any price” isn’t a strategy one should follow. I think adding a valuation screen would improve results and make the ETFs more attractive to those wanting some downside protection. Since both focus only on earnings and financial leverage, neither is suitable for me. However, if I had to choose one, it would be SPHQ. It trades a few points cheaper than QUAL on a forward earnings basis, has a stronger EPS Revisions Grade, and improves diversification if complemented with SPY. That’s my recommendation today despite its shaky history, and I look forward to answering any questions below. Thank you for reading.
Be the first to comment