


tunart
The S&P 500’s thrust off its June 16 low caught many investors flat-footed. Just as pundits were calling for further downside to the low to mid-3000s, stocks staged a strong rally. The advance, tracking at more than 13%, is one of the best moves since the onset of the bear market in early January. Gains have been even more pronounced among the Information Technology and Consumer Discretionary sectors. Those two high-duration areas have benefited from a drop in Treasury rates over the past eight weeks. The Invesco Nasdaq 100 ETF (NASDAQ:QQQM) is up nearly 20% on a total return closing basis from its 2022 low.
S&P 500 ETF (SPY) and Invesco Nasdaq 100 ETF (QQQM) Since June 16
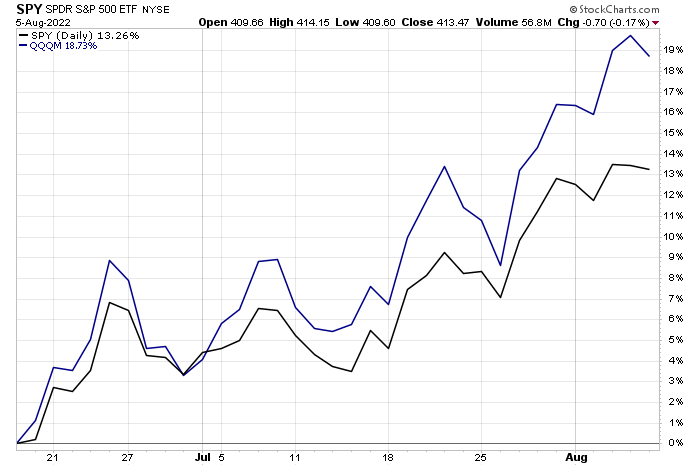
Stockcharts.com
Over the last month, the Fed has arguably pivoted slightly with its interest rate policy. While Chair Powell’s words at the July FOMC press conference were somewhat hawkish at times, the general market reaction was favorable within both the equity and fixed income markets. Of course, last Friday’s hot jobs report sent Fed Funds futures pricing higher. Traders now expect the EFFR to be near 3.6% by early next year.
Fed Funds Futures Higher Post-NFP, But Tech Stocks Rally Still
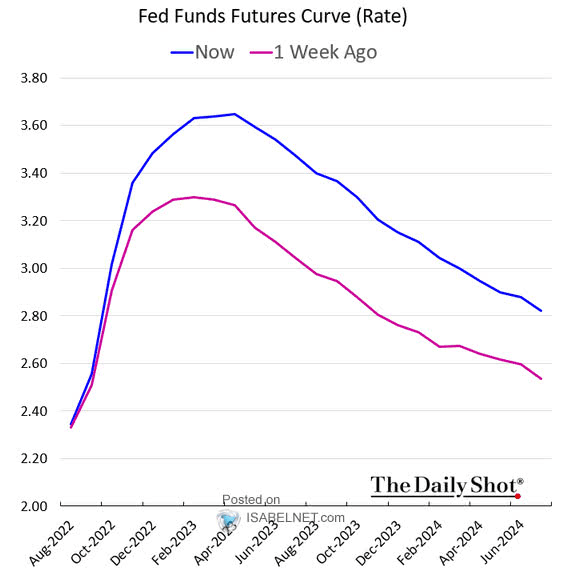
Isabel.net, WSJ Daily Shot
You can see just how strong mega-cap tech and consumer stocks have been on the one-month performance heat map. Investors are once again pouring money into the market’s generals.
S&P 500 One-Month Performance Heat Map: TMT Leads
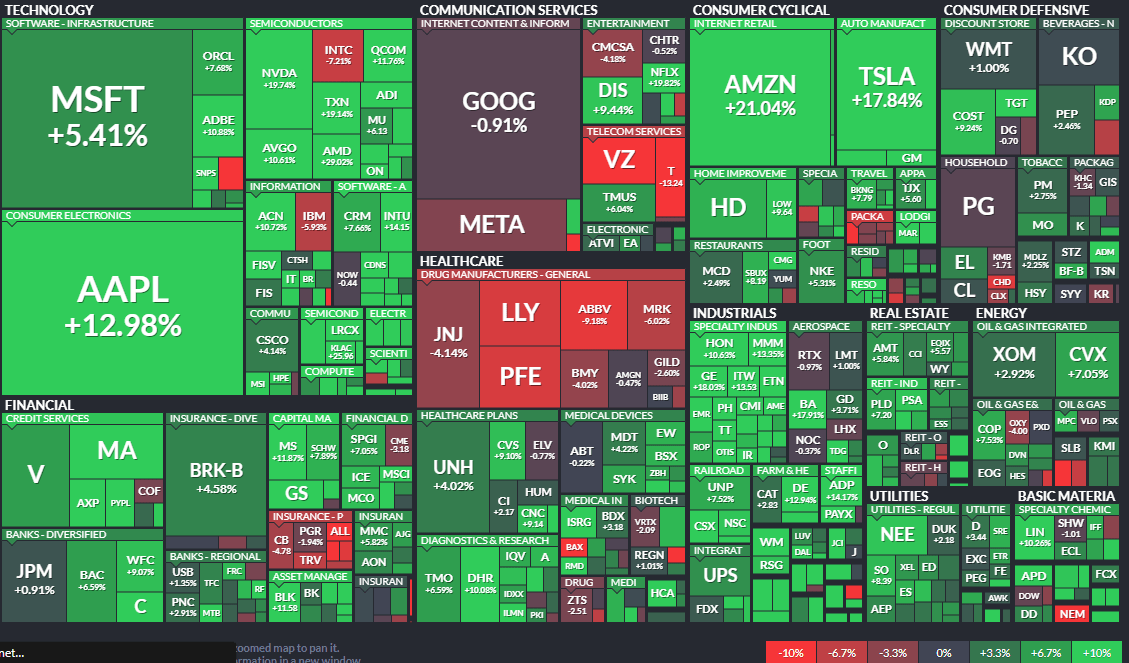
Finviz
An ideal way retail investors can play this theme is to use a lower-cost version of the popular Nasdaq 100 ETF (QQQ). Many market participants might not be aware of this alternative.
According to the issuer’s website, the Invesco NASDAQ 100 ETF (QQQM) is based on the NASDAQ-100 Index. The Fund will invest at least 90% of its total assets in the securities that comprise the Index. The Index includes securities of 100 of the largest domestic and international nonfinancial companies listed on Nasdaq. The fund is rebalanced quarterly and reconstituted annually.
QQQM has a 30-day SEC yield of 0.69%, sports a typical bid/ask spread of just 0.02%, and features an expense ratio of just 15 basis points. With 104 total holdings, its P/E ratio is higher than that of the market at 19.71 as of June 30, 2022.
The ETF is more than half allocated to the Info Tech sector. Discretionary and Communication Services are each about 16% of QQQM. The top individual holdings are some of the largest U.S. companies.
QQQM Portfolio: TMT Heavy, High Duration
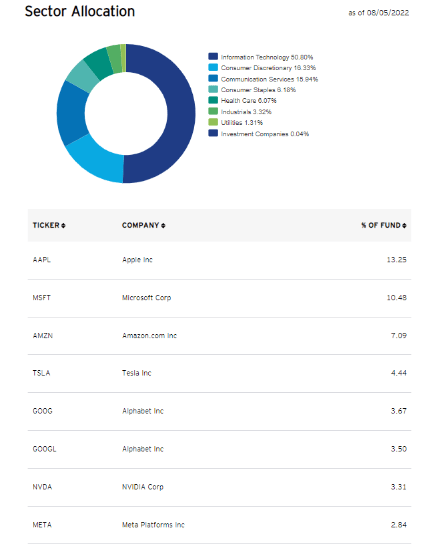
Invesco
The Technical Take
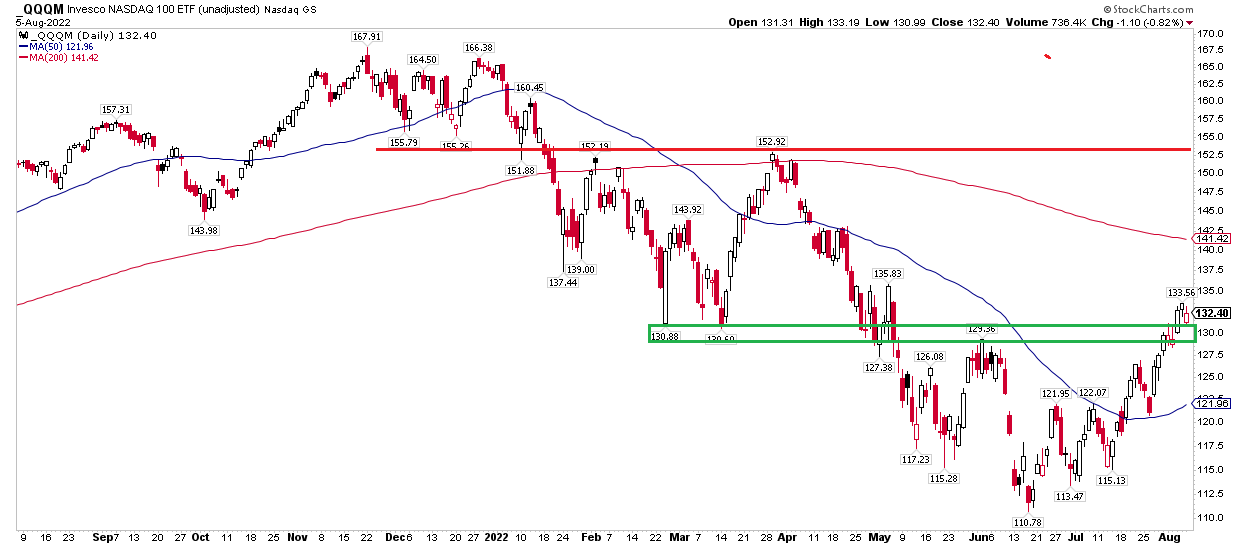
The Nasdaq 100 ETF is probing above a key level. Right now, it appears to be breaking out after basing with a bullish rounded bottom from May through July. This is a key chart technicians watch to call for a definitive bottom in stocks. If QQQM can hold the $129-$130 area, that bodes well for a continued second-half rally.
The bears can cling to a still-declining 200-day moving average – indicative of an established downtrend. The 50-day, however, has turned positively sloped. We are still in a battleground but might know more very soon. I see the next resistance level in the $152-$156 area.
This morning, a bearish pre-announcement from Nvidia (NVDA) sent QQQM from $133.50 in the premarket to $132.60 – for short-term traders, $134 is resistance this week.
QQQM: Bullish Rounded Bottom, Breaking Out Above Resistance
Stockcharts.com
The Bottom Line
Investors seeking Nasdaq 100 exposure should look to QQQM (vs QQQ) as it is inexpensive and highly liquid. It is a great way to play momentum in the TMT space. Price has climbed above important resistance after eight straight days of intraday buying (as evidenced by white candles on the daily chart). I see higher prices ahead so long as $129 holds.
Be the first to comment