


Diego Thomazini/iStock via Getty Images
How Are QQQ And TQQQ Different, And What Type Of Investors Are They Suitable For?
The Invesco QQQ ETF (NASDAQ:QQQ) is an investment vehicle that is structured as a unit investment trust and offers unleveraged exposure to the Nasdaq-100; for the uninitiated, the Nasdaq-100 is a modified market-cap-weighted index that focuses on the 100 largest non-financial stocks, with a particular predilection towards tech and communication services stocks (over two-thirds of the index).
QQQ’s utilitarian qualities work well for different kinds of market participants. With annual operating expenses of only 0.2% (as a percent of average net assets), it won’t burn a hole in the pockets of the archetypal buy-and-hold investor who may be looking to build wealth through some of the most elite growth stocks around. QQQ’s popularity amongst long-term investors is reflected in an enormous AUM of well over $150bn, which would put it in the league of the top-5 largest ETFs by AUM.
At the other end of the spectrum, if your time horizon is more akin to that of a day trader, or a participant who makes quick tactical bets both on the long side or the short side (as an aside, QQQ’s short-interest currently stands at a rather elevated 13.45%, highlighting how popular it is amongst those who are looking to profit from its weakness as well) even then, QQQ comes across as a fine vehicle to explore your thesis; spreads in the QQQ counter are remarkably low at only $0.02, and this is also reflected in inordinately high daily trading dollar volumes of nearly $22bn; that figure would put QQQ only behind the SPY ETF in terms of daily volumes ($37bn) if you consider the entire ETF universe!
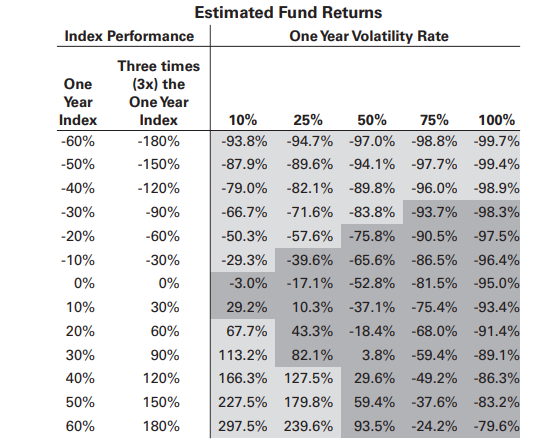
The ProShares UltraPro QQQ ETF (NASDAQ:TQQQ) is an entirely different beast, primarily because it is a highly levered play on the Nasdaq-100; in other words, you’re looking at a product that attempts to provide 3x the return of the Nasdaq-100 on any single day. If you’re unfamiliar with this segment, do note that this is not something that will provide 300% of the Nasdaq-100’s return over a certain period; the remit of this product is to deliver those magnified returns on a per-day basis. So, at the end of year one, if the Nasdaq-100 delivers 20%, you should not be expecting TQQQ to deliver a figure of 60%; rather its returns will be the result of every single day’s return, compounded over a year. To reiterate my point, one can see the table below which shows that the annual returns of TQQQ are rarely ever 3x the returns of the Nasdaq-100s annual returns. The same can’t be said of QQQ which is designed to match the performance of the Nasdaq-100 no matter the period in question.

YCharts, ETF Prospectus
TQQQ goes about attempting to deliver 3x the daily returns by not only investing in equities but also derivatives such as swaps and futures contracts which are rebalanced quite frequently; this makes the product less tax and cost-efficient. Indeed, as far as the annual operating expenses are concerned, you’re looking at a rather steep figure of 0.95%, which is almost 5x as much as the passively-managed alternative.
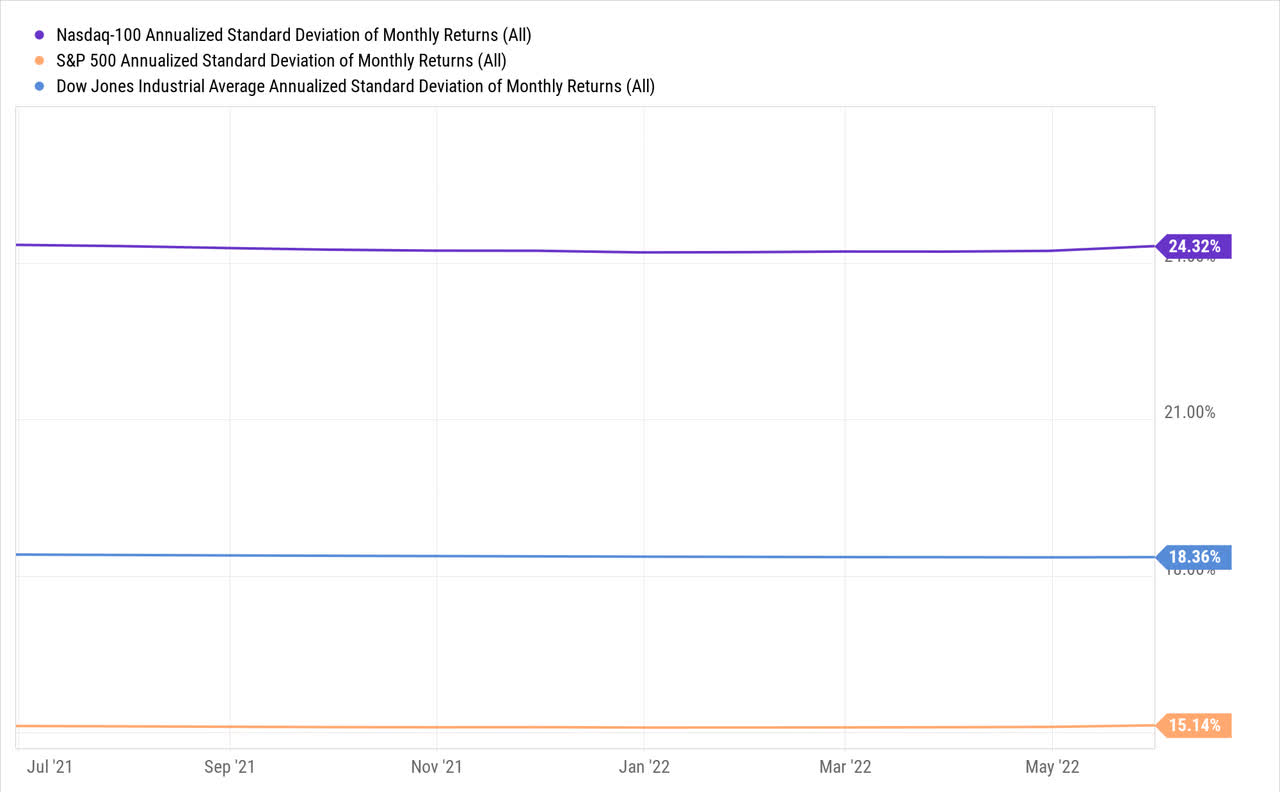
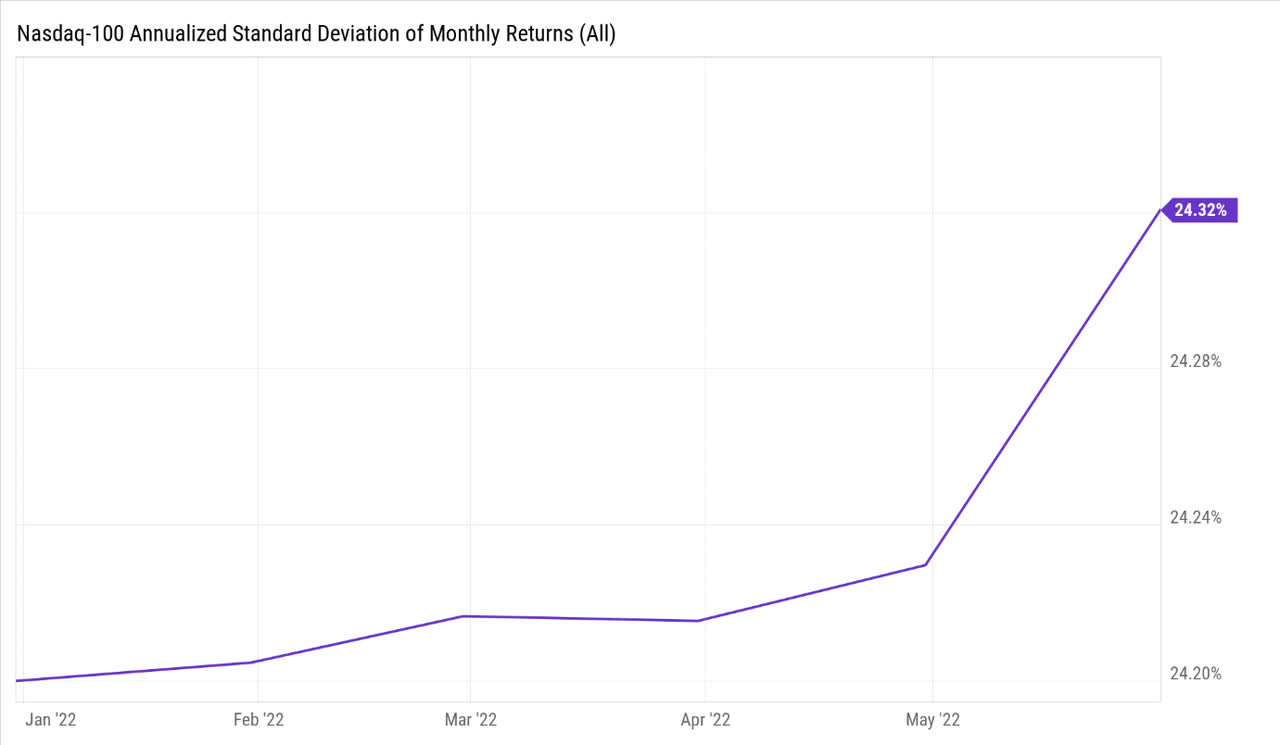
The other point to note is that the Nasdaq-100 is inherently just a rather volatile index. As you can see from the image below, the annualized standard deviation of around 24% is a lot higher than the other two key benchmarks- The S&P500 and the Dow Jones Industrial Average. Why is this relevant? Well, the more volatile a tracking index, the more onerous the rebalancing exercise is, for a levered ETF, particularly one offering 3x exposure (as opposed to just 2x).
YCharts
Crucially, something which can often be overlooked is the impact of volatility on the end returns of this product. Assume one witnesses choppy conditions where the Nasdaq oscillates between the negative and positive zones, ultimately delivering only flat returns in aggregate, over a year. With something like a QQQ, which mirrors the Nasdaq, this won’t be a problem as you’ll hardly experience any wealth destruction, whereas with a TQQQ you’re looking at potentially 17% erosion in your wealth (assuming a 25% annualized volatility rate, which does not look farfetched at all, given the ongoing conditions).
Prospectus
What I’ll also add is that if you happen to go long on TQQQ, and the Nasdaq trends favorably over a certain period, it would be prudent to cash in on a portion of your gains as the compounding effect of this product will only enhance your exposure over time, making you susceptible to drawdowns of huge magnitude, when the trend eventually reverses (at the start of the trend, this risk is less pressing)
Thus, given the daily reset nature of this product, and the heightened leverage involved, I reckon TQQQ should only really be pursued by someone who has a) a day-trading mindset or someone who’s looking to exploit one swing in the market over a short duration, b) the time to keep abreast of the markets on a daily basis, c) the risk appetite, the intellectual muscle, and the capital to cope with leverage risks.
Closing Thoughts- Is QQQ Or TQQQ The Better Buy?
If I had to turn bullish on QQQ, I would be looking for clarity with regards to three key questions-
-
Given the relevance of the relatively heightened cost of capital in discounting the cash flows of the Nasdaq stocks, are there any indications of benchmark rates hitting a ceiling in the foreseeable future?
-
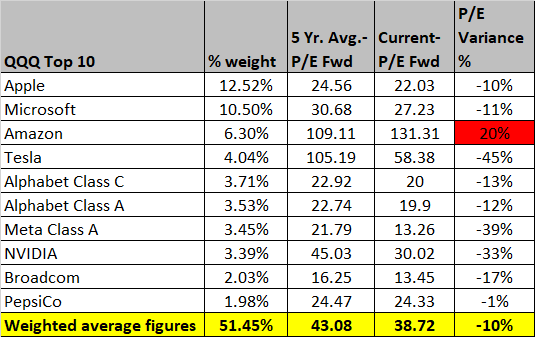
Post the sell-off in 2022, how attractive are the forward valuations, even as forward earnings estimates have recently been trimmed? I would attach more importance to the top-10 stocks of QQQ given their sizeable clout (just these 10 stocks account for 52% of the total portfolio).
-
Are there any signs of a bottom formation on the charts?
With regards to question one, I don’t believe we are anywhere close to peak rates; if anything, expectations keep getting lifted over time. Some believe we could see two separate 75bps hikes over the next two policy meetings in July and September, whilst another school of thought thinks it may not necessarily come to that. Worryingly, the most recent reports suggest that Mr. Powell isn’t ruling out hikes to the tune of 100bps either. All in all, it appears that the interest rate outlook is quite nebulous.
As far as the second question is concerned, it’s fair to say that we can now see some green shoots with the forward valuations, despite a cut in consensus estimates. According to YCharts data, except for Amazon, all the other top 10 stocks are currently trading at a discount to their long-term averages; incidentally, the overall weighted average forward P/E of these top-10 names at 38.7x, represents a 10% discount to the long-term average of 43x. For long periods during 2020 and 2021, it was hard to envisage a scenario where these top-10 names would be available at a discount; now we finally have that!
YCharts
When it comes to the charts, there are two key takeaways here-
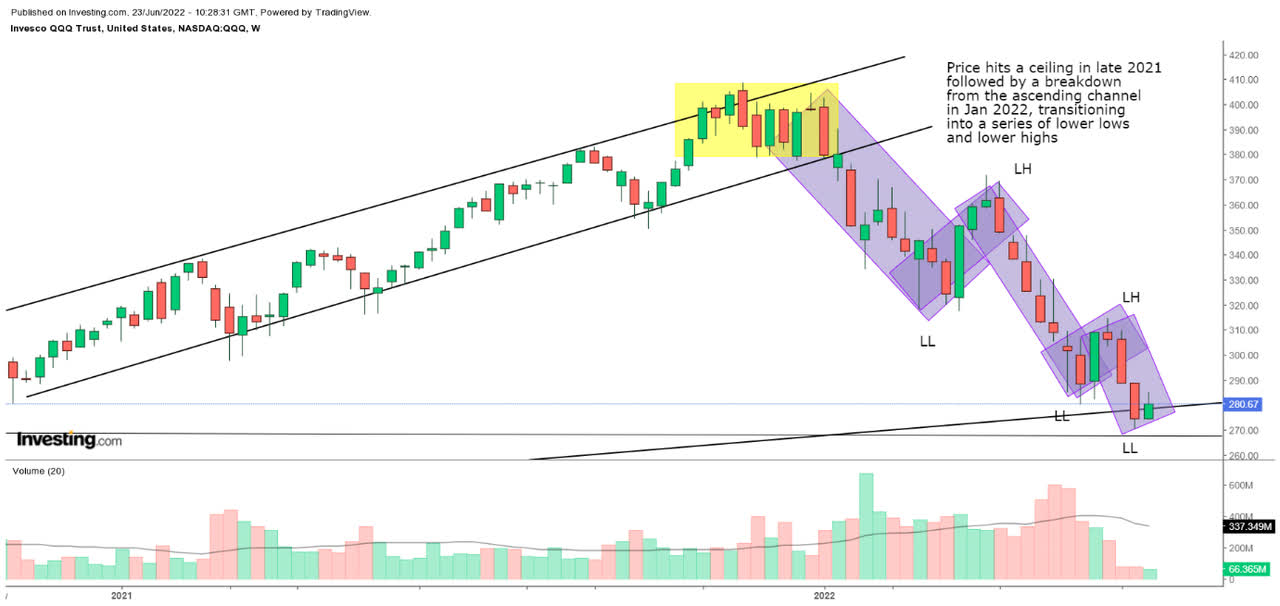
Firstly, if we look at the weekly charts, we can see that things peaked in late November with a flattening out of the price action (yellow shaded area) followed by a breakdown from the long-term ascending channel. Since then, the downtrend has been quite relentless, marked by a series of lower lows (LL), and lower highs (LH). As long as the LL and LH patterns keep alternating and there’s no indication of any bottom formation, it wouldn’t be too wise to turn constructive on QQQ.
Investing
Having said all that, if you turn to the larger time frame monthly chart which could give you a better perspective of the market structure, we can see that the price has now entered an area that had previously served as a congestion zone (August-Nov 2020). The glass half full brethren would be hoping that one would see a recurrence of the same, resulting in a potential bottom formation around this terrain. Nonetheless, if the fundamentals continue to deteriorate, we could see the price slip even further towards the mid or lower levels of its old ascending channel.
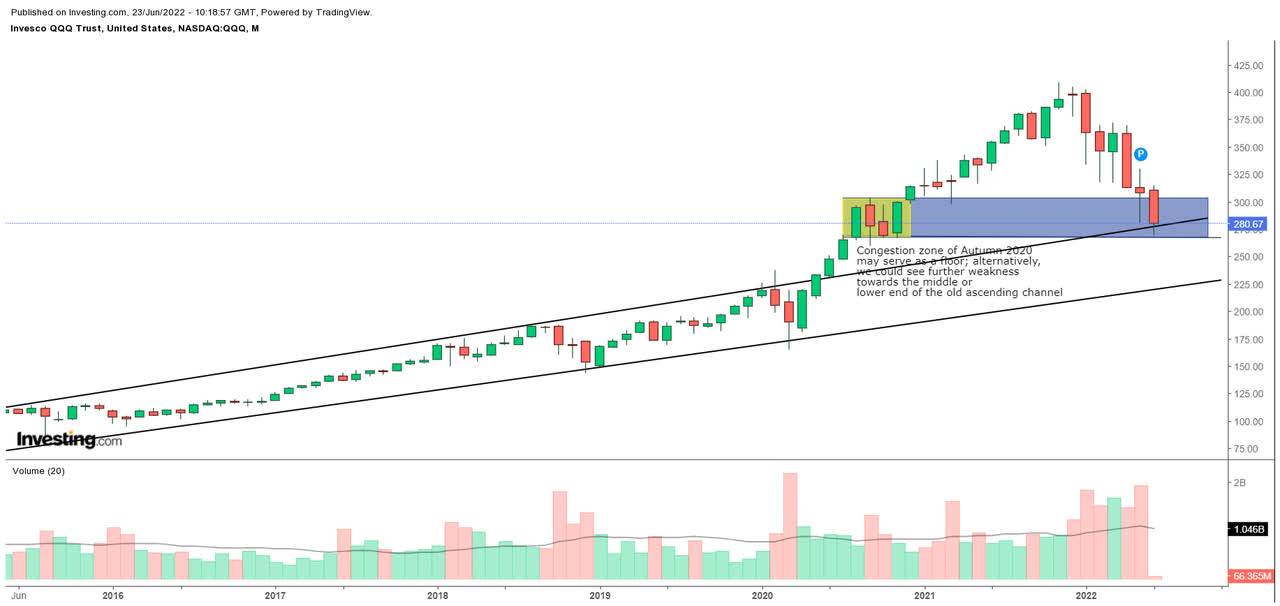
Investing
If I see some signs of bottom formation, I would be open to building a position in QQQ (even if one were yet to see any bullish triggers such as, say, a moving average crossover) buoyed mainly by the valuations of the top-10.
Now, if you’re considering going long on the leveraged product- TQQQ, I reckon, you would not only first need to see signs of a bottom formation, you’d also then need to see certain bullish triggers play out; Besides, that, in itself, won’t be sufficient. As highlighted in the previous section of the article, this product works best not only when your directional call is right, but also when the volatility of the tracking index (the Nasdaq-100) is not a dominant feature. That certainly doesn’t appear to be the case at the moment, if anything the Nasdaq-100’s standard deviation has been growing over time. Even as this is playing out, also consider that whilst the VIX has been inching up (in contrast to what we saw in 2021) it is still below the 35 levels and is still a long way from testing the GFC highs of 60 and the pandemic highs of 53.
YCharts
Put another way, the runway still looks vast, and the upside potential for even higher market volatility looks more likely, than a petering out of the same. When your directional call on the Nasdaq-100 is ambiguous at best, and volatility is likely to trend at elevated levels, that is hardly the time to be dabbling with a TQQQ.
Be the first to comment