

Manjurul/iStock via Getty Images
Investment summary
Here we examine Qiagen N.V. (NYSE:QGEN)’s suitability as an addition to a long-only, equity focused and/or balanced portfolio. In order to do this, we have to blend a combination of forward-looking insights and backward-looking analysis. Hence, this report covers the salient points for investors and portfolio managers to make an informed investment decision on QGEN on the long side.
Exhibit 1. QGEN 12-month price action
Data: Updata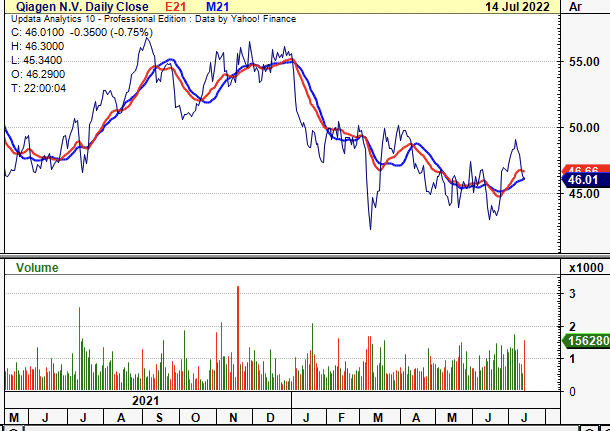
QGEN fails to justify its inclusion within this kind of portfolio setup. Valuations are at parity with the stock price and technical factors. Moreover, as predicted, loosening risk budgeting towards equity exposure only increased volatility of returns, deepens drawdown and reduces sharpe and sortino ratios. We’ve priced the stock at $44-$49 based on a blend of inputs, and without bullish price objectives to support the upside case we remain neutral on QGEN for now. There are numerous factors that could see it re-rate, however, these are offset by numerous factors. We rate shares as neutral, with a price target of $44-$49.
Market factors and catalysts
The high-beta and growth trade has completely unwound itself in FY22. Treasuries and so called “diversified” portfolios (i.e. 60/40, for example) have suffered large equity and credit drawdowns. The stock/bond correlation has been a central theme of late and is characteristic of inflation, whereby duration impacts both long-dated bonds and unprofitable equities. Hence, low-beta, high quality names have emerged as winners, underscored by profitability. In the next segment, we demonstrate the strength in QGEN’s bottom-line fundamentals, and investors should correlate the stock’s intended performance to the market date below.
Alternatives have outperformed in FY22 and have lent investors tactical and strategic alpha. Part of their success has been the de-correlation effect in portfolios, being situated on both sides of the book.
As Exhibit 2. illustrates, managed futures’ strategies (a key segment of alternatives) have broken away from the benchmark whilst its covariance structure has shifted down. This is critical to recognize when constructing equity portfolios in H2 FY22. Replicating the covariance structure of alternatives could prove to be a high-sharpe move. As Exhibit 3. shows, QGEN has exhibited similar characteristics to outperforming alternatives and this adds bullish weight to the risk/reward calculus.
Exhibit 2. Alternatives have outperformed in FY22 and lent investors strategic and tactical alpha
Replication of alternatives-like exposure is essential for portfolio construction moving forward
Data: Updata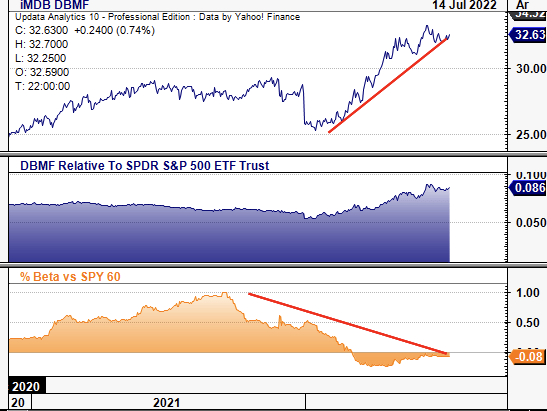
Exhibit 3. In that regard, QGEN conforms to this hypothesis and has gained in relative strength since April whilst reducing equity-beta in the process
Now further confirmation is needed from fundamental, valuation and technical factors.
Data: Updata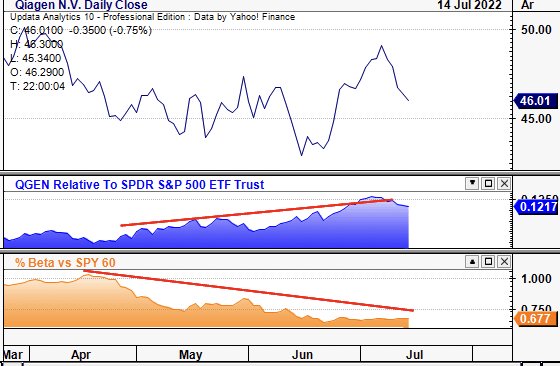
Fundamental factors
QGEN is now trading back at FY16 FCF yields of ~4.8% having wound up FCF conversion since mid-2020. It printed $576 million in FCF in FY21 and $233 million in Q1 FY22. Should it maintain that pace this annualizes to $932 million. Operating profit has remained steady with 3-year normalized operating margins of ~27%. As seen in Exhibit 4., QGEN carries extensive fundamental momentum into a higher-volatility regime. Presuming that it is a rates-driven story from here, then the distribution of outcomes for the global economy includes recession risk.
If we do enter into a recessionary world next year then investors will continue to step up in quality and liquidity. One of the best measure of this is stable, growing FCF and/or FCF margins. Moreover, the growth of FCF throughout the pandemic, although Covid-19 driven (testing etc.), illustrates the strength of QGEN’s business model. More recently, it made investments to expand its product capacity at various sites in Europe and in the US, and therefore, from FY22, it’s freed up capital for both liquidity and deployment.
Exhibit 4. Trading back at FY16 FCF yields with FCF at 7% of current market cap
Data: QGEN SEC Filings; HB Insights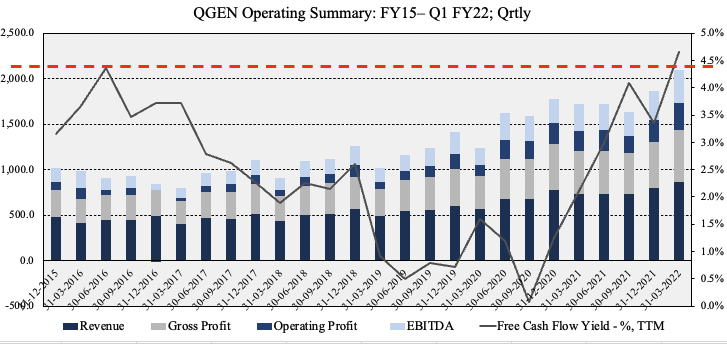
The above is supported by robust growth in return on capital with both ROA and ROIC reverting back above mean-trends. This is integral looking forward as the cost of capital continues to rise. This is where QGEN has incredible leverage and separates itself from peers. QGEN’s WACC is just 2.2%, giving it a ROIC/WACC ratio of 5.45x. The 4-year average since FY18 is 3.2x with a 4-year normalized ROIC of 7.6%. It therefore compounds cash at ~7.6% per year on average whilst covering its cost of capital by a substantial amount. Looking ahead, these factors are essential in maintaining stability in operations. This is a heavily bullish factor in the investment debate regarding QGEN.
Exhibit 5. Return on capital equally as supportive to overcome cost of capital
ROIC covers WACC by ~3.2x on average, and 5.4x in the last earnings print
Data: QGEN SEC Filings; HB Insights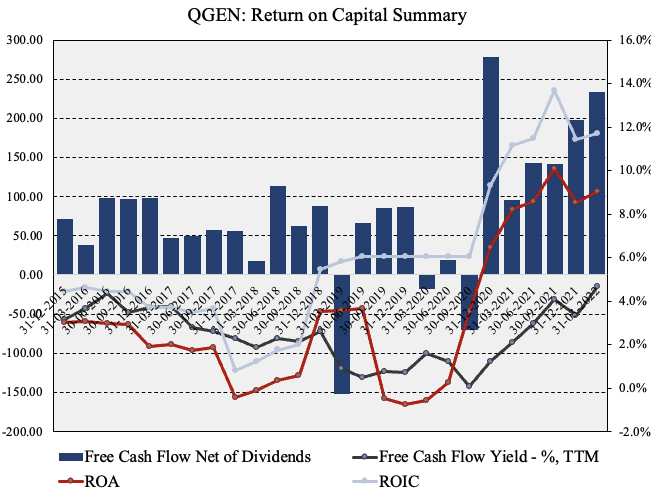
Valuation factors
Shares are trading at a ~21x forward P/E and come in at ~3x book value. They are also trading at ~14.8x EBITDA and are priced at ~5x sales. This seems pricey, however does suggest investors are expecting big things from the stock. Shares are priced at 21x FCF as well, below 5-year averages. QGEN trades at an average 11.8% premium to peers across key multiples, predominantly due to bottom-line multiples (earnings, FCF). However, as we’ve demonstrated, investors are paying a premium for these factors in FY22 and this explains the premium QGEN is trading to many peers, by estimate.
Exhibit 6. Multiples and comps
Data: HB Insights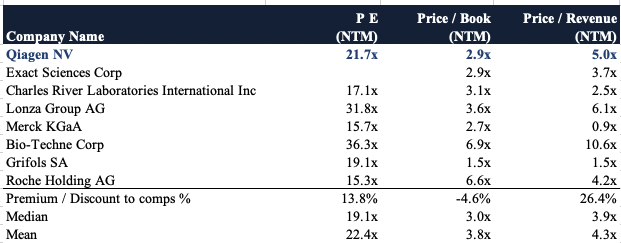
This picture is conducive to QGEN re-rating to the upside. Supporting this picture is the tight, causal relationship between the QGEN share price and its bottom-line fundamentals. Since FY14, it has held ranks with FCF consensus estimates, with a tight fit bar around 2x anomalies surrounding Covid-19. The relationship broke in November 2021 as the market began repricing growth and tech, as seen in Exhibit 7.
We believe this divergence creates a value gap to the upside as investors have punished the stock unfairly in favor of more systematic risks. Now that the market has a more systematic risk profile, it will be focused on identifying idiosyncratic risk drivers that insulate companies and ensure further upside. Hence, QGEN immediately stands out given the suite of idiosyncratic premia on offer, such as the value proposition seen in the chart below.
Exhibit 7. Diverging from bottom-line fundamentals. Could be a bullish factor. But we have to ask – why?
Data: Refinitiv Eikon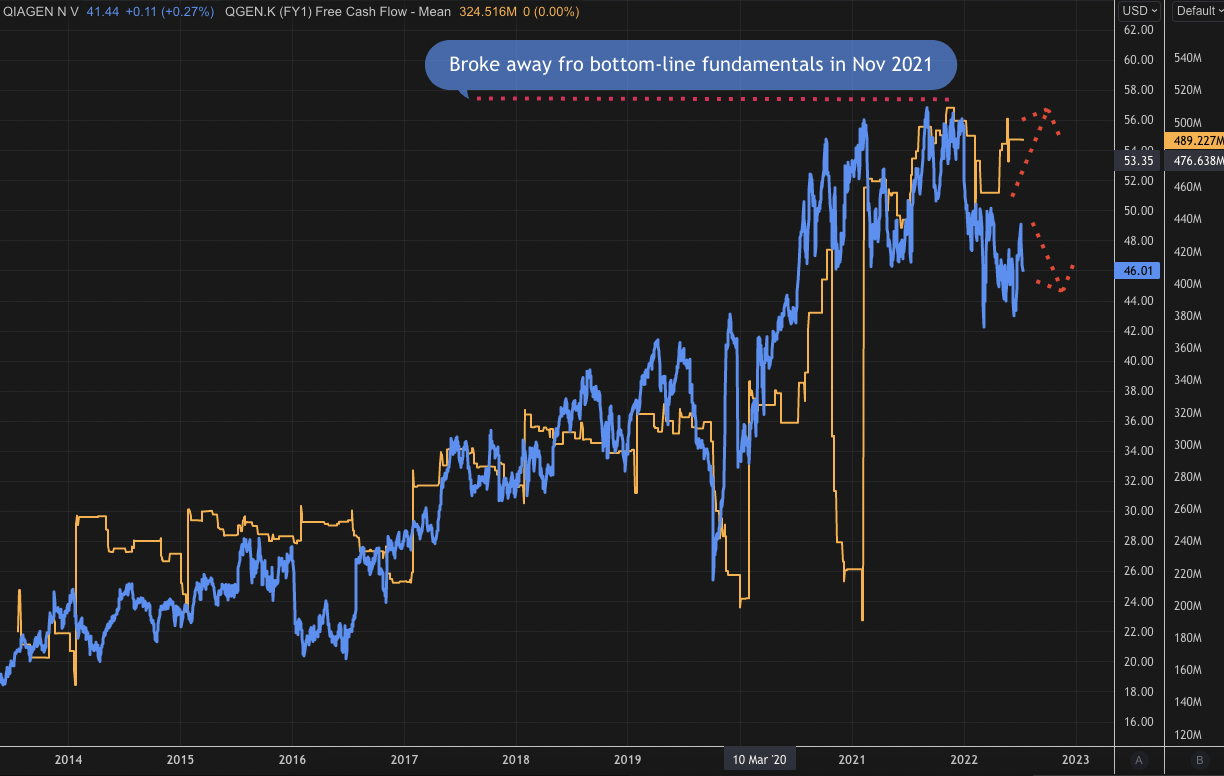
Point and figure charting removes the noise of time and let’s us focus on price action alone. Results from the study indicate there are two downside targets to $30.50 and $35, with one upside target positioned at $65. Shares are rangebound but currently testing a longer-term resistance line. Should it break through this, we’d be looking at this as bullish confirmation as a directional movement towards $65.
Exhibit 8. Multiple upside and downside targets
Data: Updata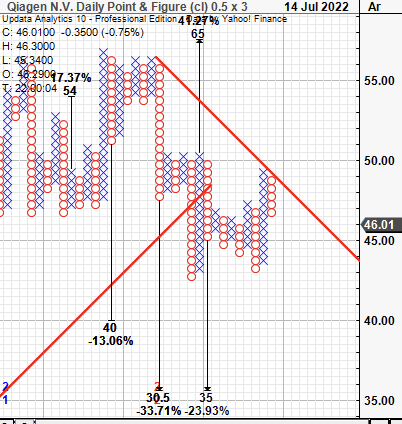
However, forecasting out, and the case on valuation weakens. We price QGEN at $43 on 21x F22 P/E, and $44.50 on FY22 FCF estimates. We’ve also forecasted discounted $45.40 unrealized tangible value (FCF/share) into FY32. Blending all these together leads to a price objective of $44, suggesting the stock could be fairly valued unless it catches a bid on factors discussed above.
Exhibit 9. Projected incremental realized value flow
Data: HB Insights Estimates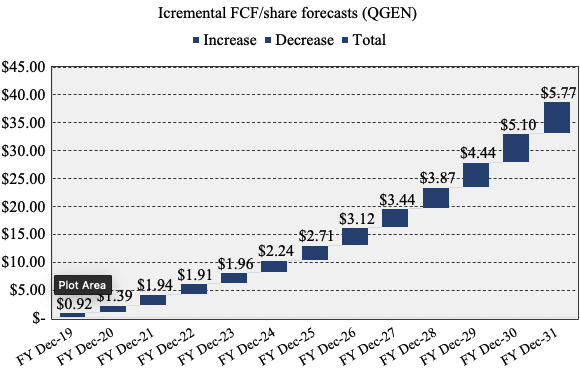
Technical factors
Shares have just broken through the cloud followed by the lag line in June and we are near-term bullish from this chart. OBV has pushed upwards since March alongside momentum yet this has yet to be fully worked into the share price. This upward divergence is a bullish factor by estimate that points to longer-term buyers outweighing current neutral traders of the stock. Hence, with the long-term view creeping up, this is set to be realized in pricing mechanics, by estimate.
Exhibit 10. Testing cloud support to the downside
Data: Updata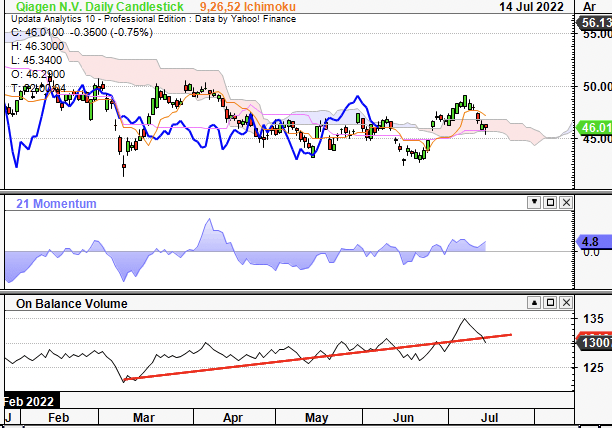
Retracing the fibs from the November high down to the March low the shares have tested the 50% of this channel on numerous occasions. This suggests this could be a key selling or buying zone, we aren’t sure without further time series data. However, it is now testing the 23% at $46 and if it bounces from here, we’d be looking to $49 as the next objective.
Exhibit 11. A bounce from here would see it retest $49 on the fibs
Data: Updata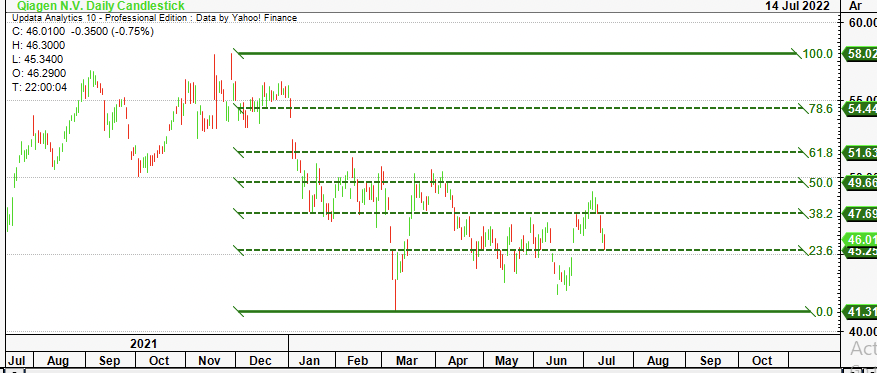
Portfolio statistical analysis
As mentioned, those portfolios with a weighting to alternatives and commodities have outperformed this year to date. Whist the commodity trade (oil & copper in particular) is showing signs of exhaustion, statistically speaking that’s where we are at. Nevertheless, portfolio optimization to examine how QGEN slots into a long-only equity portfolio corroborates our thesis.
Exhibit 12 shows the various basic weighting schedules used in our portfolio simulation. Results are demonstrated in Exhibit 13. As seen, Portfolio 2 takes the cream and has performed best this YTD. As predicted, the low-beta portfolio has outperformed, and, adding equity exposure increases volatility of returns and hurts equity return. In fact, disrupting an equal-weight, balanced portfolio as in portfolio 2 seen below results in a standard deviation of 7.5% with drawdown of 5% (portfolio 3), versus a 6% standard deviation, 3% drawdown, 0.6% total return.
This relationship continues with QGEN on all the way from an equal-weight (16.66%) to a 2% weighting, and corroborates valuation and price objective findings above.
What this suggests is that budgeting risk to additional equity exposure has hurt equity returns in FY22 and therefore investors should be focusing on names that offer a higher margin of safety – 20% would be sufficient, to still be attractive with another 20% drop in US earnings.
Exhibit 12. Portfolio weightings for summary statistics
Data: HB Insights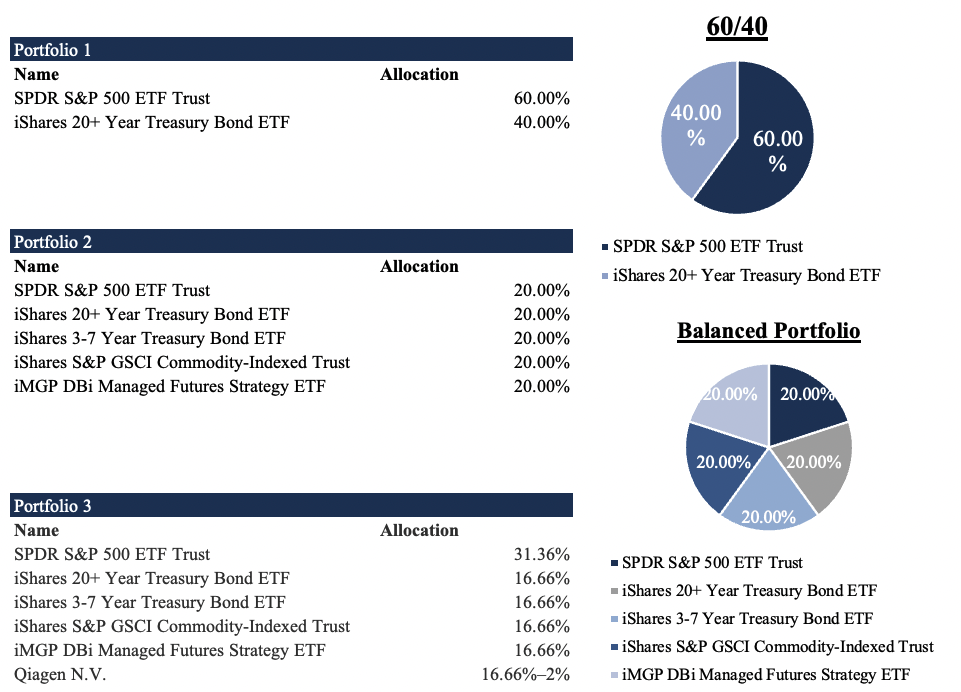
Exhibit 13. Portfolio test results
Data: HB Insights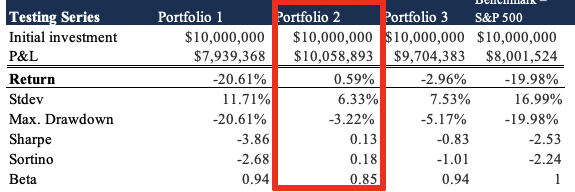
In short
The investment debate for QGEN is balance neutral. There are equal-weighting of factors on both sides, and it depends on how one seeks to position for upside capture. Whilst it has displayed an affinity to the risk premia driving equity returns in FY22, looking ahead, it remains to be seen if there’s additional upside to be realized, or if this has been discounted into the share price already.
We’ve priced the share at ~$44-$49 based on a number of inputs, suggesting this could be the case. Moreover, testing the stock within a statistical matrix and against a long-only equity portfolio sees it only add additional risk without the return compensation when looking at mean-variance optimization type models. Hence, with relevant factors on both sides of the investment debate, we rate QGEN neutral.
Be the first to comment