

imaginima
Thesis
Invesco Dynamic Energy Exploration & Production ETF (NYSEARCA:PXE) is an exchange-traded fund (“ETF”) that provides investors exposure to the Exploration & Production (“E&P”) sector with a dynamic factoring stock selection. Unlike its more static peer S&P Oil & Gas Exploration & Production ETF (XOP), PXE has proven its ability to segregate momentum stocks in the sector by a significant long-term outperformance.
Investing in E&P companies has been a very lucrative trade this year with PXE up over +26% year to date and a +17.9% performance for XOP. With certain investors now abandoning the energy inflation trade, momentum trading is going to be more important in the sector going forward. PXE is well set up to take advantage of market technicals:
The Invesco Dynamic Energy Exploration & Production ETF is based on the Dynamic Energy Exploration & Production Intellidex Index. The Fund will normally invest at least 90% of its total assets in the securities that comprise the Index. The Index thoroughly evaluates companies based on a variety of investment merit criteria, including: price momentum, earnings momentum, quality, management action, and value.
Source: Fund Fact Sheet
The Dynamic Energy Exploration & Production Intellidex Index is composed of securities of 30 U.S. companies involved in the exploration and production of natural resources used to produce energy. The companies include petroleum refineries that process the crude oil into finished products, such as gasoline and automotive lubricants, and companies involved in gathering and processing natural gas, and manufacturing natural gas liquid.
PXE exposes better risk/reward analytics and price returns on a 5-year time-frame as compared to the more popular ETF XOP:
Analytics (Author)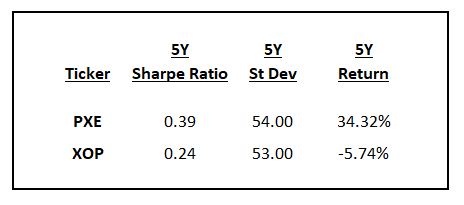
PXE has a better Sharpe ratio than XOP but a similarly high standard deviation. The fund outperforms significantly its peer XOP on a 5-year basis and generally is a better selection from a momentum lens.
We believe energy rallied a bit too fast and was due for a pull-back. We believe the current dip is due to “hot money” pursuing the inflation trade leaving the space. The fundamentals of E&P companies are continuing to improve with a significant focus on mending the balance sheet, paying down debt and pushing out maturities. The lessons of the Covid-19 crisis are not forgotten, and the space will not go into its excesses of the past for some time to come.
We like the fundamental picture and we like the fact that an investor can take advantage of the option chain present for PXE as well. For example, February 2023 at the money puts for PXE are trading with a 40% implied volatility. We therefore rate PXE as a Buy and our analysis shows the fund is a better choice over the much better known peer XOP.
Holdings
The current top names in the ETF are as follows:
Top names (Fund Fact Sheet)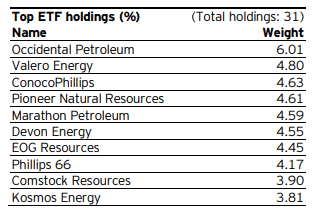
Occidental Petroleum (OXY) has been featuring heavily in the news as of late by being a Warren Buffett favorite, with the famous investor continuing to accumulate shares in the name. Valero Energy (VLO) has continued to benefit from record refining margins, with the stock trading well above pre-pandemic highs.
The geographic concentration paints a U.S.-centric exposure:
Geographic Allocation (Fund Fact Sheet)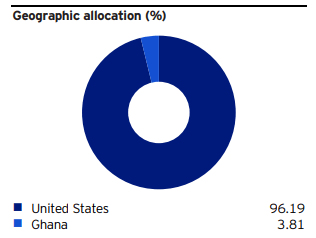
The sub-industry split outlines the main components of the ETF:
Sector Allocation (Fund Fact Sheet)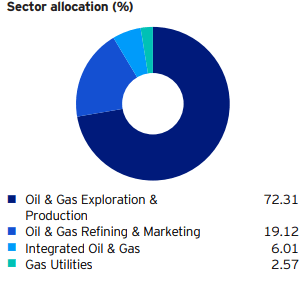
While pure Oil & Gas E/P companies provide the bulk of the exposure, the fund also runs refining margins risk via its Oil & Gas Refining & Marketing companies. We have seen this sector outperform this year based on historic high refining spreads.
Performance
PXE has outperformed both XOP and XLE on a year-to-date basis:
YTD Return (Seeking Alpha)
PXE is up over 26% as of the writing of this article versus 17.9% for XOP and 24% for XLE.
On a longer-term basis, the chart looks even more appealing:
5-Year Return (Seeking Alpha)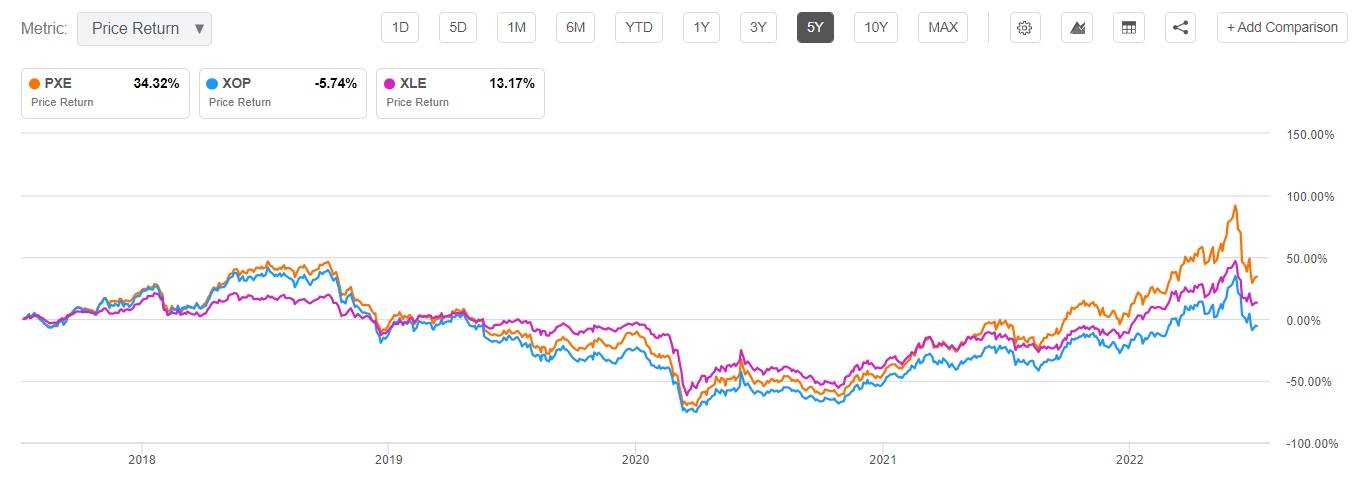
On a 5-year basis, PXE outperforms XOP by more than 40%, which is fairly surprising from a magnitude standpoint. The fund outperforms XLE by a more modest 21%.
A 10-year chart paints a similar picture:
10-Year Return (seeking alpha)
The beginning of the decade saw significant overinvestment in the E&P sector with the “drill drill baby” as the mantra for the space. After the initial oil shock of 2015/2016, E&P companies started to focus a bit more on balance sheet management but not enough to avert the significant strains put on by the Covid-19 crisis. We can see that a plain exposure to E&P producers via XOP would have yielded a very significant negative result in the past decade. PXE is up almost 10% during that time period.
Conclusion
PXE is an ETF that will normally invest at least 90% of its assets in the securities that comprise the Dynamic Energy Exploration & Production Intellidex Index. The index selects companies based on price momentum, earnings momentum, management action and quality. PXE basically pursues a momentum factoring approach when compared with the much better known name in the sector, XOP. PXE has outperformed its peer both on a 5- and 10-year basis and exposes better risk/reward analytics.
We believe Energy rallied a bit too fast and was due for a pull-back. The fundamentals of E&P companies are continuing to improve with a significant focus on mending the balance sheet, paying down debt and pushing out maturities.
Be the first to comment