

Japanese Yen Talking Points
USD/JPY trades to a freshly yearly high (137.75) on the back of US Dollar strength, and the update to the US Consumer Price Index (CPI) may fuel the recent advance in the exchange rate as the headline reading is expected to increase for ten consecutive months.
USD/JPY Clears June Range to Push RSI Towards Overbought Territory
USD/JPY clears the June range even as US Treasury yields fall back from the monthly high, and looming developments in the Relative Strength Index (RSI) may point to a further advance in the exchange rate as the oscillator is on the cusp of pushing into overbought territory.
A move above 70 in the RSI is likely to be accompanied by a further appreciation in USD/JPY like the price action seen during the previous month, and another uptick in the US CPI may generate a bullish reaction in the US Dollar as the headline reading for inflation is projected to increase to 8.8% from 8.6% per annum in May.
However, a slowdown in the core CPI may undermine the recent advance in USD/JPY as it encourages the Federal Reserve to normalize monetary policy at a slower pace, and it remains to be seen if Chairman Jerome Powell and Co. will deliver another 75bp rate hike at the next interest rate decision on July 27 as the central bank shows a greater willingness to implement a restrictive policy.
Until then, USD/JPY may continue to appreciate amid the diverging paths between the Federal Open Market Committee (FOMC) and Bank of Japan (BoJ), but the tilt in retail sentiment looks poised to persist as traders have been net-short the pair for most of 2022.
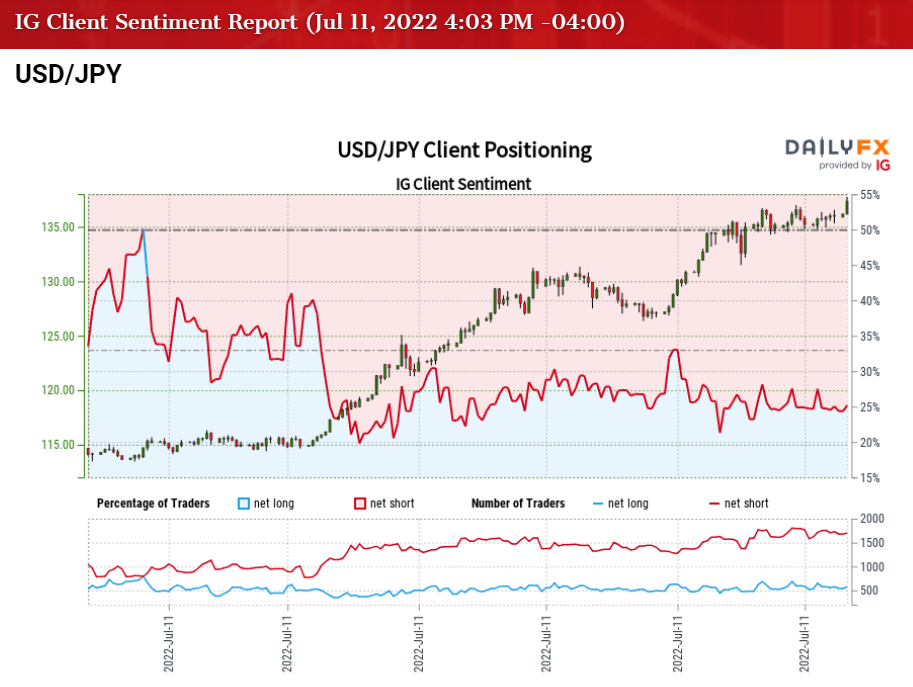
The IG Client Sentiment report shows 27.15% of traders are currently net-long USD/JPY, with the ratio of traders short to long standing at 2.68 to 1.
The number of traders net-long is 7.46% higher than yesterday and 3.43% lower from last week, while the number of traders net-short is 1.99% higher than yesterday and 2.60% higher from last week. The decline in net-long position comes as USD/JPY trades to a freshly yearly high (137.75), while the rise in net-short interest has fueled the crowding behavior as 27.52% of traders were net-long the pair during the final days of June.
With that said, USD/JPY may continue to track the positive slope in the 50-Day SMA (132.25) with the Fed on track to implement higher interest rates later this month, and the exchange rate may attempt to test the September 1998 high (139.91) as it clears the June range.
USD/JPY Rate Daily Chart
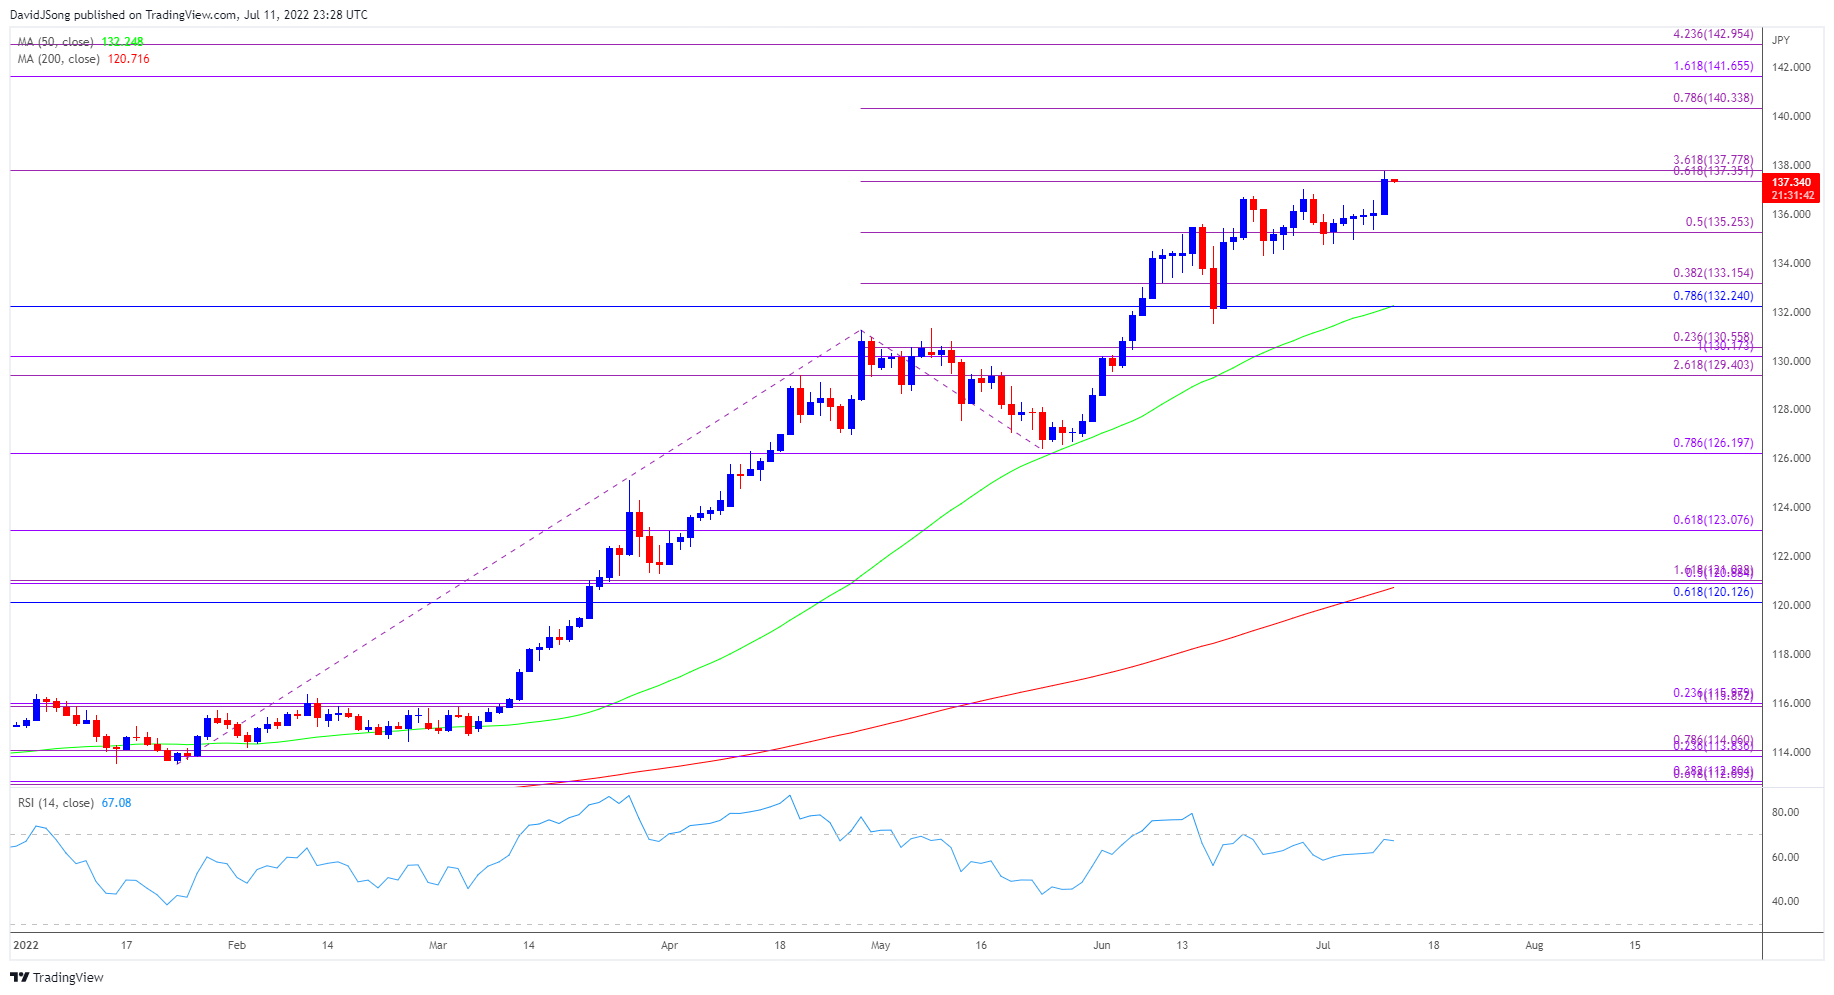
Source: Trading View
- USD/JPY clears the June range as it climbs to a fresh yearly high (137.75), with recent advance in the exchange rate pushing the Relative Strength Index (RSI) towards overbought territory.
- A move above 70 in the RSI is likely to be accompanied by a further appreciation in USD/JPY like the price action seen during the previous month, with a break/close above the 137.40 (61.8% expansion) to 137.80 (316.8% expansion) regionraising the scope for a test of the September 1998 high (139.91).
- Next zone of interest comes in around 140.30 (78.6% expansion) followed by the 141.70 (161.8% expansion) area, but lack of momentum to break/close above the 137.40 (61.8% expansion) to 137.80 (316.8% expansion) region may lead to range bound conditions in USD/JPY especially if the RSI holds below 70.
— Written by David Song, Currency Strategist
Follow me on Twitter at @DavidJSong
Be the first to comment